
記住我
In our previous study of unseeded antisolvent crystallisation of lovastatin from acetone/water, it was possible to generate lovastatin crystals with a range of particle sizes and aspect ratios [31]. The solution to antisolvent ratio was found to be the dominant process parameter in controlling size and aspect ratio; however, the 3:1 ratio used in previous work produced crystals that were too large to achieve the target final particle size of 300 μm as some of the crystals produced already exceed this size and the system showed rapid depletion of supersaturation in only 3.5 min. The initial configuration to convert the fed-batch process to a fully continuous process used a 1:1 solution-to-antisolvent ratio, with the solution prepared at 90% of the maximum solubility at 90:10 w% acetone to water resulting in a final composition of 45:55 and a minimum residence time (τ) of 5 min to ensure depletion of supersaturation.
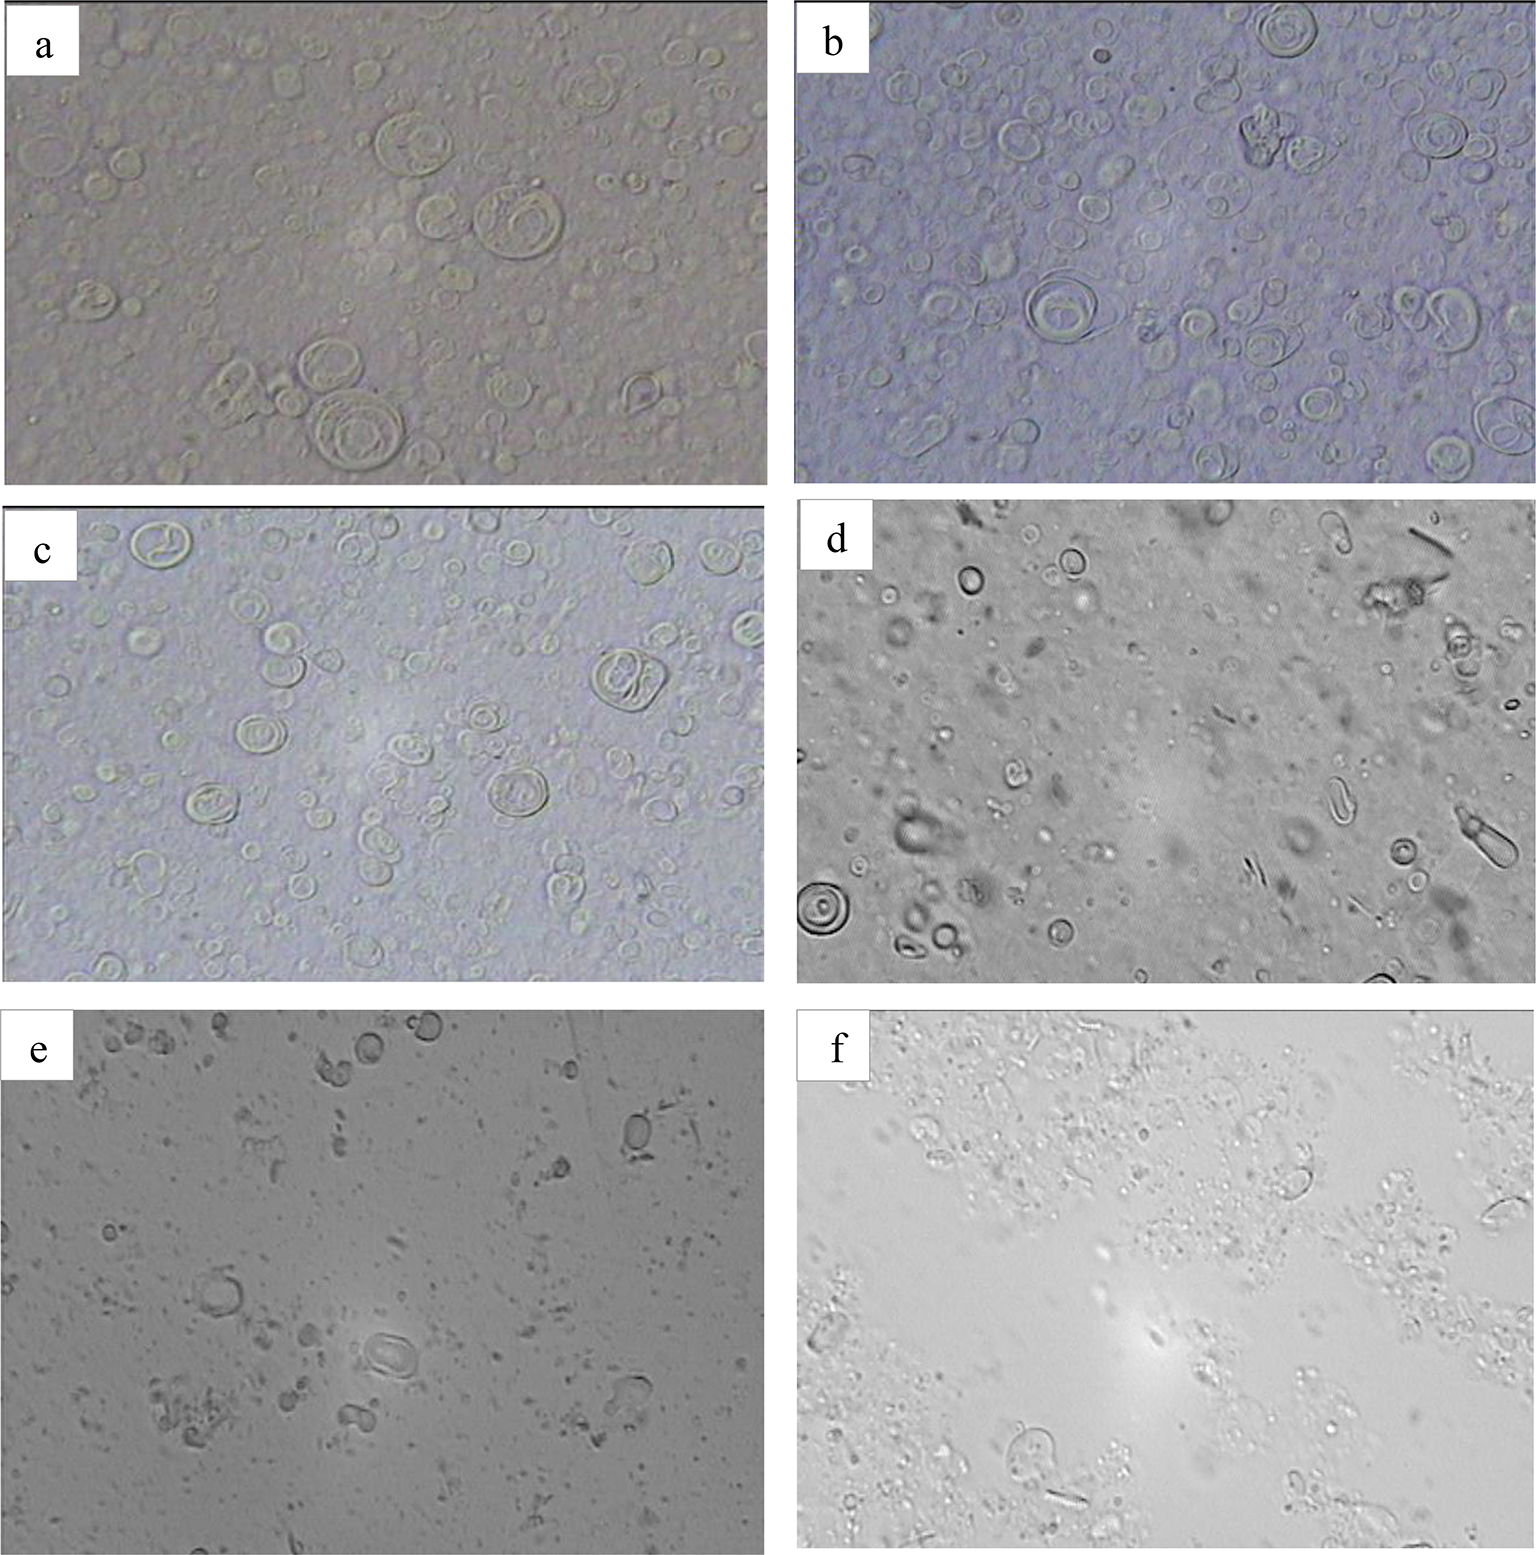
Batch Spherical AgglomerationWhen screening a BL for spherical agglomeration behaviour, three distinct outcomes are observed. When the added BL is either not feasible or is present in insufficient quantity to initiate agglomeration, primary particles remain suspended in the solution (Fig. 2a). Once enough of a suitable BL has been added, spherical agglomerates form (Fig. 2b), with distinctly spherical shapes in ideal conditions. Where excess BL is added, a paste will form (Fig. 2c). Overall Fig. 2a–c demonstrates the impact of the BSR ratio on the spherical agglomeration process outcomes. Of the thirteen solvents screened for lovastatin (Table 1), only toluene (BSR = 0.21), n-heptane (BSR = 1.00), and MIBK (BSR = 1.76) exhibited the formation of spherical agglomerates, consistent with the literature [44].
Fig. 2
Top: Results of BL screening. Differing stages of agglomerate formation from a no agglomerate formed due to wrong/insufficient bridging liquid, b agglomerate formation from correct BSR, c paste product due to excessive bridging liquid addition. d Effect of acetone concentration on MIBK as bridging liquid: (i) 0 wt% acetone, BSR = 0.30; (ii) 5 wt% acetone, BSR = 0.36; (iii) 9 wt% acetone, BSR = 0.40; (iv) 15 wt% acetone, BSR = 1.00; (v) 20 wt% acetone, BSR = 1.20; (vi) 25 wt% acetone, BSR = 1.40 and (vii) 30 wt% acetone, BSR = 1.60. Bottom: Results of batch spherical agglomeration trials e SEM image of loose agglomerate; BL, toluene. f In situ video microscopy image of agglomerates formed where BL, n-heptane, and g flow microscopy image of those agglomerates after isolation
The three candidate BLs were taken forward to preliminary integrated batch spherical agglomeration experiments. In each, lovastatin crystals were dispersed in 45:55 w% acetone to water, a solvent mixture consistent with the post-crystallisation mother liquid composition, and the candidate BL was added. Due to low interfacial tension between toluene and the acetone/water mixture, the initial droplets formed by the dolomite fluidic system quickly dispersed into finer droplets when mixing in the vessel. As these droplets were much smaller than the lovastatin crystals, agglomeration proceeded via a distribution mechanism [33], and SEM images confirm the resulting loosely bound agglomerates (Fig. 2e). Low miscibility and high interfacial tension between n-heptane and 45:55 w% acetone to water created stable n-heptane droplets. Whilst spherical agglomerates were subsequently observed using PVM (Fig. 2f), upon isolation, these agglomerates had de-aggregated into their primary particles (Fig. 2g). These weak, loosely bound agglomerates observed when using toluene or n-heptane as a BL are due to the negligible solubility of lovastatin in these solvents, resulting in a lack of any driving force for the formation of crystalline bridges between primary particles that otherwise are required to impart structural integrity to the agglomerates.
The formation of lovastatin spherical agglomerates using MIBK as a bridging liquid has been reported previously where water was the dispersing liquid [44]. However, in this work adding MIBK to a suspension of lovastatin in 45:55 w% acetone to water produced no spherical agglomeration. The acetone/water/MIBK ternary solvent system has a large region of miscibility [45], and the added droplets of MIBK can therefore disperse creating a single solvent phase. This lack of phase-separated droplets means MIBK cannot act as a binder to initiate lovastatin spherical agglomeration under these conditions.
To investigate operation outside of the acetone/water/MIBK miscible region, a series of screening experiments was conducted where simultaneously increasing aliquots of acetone (5 to 30 wt%) and MIBK (resulting BSR 0.3 to 1.6) were added to a suspension of lovastatin in water (Fig. 2d, Table S1). This demonstrated that above 9 wt% acetone and a BSR of 0.4, spherical agglomerates did not form. Investigating further, when MIBK was added to a dispersion of lovastatin in 5:95 w% acetone to water, spherical agglomeration was successful, and the particle size distribution of the isolated agglomerates (Fig. 3a) showed a significant increase in size (D50 = 256 µm) compared to the primary particles (D50 = 29.2 µm), with the bimodal shape indicating some primary particles remain. As the size measurements and microscopy images were taken post-isolation, this demonstrates that under these conditions, the resultant agglomerates are strong enough to withstand isolation operations. Therefore, for an initial configuration to convert this process to a fully continuous process, it would operate with a dispersing liquid of 5:95 w% acetone to water, MIBK as a bridging liquid, and a 10 wt% solid suspension density of primary particles.
Fig. 3
Top: Results of batch spherical agglomeration trials using MIBK as bridging liquid in 5:95 w% acetone to water dispersing liquid. a Laser diffraction measurements of primary particles and resultant spherical agglomerate product. Flow microscopy images of b spherical agglomerates and c primary particles. Bottom: Results of filtration driving force study over d full measurement range and e narrower size range highlighting differences in fraction of small particles
Batch Filtration and WashingUsing the spherical agglomerates formed in the batch trials, four filtration experiments were performed to identify the optimal filtration driving force to achieve effective filtration whilst preventing any agglomerate breakage, with screening of vacuum pressures up to 700 mbar (Fig. 3d). The appearance of a shoulder on the distributions when pressures higher than 63 mbar were applied indicates the limit of agglomerate mechanical resistance was reached and partial particle breakage occurred. Therefore, the applied pressure selected for all further filtration experiments (batch and continuous) was capped at 63 mbar. Further filtration experiments on slurries with solid densities of 1 w% or 10 w% demonstrated that the filtration of a lower suspension density produces a thin cake with rapid filtration times (Table S2), although the accuracy of the cake resistance values determined could be influenced by inadequate cake formation. It was concluded that a higher-density slurry would be preferred.
In the spherical agglomeration of lovastatin described (section “Batch Spherical Agglomeration”), the resultant mixture comprised the crystallisation solvent (acetone and water), antisolvent (water), and bridging liquid (MIBK). As lovastatin is soluble in acetone and MIBK, the presence of these solvents after washing can promote particle–particle cementation during drying leading to an increase in the size of particles or the formation of an unwanted solid cake after drying. Therefore, a washing strategy was designed to maximise mother liquor removal. A three-stage washing strategy was considered to maximise washing efficiency; an initial water wash to adequately rewet the deliquored cake from the filtration stage whilst removing residual acetone and MIBK, followed by two washes with n-heptane to remove water. As the solubility of lovastatin in water is negligible, dissolution of lovastatin during this process is not of concern. Washing with water promotes the removal of acetone and MIBK through displacement and diffusion and dilution in particle–particle pores. Using n-heptane for the final washing step replaces water with a solvent of much lower enthalpy of vaporisation and heat capacity so a lower drying temperature can be used, reducing energy requirements and drying times.
The effect of using two and four equivalent cake volumes (ECVs) for each washing stage on particle agglomeration and drying time was investigated (Table 3). Using two cake volumes (wash strategy 1) led to a reduced cake moisture content after 3600 s of drying when compared with four cake volumes. The wash solvent volume did not impact the particle size distribution.
Table 3 Outcome of washing strategy and drying experimentsCombining the results of the filtration, washing, and drying experiments, an initial configuration to convert this process to a fully continuous process is using a 10 wt% solid suspension density of spherical agglomerates, a filtration driving force of 63 mbar, washed once with water, then twice with n-heptane, each using two ECVs.
Process IntegrationWith each unit operation developed, the proposed continuous operation conditions can be coupled together to deliver a working concept of an integrated continuous process, as described by the process information summary map in Fig. 4. However, due to the semi-independent development of each unit operation, several discontinuities exist when attempting to couple the processes:
1.The crystallisation operates with an end point consisting of 45:55 w% acetone to water. In contrast, it was demonstrated that for using MIBK as a bridging liquid, a 5:95 w% acetone to water ratio was required to ensure the formation of an immiscible phase (i.e. the values in Fig. 4a and b are not consistent).
2.To ensure rapid mixing in the crystallisation X-mixer, a high flow rate of solutions is required (385.24 g/min in total). To achieve the required residence time for the spherical agglomeration at this flow rate, a cascade of stirred tanks of a total volume of 27 L would be required (Fig. 4c). This is greater than could be accommodated on the laboratory scale test bed. This total flow rate also exceeds the accessible throughput for filtration, washing, and drying cycles within the AWL CFD25 unit (Fig. 4d).
3.The slurry output from the crystallisation has a suspension density of 4.25 wt%. However, both the spherical agglomeration and filtration were developed to operate with a higher suspension density of 10 wt%. For filtration, this lower suspension density may lead to the formation of thinner cakes and poorer washing efficiency.
Fig. 4
Process information summary map for crystallisation, spherical agglomeration, and filtration unit operations based on independent development, with discontinuities between unit operations highlighted
Several changes were implemented to address these discontinuities to fully integrate the process unit operations. The total throughput of the process was decreased to accommodate the AWL CFD25 constraints; the total flow rate into crystalliser was reduced from 385.25 to 54.25 g/min. Consequently, rapid mixing of solvent streams was no longer achievable, making the use of the X-mixer unfeasible, and the crystallisation equipment was changed to a continuous stirred tank configuration where mixing is controlled via the impeller speed, whilst not affecting the addition of antisolvent or BL. To produce a solution composition from the crystallisation compatible with the later addition of MIBK for the continuous spherical agglomeration, excess water was added during the crystallisation to reach an end point of 5:95 w% acetone to water. Despite this extra addition of antisolvent, this does not increase the lovastatin crystallised yield, as solubility is negligible beyond a 45:55 w% acetone to water solvent composition. One downside of this additional dilution is the production of a slurry with a lower suspension density impacting filtration efficiency (i.e. requiring multiple aliquots of slurry into the AWL CFD25 to produce sufficient filter cake). To mitigate this, a higher initial concentration of lovastatin was used by starting with a solution at an elevated temperature of 50 °C. As a result, the lovastatin feed concentration was increased from 0.0430 g/g solution to 0.1784 g/g solution. The resulting suspension has a slurry density of 1.2 wt% which was within the operable range for the filtration platform. The outcome of this is twofold; firstly, to overcome this dilute suspension (< 10 wt%), the operating protocol for the AWL CFD25 was modified (Table 2) to allow for multiple doses of slurry to be charged, creating a filter cake of the required minimum thickness. Secondly, the quantity of MIBK needed to be adjusted from previous experiments. To evaluate this, several continuous spherical agglomeration processes (section “Batch Filtration, Washing, and Drying”) were carried out with different flow rates of MIBK, leading to different BSRs. The solution composition of these experiments relative to the two-phase boundary in the ternary system of acetone/water/MIBK is shown in Fig. 5a. It should be noted that the data used to define this phase boundary [45] is only for the ternary mixture of acetone/water/MIBK and therefore excludes the effect of lovastatin solute. Hence, this boundary was used as a guide only. When keeping the BSR constant to the batch (BSR = 0.4, Fig. 5a, orange square), the resulting solution (Fig. 5a, green diamond) is far from the two-phase boundary, and it was observed that spherical agglomeration did not occur. At the other extreme of increasing the MIBK flow rate to result in a composition within the two-phase boundary (Fig. 5a, yellow triangle), agglomeration was excessive and led to the formation of a paste adhering to the stirrer and vessel wall (Fig. 5b). Based on these results, the MIBK flow rate was chosen at 0.8 g/min to achieve a solution composition matching that of the batch spherical agglomeration (Fig. 5a, grey circle).
Fig. 5
a Solution solvent composition of experiments compared to the ternary acetone/water/MIBK system two-phase boundary [45] as a guide. b Paste-like agglomerates adhering to the stirrer and vessel wall formed with solution composition at the yellow triangle in a
These trials also demonstrated that the residence time for continuous spherical agglomeration could be much shorter than the batch time. In the batch spherical agglomeration, BL (MIBK) addition was added at a controlled rate until a target BSR was reached. This addition time dictated the batch time. However, in the continuous spherical agglomeration experiments, the MIBK flow rate was required to be proportional to the acetone/water solution flow rate to maintain the desired composition. As a result, the continuous spherical agglomeration experiments only required sufficient residence time to allow for wetting and consolidation of the spherical agglomerates.
With all these changes considered, the new process is summarised in Fig. 6. Furthermore, with the crystallisation and spherical agglomeration able to occur over similar timescales, it was decided to intensify the process by simultaneously adding the feed solution (acetone/water/lovastatin), antisolvent (water), and bridging liquid (MIBK) together into a single continuous stirred tank, resulting in the method described in sections “Continuous Stirred Tank Crystallisation (CSTR)” and “Continuous Spherical Agglomeration”.
Fig. 6
Process information summary map for crystallisation, spherical agglomeration, and filtration unit operations after the redesign to produce an integrated process. Note: Crystallisation and spherical agglomeration are shown as separate process for clarity; however, in practice, they will occur simultaneously
Continuous Crystallisation and IsolationIn the following sections (“Continuous Crystallisation and Isolation” and “Continuous Spherical Agglomeration and Isolation”), both processes were successfully run four times over a series of campaigns to demonstrate process robustness and reproducibility. The results presented here are from a single campaign where the product was material characterised and used downstream in tabletting.
The first unit operation in the process information map (Fig. 6), a continuous crystallisation experiment of lovastatin from acetone/water, was initially undertaken without continuous spherical agglomeration to validate the new proposed conditions. The process was monitored using FBRM and FTIR within the CSTR. Owing to the extensive fouling encountered in development work [31], in situ monitoring of solute concentration via UV–vis spectrometry was not used in these experiments. During process operation, FBRM data collection was paused for 38 min to allow for AE signals to be measured without noise interference. The crystallisation product was continuously isolated during process operation by filtration, washing with n-heptane (2 × 2 ECV), and vacuum drying. A mean predicted acetone fraction of 5.6 w% (standard deviation, σ = 0.2) in the solvent mixture corresponding to the expected value from the process information summary map was recorded for the first six FTIR spectra (corresponding to ca. 3 min); however, subsequently, this value begins to deviate (Fig. S3). Emergence of fouling was observed within the first 20 spectra collected (evidenced by lovastatin peaks in the FTIR spectra, Fig. S4), with fouling on the vessel walls also visually evident. In this instance, fouling has significantly hindered in situ spectroscopic monitoring.
Once the process began, the FBRM trends plateaued within two residence times (τ = 19 min, Fig. S5), indicating a steady state had been achieved. Overall, the process ran without significant intervention for 3.5 h. Samples were taken from the process vessel every 30 min during operation (seven samples total), and the particle size distribution of the particles in these slurries was estimated using laser diffraction (Fig. 7a). A wide variation (range 281–912 μm) in the estimated D90 values was observed across the sampling range, for reasons that remain unclear, and Sample 3 was designated an outlier and was omitted from statistical analysis. The D10 and D50 values do not vary significantly across the six samples, with respective mean values of 43.7 µm (σ = 15.9) and 139 µm (σ = 21.0), indicating that the process had reached steady state within the expected two residence times. The span of the estimated particle size distributions was large, at 2.51. An increase in the FBRM fouling index was also observed at 145 min from 4 to 8.5%, at which point the probe was removed for cleaning before re-inserting (appears as a spike in counts, Fig. S5). Images of the sample suspension taken during particle size estimation (Fig. S6) confirm the presence of individual, unagglomerated crystals in the suspension.
Fig. 7
a Estimated PSD metrics of process samples from continuous crystallisation experiment, sample 3 is designated as an outlier. b Estimated PSD metrics of process samples from integrated continuous crystallisation and spherical agglomeration experiment. c Particle size distribution of isolated product from the continuous crystallisation and integrated continuous crystallisation and spherical agglomeration experiments, showing the increase in particle size through agglomeration. d Comparison of compactability of tablets produced from crystallised and spherical agglomerated particles. Formulated tablet composition was 70:20:10 w% Pharmatose to Avicel to lovastatin particles. Each point is the average of ten replicates
The measured PSD (Fig. 7c). of the isolated lovastatin crystals are consistent with the process sample estimations (Tables S4 and S5), confirming that the isolation procedures did not induce any particle modification or agglomeration. The particle size D50 of the isolated product was measured at 135 µm, significantly larger than the seed material (D50 = 38.5 µm, Fig. S2 and Table S3).
Continuous Spherical Agglomeration and IsolationFollowing the successful demonstration of the continuous antisolvent crystallisation and isolation of lovastatin, the operation of the fully integrated continuous crystallisation, spherical agglomeration, and isolation of lovastatin MicroFactory was undertaken. The platform setup was identical to the previous continuous crystallisation operation (section “Continuous Crystallisation and Isolation”), with an added MIBK inlet to add BL, initiating the continuous spherical agglomeration process and operating with a BSR value at a steady state of 1.43 mL/g (Fig. 6). FBRM monitoring of the process was paused for 35 min during the process to allow for AE measurements to be recorded without sound interference from the FBRM probe, like the continuous crystallisation experiment (section “Continuous Crystallisation and Isolation”). The process was successfully operated for 4 h; however, like the previous crystallisation experiment, significant fouling on the FTIR probe led to this data not being informative. Fouling of the ATR crystal was encountered even sooner (Fig. S3), and significant fouling was once again evident in the spectra as peaks attributed to lovastatin (Fig. S4).
Once the process began, the total FBRM counts rose rapidly (Fig. S7), reaching a maximum after 45 min, consistent with the crystallisation process reaching equilibrium. The total FBRM counts subsequently decreased, indicating a fewer total number of particles were present. A synchronous decreasing trend in counts with a chord length of 10–50 µm and an increasing trend in counts with a chord length of 50–150 µm suggest spherical agglomeration was taking place in the vessel. Like the FTIR probe, the FBRM probe showed significantly higher levels of fouling in comparison to the crystallisation-only process (fouling index range from 50 to 70% compared to 4%), leading to erratic trends from 120 min onwards. Therefore, these results are given for completeness but were not relied upon for subsequent analysis.
Comparison of representative AE spectra acquired of the particles formed in the two MicroFactory experiments indicates a larger overall amplitude (Fig. S8a) and an increase in the relative intensity of the signals at lower emission frequency (Fig. S8b-c) when spherical agglomeration is taking place, indicative of larger particles forming. PCA was carried out on the AE spectra from both experiments [39]. The loadings show principal component (PC) 1 is correlated with the spectrum across the entire frequency range. PC 2 is correlated and anticorrelated to signals below and above 14.5 kHz, respectively (Fig. S9). In the scores plot of PC 1 (35.4% variance) vs PC 2 (16.6% variance), the initial data from both experiments are in the same region (Fig. S10), which is expected as the vessel contents and conditions are comparable. As AE monitoring commences ca. 7 min into both experiments, with stirring gradually increased from 50 to 700 rpm as the vessel is filled, the vessel is not filled until ca. 10 min into AE monitoring. This is observed by the data from the first 10 min of both experiments located at mean PC 1 and PC 2 scores of − 5.6 and 0.4, respectively. As both experiments progress, the PC1 score increases, which is consistent with an increase in the amplitude of AE; this could arise from an increase in the size and/or number of particles [39]. However, the spectra acquired during crystallisation-only operation have negative PC 2 scores, whilst the spectra acquired during crystallisation with continuous spherical agglomeration operation have positive PC 2 scores (Fig. S10). This implies that more AE occurs at lower frequencies during crystallisation with continuous spherical agglomeration operation than with crystallisation only, which is consistent with the formation of larger particles [39, 46]. These observations further confirm the formation of larger particles [39, 46] when the MicroFactory incorporates the spherical agglomeration operation, thus suggesting that AE monitoring is a promising technique for studying spherical agglomeration.
Consistent with the previous continuous crystallisation experiment, samples were taken from the integrated process every 30 min (eight samples total). The resulting estimated PSD metrics are shown in Fig. 7b, and as minor variation was observed in the D10 and D50 measurements across the series, it can be concluded that a steady state was reached. The D90 does show an upward trend in 6 to 8 but remains within the standard deviation of the previous samples, until the final sample. A comparison of the estimated PSD from samples taken during the two continuous experiments confirms that the lovastatin particles increased in size during agglomeration. The average particle D50 size during the process increased from 139 to 247 µm (σ = 27.1). Comparative images of the suspension during particle size estimation qualitatively support the formation of lovastatin spherical agglomerates in the integrated MicroFactory (Fig. S6). The lovastatin spherical agglomerates contained bridges strong enough to survive the filtration, washing, and drying processes, and the measured PSD metrics of the isolated product are slightly larger than the estimated values from the process samples (Tables S4 and S5). The particle size D50 of the isolated agglomerates was 336 μm, more than double that of the product when the MicroFactory was operated using only a crystallisation operation (135 μm) and consistent with our process objective of 300 μm. A small number of primary particles remain within the isolated product, as indicated by a small shoulder in the overall distribution curve (Fig. 7c). but the vast majority of solid appears to be agglomerated with a larger particle size.
Particle PerformanceA series of product characterisation and performance tests were performed on the resultant crystallised lovastatin and spherical agglomerate products. No significant differences were observed in the ToF–SIMS mass spectra acquired for the crystallised and spherically agglomerated lovastatin (Figs. S11 and S12). No additional species or potential contaminants were identified, and no BL was observed to be present in the spherically agglomerated lovastatin. The corresponding imaging data acquired for the two samples (Fig. 8) showed that the spherically agglomerated particles were larger than the crystallised particles, which is consistent with the PSD measurements.
Fig. 8
ToF–SIMS image comparison between a crystallised lovastatin and b spherically agglomerated lovastatin. For clarity, both figures have been brightened in post-processing
From the tapped and bulk density of the crystallised and spherically agglomerated powders, the Hauser ratio [47] was calculated as a measure of the powder’s flowability (Table 4). The initial value of 1.38 for the non-agglomerated powder places it in the “poor” flow character [47]. Whereas the value of 1.17 for the spherical agglomerate powder characterises the powder as “good” confirming the improvement in this key manufacturability attribute [47]. The alteration of physical attributes due to spherical agglomeration was also reflected in the compactability of the various formulations (Fig. 7d). Most notably, it can be observed that for a fixed tensile strength, tablets produced from spherically agglomerated lovastatin have a significantly higher solid fraction, i.e. a less porous tablet. From the manufacturing classification system (MCS) [48] for oral solid dosage forms, properties of an ideal direct compression material would result in a compact with mechanical properties of a tensile strength > 1.0 MPa at ~ 0.85 solid fraction. Therefore, although tablets from compaction of neither pure lovastatin sample meet this specification at a tensile strength of > 1.0 MPa, tablets from crystallised lovastatin were more porous (solid fraction ~ 0.7 to 0.8) than those produced from spherically agglomerated lovastatin (solid fraction > 0.9). It was also observed that during tabletting, the crystallised lovastatin powder required external lubrication with sodium stearyl fumarate PG-100 to prevent the compacts laminating or becoming damaged during ejection. Whereas the spherically agglomerated lovastatin powder did not.
Table 4 Comparison of pure crystallised and spherical agglomerated bulk particle propertiesAs lovastatin has a low therapeutic dose, 20/40/60 mg, to avoid the production of tablets with small physical dimensions blending with filler would be appropriate. In this case, comparison of tablet mechanical properties from formulations of 70:20:10 w% Pharmatose to Avicel to lovastatin with either crystallised or spherically agglomerated lovastatin at a dose of 20 mg showed a minor difference (Fig. 7d). This is due to the dilution of the influence of lovastatin on the mechanical properties, which will be dominated by Pharmatose and Avicel. In summary, spherical agglomeration of lovastatin has shown benefit in altering the bulk flow properties, compaction, and glidant performance of the pure materials without having any negative effects on the compaction properties of the formulated dosage form.
留言 (0)