
記住我


The local institutional review boards of Konkuk Medical Center and Daejeon St. Mary’s Hospital approved this study, and written informed consent was obtained from all participants.
PatientsFor this retrospective analysis, we selected patients from the data in the ongoing Database of Acute ischemic Stroke Analysis Network (DASAN) that contains clinical and imaging data of patients with acute ischemic stroke due to large vessel occlusion, and the data were prospectively collected from two university hospitals from January 1, 2016. The inclusion criteria of DASAN are as follows: (1) participants older than 18 years of age, (2) participants with acute ischemic stroke due to occlusion or severe stenosis of the internal carotid artery and/or M1 or M2 segment of the middle cerebral artery, or the basilar artery, and (3) participants who underwent brain CT and MR imaging including diffusion-weighted imaging (DWI), susceptibility-weighted imaging, dynamic contrast-enhanced MR angiography, dynamic susceptibility MR perfusion, and fluid-attenuated inversion recovery at admission. The inclusion criteria for this study were as follows: (1) patients with steno-occlusion of the internal carotid artery and/or M1 or M2 segment of the middle cerebral artery (MCA) who were evaluated within 8 h of symptom onset, (2) patients with follow-up DWI and angiography within 7 days, and (3) patients who presented with unchanged steno-occlusive arterial lesions on follow-up angiography. Patients with premorbid modified Rankin scale scores greater than 2, hemorrhagic transformation, procedure-related complications such as thromboembolism or subarachnoid hemorrhage, and patients who underwent craniectomy were excluded. The patients were evaluated based on demographic data, medical history, vascular risk factors, routine blood tests, brain imaging, and cardiological tests. The severity of stroke was assessed with the National Institutes of Health Stroke Scale (NIHSS). Functional outcomes were assessed on day 90 with the modified Rankin scale; a favorable functional outcome was defined as a modified Rankin scale score of 2 or less on day 90.
Imaging protocol, postprocessing, and analysisMRI imaging was performed with 3-Tesla MRI scanners (Magnetom Skyra, Siemens Healthineers and Ingenia, Philips Healthcare). The acquisition parameters were the same as those used in a previous study [14]. A neurologist (T.J.L. with 16 years of experience) who was blinded to all the clinical and other imaging data measured the baseline lesion volume and follow-up lesion volume on DWI by manual drawing using Medical Image Processing, Analysis, and Visualization (MIPAV; version 7.1.1; National Institutes of Health). The lesion growth ratio was the ratio of the follow-up lesion volume to the baseline lesion volume, which represented penumbral extent. Lesion growth was defined as a lesion growth ratio ≥ 1.2, considering the impact of vasogenic edema on the follow-up lesion volume. The baseline Tmax > 6 s volume was automatically calculated with RAPID software (RAPID; iSchemaView). The Tmax/DWI ratio was the ratio of the baseline Tmax > 6 s volume to the baseline lesion volume.
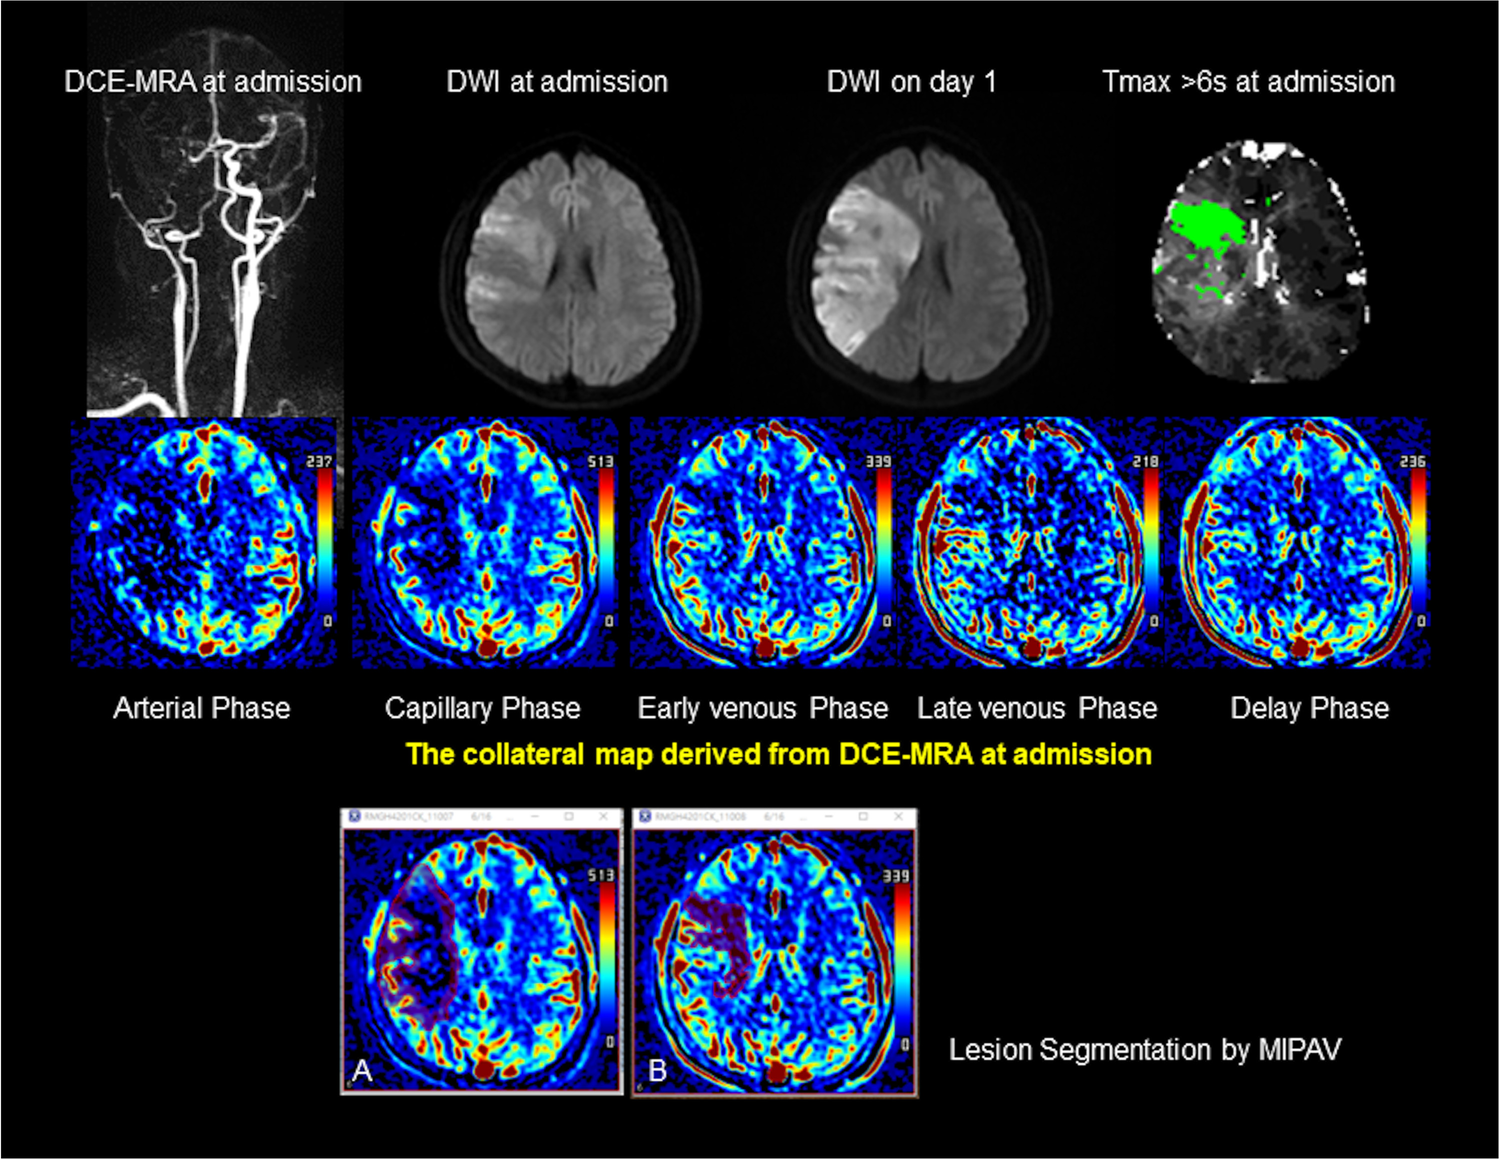
With dynamic contrast-enhanced MR angiography source data, we generated collateral maps by using an in-house program, which was composed of images in the arterial, capillary, early venous, late venous, and delay phases (Figs. 1 and 2). The phases of the collateral map were automatically divided based on arterial and venous signal intensity-time curves obtained from ROIs on the normal side MCA and the superior sagittal sinus. The details of the methodology used were the same as those used in previous studies [14, 15].
Fig.
Case of intermediate collateral perfusion grade. Images of a middle-aged patient with occlusion of the right internal carotid and middle cerebral arteries demonstrated on dynamic contrast-enhanced MR angiography (DCE-MRA). The premorbid modified Rankin scale score of this patient was 0, and the National Institutes of Health Stroke Scale score at admission was 11. The patient underwent intravenous thrombolysis followed by intraarterial thrombectomy, but recanalization of the occluded arteries was not achieved. Diffusion-weighted imaging (DWI) at admission showed an acute infarction in the right middle cerebral artery territory. The collateral map derived from DCE-MRA at admission shows an intermediate collateral perfusion status (MR acute ischemic stroke collateral perfusion score of 2: collateral perfusion delay more than one-half of the middle cerebral artery territory in the capillary phase and equal to or less than one-half in the early venous phase). The DWI lesion extent at admission coincides with the hypoperfused lesion on the early venous phase of the collateral map, so the early venous phase is determined as the baseline lesion phase. DWI on day 1 shows that the lesion growth covers the entire hypoperfused lesion seen on the capillary phase of the collateral map at admission, so the capillary phase is determined as the phase_FU. A and B are images displayed on Medical Image Processing, Analysis, and Visualization (MIPAV; version 7.1.1; National Institutes of Health), showing the hypoperfused lesion painted on images in the capillary and early venous phases, respectively, for measuring the volume of the hypoperfused lesion of the collateral map. The precise collateral ratio was calculated as the ratio of the hypoperfused lesion volume in the phase_FU to the hypoperfused lesion volume in the phase_baseline. The lesion (green area) with a threshold of > 6 s of the contralateral time-to-maximum (Tmax > 6 s) on MR perfusion imaging is similar to the baseline DWI lesion. The collateral map shows the extents of baseline lesion and final infarction precisely, but Tmax > 6 s underestimates the final infarct extent
Fig. 2
Case of good collateral perfusion grade. Images of an elderly patient with occlusion of the right internal carotid and middle cerebral arteries demonstrated on time-of-flight MR angiography (TOF-MRA). The premorbid modified Rankin scale score of this patient was 0, and the National Institutes of Health Stroke Scale score at admission was 5. The patient underwent intravenous thrombolysis followed by intraarterial thrombectomy, but recanalization of the occluded arteries was not achieved. Diffusion-weighted imaging (DWI) at admission showed acute infarction in the right middle cerebral artery territory. The collateral map derived from dynamic contrast-enhanced magnetic resonance angiography (DCE-MRA) at admission shows a good collateral perfusion status (MR acute ischemic stroke collateral perfusion score of 5: no collateral perfusion delay in the middle cerebral artery territory in the capillary phase). The baseline DWI lesion did not grow significantly on DWI on day 7. The phase_baseline and phase_FU cannot be determined in the collateral map because there is no hypoperfused lesion approximate to the baseline and follow-up DWI lesions on the collateral map. An MR perfusion image with a threshold of > 6 s of the contralateral time-to-maximum (Tmax > 6 s) shows a large penumbra (green area). Tmax > 6 s overestimates the final infarct extent
Two raters (H.G.R. with 20 years of experience and H.J.K. with 7 years of experience as a neuroradiologist and a neurosurgeon, respectively) who were blinded to all the clinical and other imaging data independently graded the collateral perfusion status of the collateral map using the collateral perfusion scores as follows: 5, excellent; 4, good; 3, intermediate to good; 2, intermediate to poor; 1, poor; and 0, very poor (Table 1) [14, 15]. Two raters determined the final collateral perfusion scores by consensus. A neurologist (S.B.L. with 22 years of experience) and a neurosurgeon (H.J.L. with 20 years of experience) who were blinded to all the clinical and other imaging data except DWI independently determined the phase_baseline and phase_FU of the collateral map by visual estimation on separate occasions 1 week apart. The phase_baseline and phase_FU were determined as phases with the hypoperfused lesions most approximate to the baseline and follow-up DWI lesions, respectively (Fig. 1). Two raters determined the final phases by consensus. A neuroradiologist (H.J.K. with 18 years of experience) and a neurosurgeon (Y.S.J. with 6 years of experience), who were blinded to all the clinical and other imaging data, measured the hypoperfused lesion volume in the capillary phases, phase_baselines and phase_FUs, using MIPAV software as follows. In the capillary phase, the areas with less perfusion in the ischemic hemisphere compared to the perfused contralateral hemisphere and, in other phases, the persisting regions of hypoperfused lesion from the capillary phase, were manually painted with free drawing brush tool on each slice (Fig. 1A and B). MIPAV software automatically calculated the painted area volumes of all slices by converting each painted area on each slice to a voxel of interest (VOI). The final hypoperfused lesion volume was determined by the average value of the volumes measured by two measurers. The collateral ratio (CR) was measured by two methods. Precise CR (pCR) was the ratio of the hypoperfused lesion volume of the phase_FU to the hypoperfused lesion volume of the phase_baseline, and approximate CR (aCR) was the ratio of the hypoperfused lesion volume of the capillary phase to the hypoperfused lesion volume of the early venous phase.
Table 1 Collateral perfusion grading system for analysis of the collateral mapStatistical analysisStatistical analysis was performed using SAS (SAS, version 9.4; Institute Inc.). The patient characteristics were expressed as the mean (SD), median [interquartile range (IQR)], or number of patients (%). We reclassified the collateral perfusion grading as follows: good collateral perfusion = collateral perfusion scores 5 and 4, intermediate collateral perfusion = collateral perfusion scores 3 and 2, and poor collateral perfusion = collateral perfusion scores 1 and 0 considering the small study population. Differences in the distribution of the patient characteristics among the collateral perfusion grades were identified using the chi-square test, Fisher’s exact test, ANOVA, and Kruskal‒Wallis test, as appropriate. The interrater reliabilities for collateral perfusion grading, determination of phase_baseline and phase_FU, and measurement of the hypoperfused lesion volume of the collateral map were measured by the Cohen weighted κ. Univariate logistic regression analysis was performed to identify independent predictors of lesion growth. Candidate predictors were presented in Table 2. The significant predictors with a p value of < 0.05 in the univariate analysis were included in the multiple logistic regression analysis with Firth’s correction [16, 17]. The results of logistic regression are reported as odds ratios (ORs) with 95% confidence intervals (CIs). The AUC, sensitivity, specificity, accuracy, positive predictive value, and negative predictive value were constructed to evaluate the prediction performance of Tmax/DWI ratio and precise and approximate CRs for lesion growth. Comparisons of performance in the prediction of lesion growth between CR and Tmax/DWI ratio were made using the Delong test, McNemar’s test, and generalized score statistics according to the type of variable. Concordance correlation coefficients were used to measure agreement between Tmax/DWI ratio (or CRs) and lesion growth ratio. The difference in concordance correlation coefficients was analyzed by the bias-corrected and accelerated bootstrap method. The results are reported as odds ratios (ORs) with 95% confidence intervals (CIs). p < 0.05 was considered to indicate statistical significance.
Table 2 Patient characteristics (n = 52) according to the collateral perfusion grades based on the collateral map
留言 (0)