
記住我


An institutional review board waiver was obtained for this validity study (METC-2020–2319).
Study populationBetween July 2020 and June 2021, patients older than 18 years, who had an available shoulder MRI or CT- scan within the last year were recruited in a single medical centre. Scans without the oblique sagittal plane or those performed with a contrast agent were excluded [8, 13, 18]. Eligible patients were invited for an US examination in the hospital.
Imaging protocol MRI/CTMRI scans were performed using the Magnetom Aera 1.5 T or Sola 1.5 T, and CT scans were made using the Somatom Definition AS or Somatom go Top (Siemens Healthineers). The oblique-sagittal plane which crosses the scapula through the medial border of the coracoid process and offers a view of the SSP fossa, was used for evaluation of FI and atrophy (Fig. 1D). On MRI, a T2-weighted, Turbo Spin echo with the following parameters: TR = 5070 ms, TE = 72 ms, FOV 150 × 150, matrix 256 × 256, slice thickness 3 mm, 28 slices were used. CT exams were made in a supine position with a kV of 120, 200 quality ref. mAs, rotation time 1.0 s, slice thickness 2.0 mm, acquisition 128 × 0.6, and a pitch of 0.6. Reconstruction was made using a b60 sharp filter, 2.0 mm slice thickness, 2.0 mm increment, and a window width and window level of 2000/500. As shown in Fig. 2D, the oblique-sagittal plane is used for the assessment of CT scans. Patients were classified in the following manner based on the presence of a tear in the SSP, ISP, or subscapularis (SSC) muscle; ‘tear’, ‘no tear’, or ‘not assessable’ [24].
Fig. 1
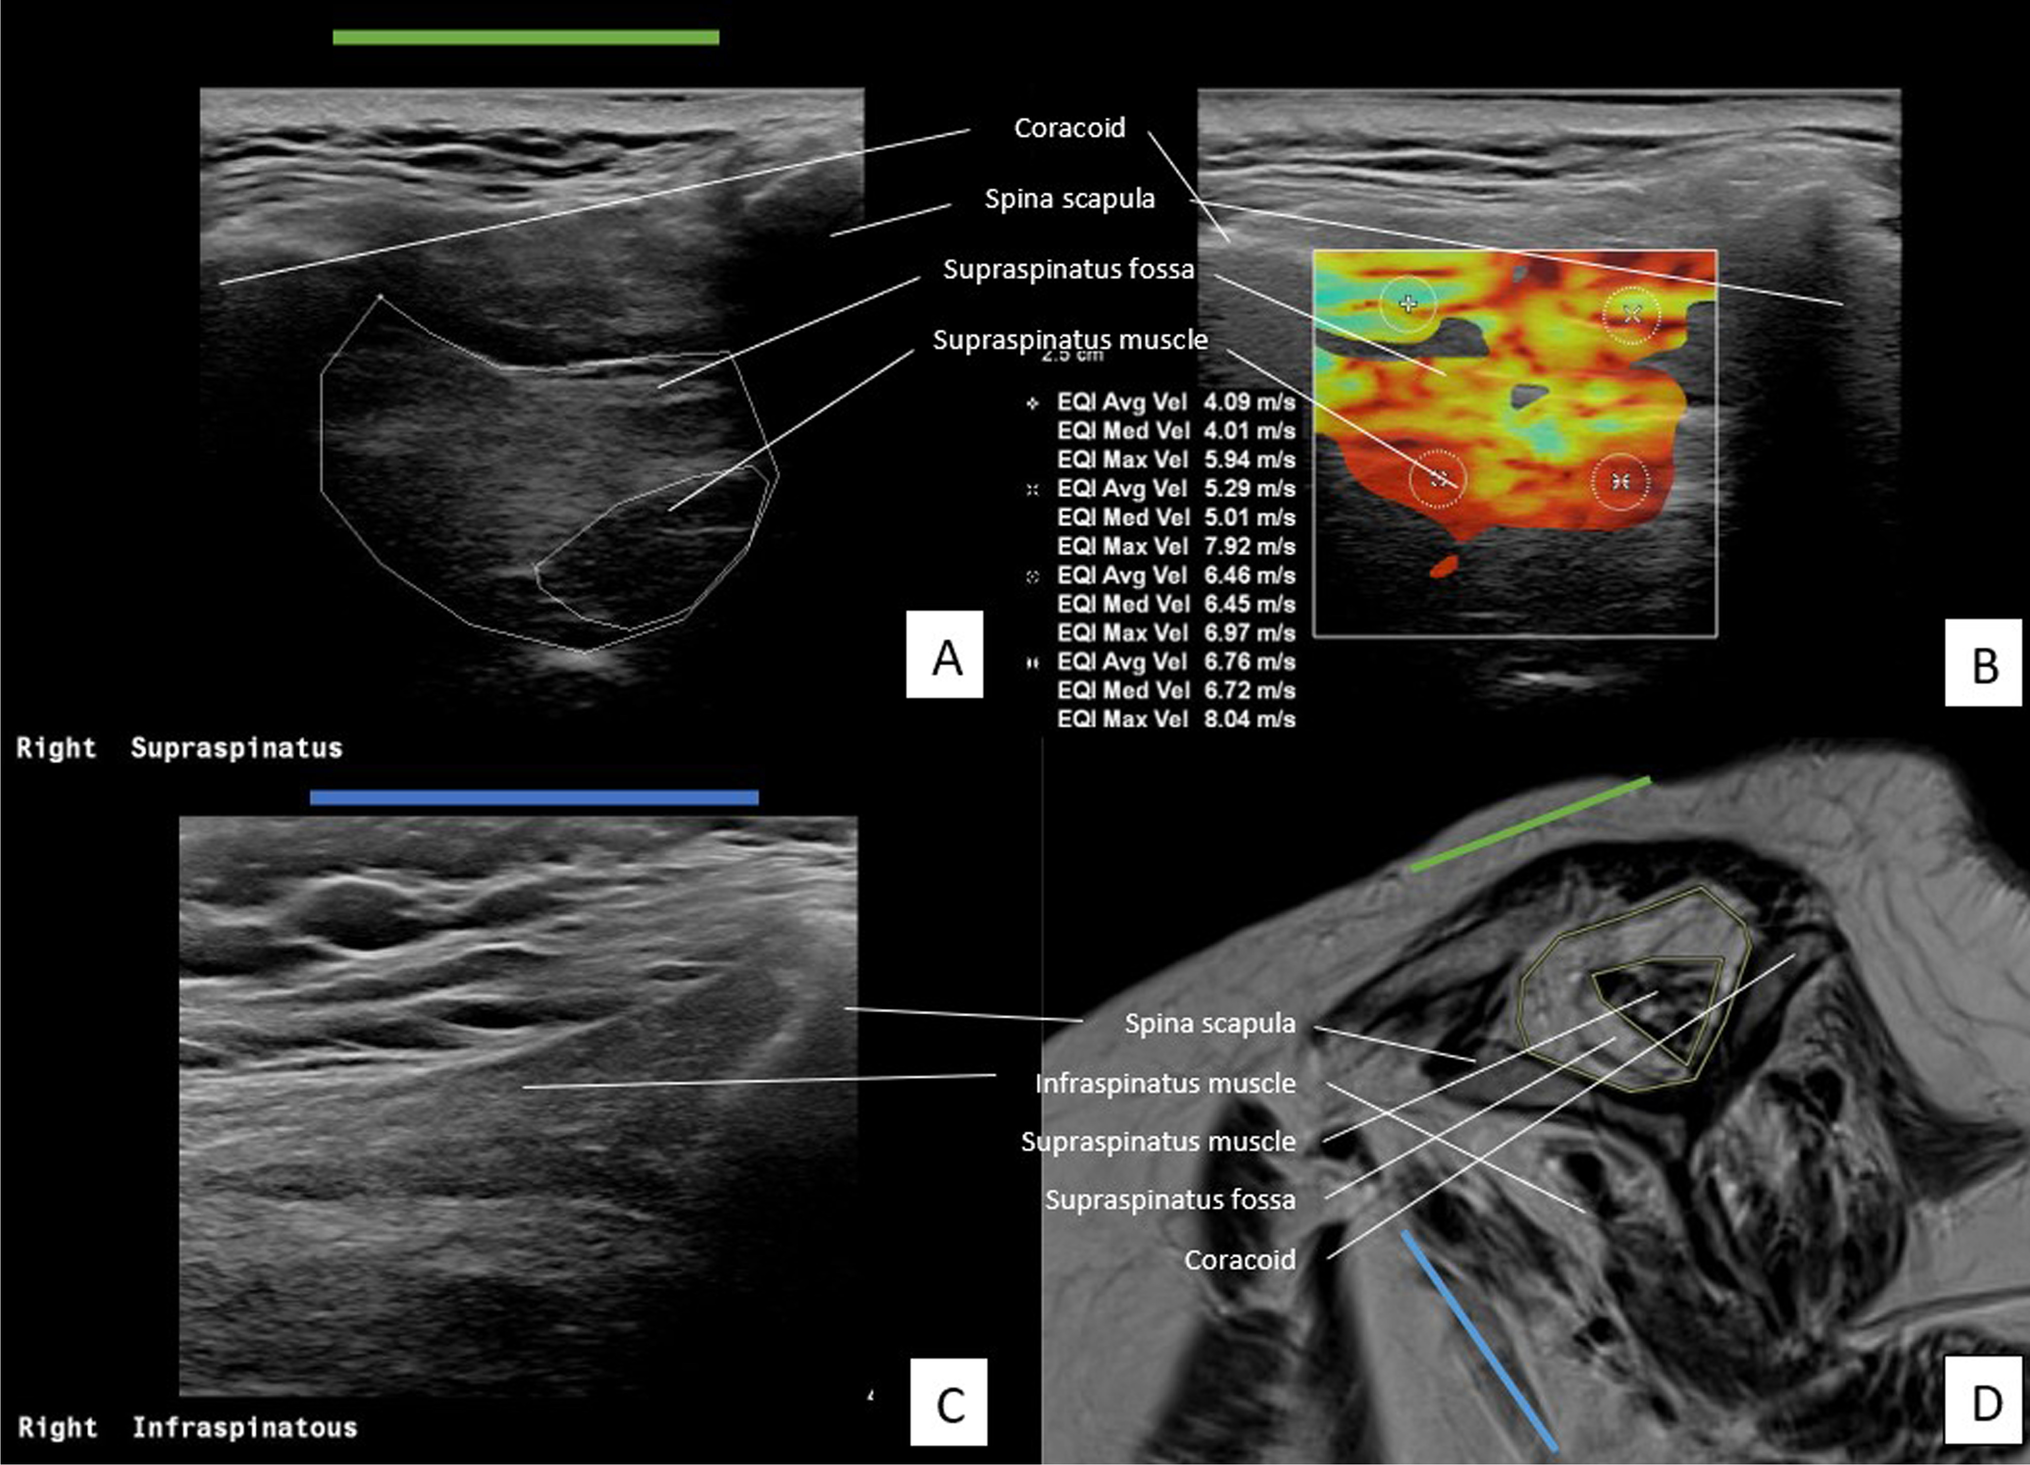
Assessment of SSP and ISP muscle on US and MRI of a patient with severe muscle atrophy and fatty infiltration of the SSP muscle. A US plane of SSP. B US plane of SSP with measurements of SWV in m/s in four quadrants. C US plane of ISP. D oblique-sagittal plane of MR image to assess SSP and ISP muscle
Fig. 2
Assessment of SSP and ISP muscle on US and CT of patient severe muscle atrophy and fatty infiltration of the SSP muscle. A US plane of SSP. B US plane of SSP with measurements of SWV in m/s in four quadrants. C US plane of ISP. D oblique-sagittal plane of CT image to assess SSP and ISP muscle
Both MRI and CT scans were used for the assessment of the Goutallier and Warner stages of the SSP and ISP muscle. The Goutallier classification, which consists of 5 stages, was used to quantify the amount of FI of the rotator cuff muscles. Grading was applied in the following manner: grade 0, no FI; grade 1, some fatty streaks; grade 2, less fat than muscle; grade 3, equal amounts of fat and muscle; grade 4, more fat than muscle [8, 25].
The method described by Thomazeau et al [20, 21] and Warner et al [26] was used for the assessment of muscle atrophy of the SSP muscle. For grading using the Warner classification, lines are drawn from the edge of the coracoid to the inferior scapular tip, from the inferior tip of the scapula to the spine, and from the scapular spine to the coracoid process on scan. If the muscle contour is convex outside both lines, there is no atrophy. If the muscle contour is even with the lines, there is mild atrophy. If the contour of the muscle is below the line, moderate atrophy is present. If there is barely any visible muscle, this is classified as severe atrophy [26].
Because of the lack of contrast between the SSP fossa and SSP muscle on CT scans only MR images were used for the quantitative assessment of muscle atrophy. The surfaces of the SSP fossa and muscle on the relevant plane were drawn and the values were entered in Castor Electronic Data Capture v.36.41 (Castor EDC, Ciwit BV) (Fig. 1D). The scans were reviewed by a musculoskeletal radiologist TK with 5 years of practical experience. The radiologist was blinded to the findings on the US.
Imaging protocol USThe Philips EPIQ 7 with a linear transducer (eL18-4) was used to perform the US. The plane that was used in the assessment of MRI/CT scans was reproduced with the transducer. There where the SSP muscle is at the level of the most prominent muscle contour in an anteroposterior direction. A visualisation of the transverse plane (in relation to the long axis of the muscle) was achieved by turning the transducer perpendicular to the long axis of the muscle belly. In this plane the fossa–muscle ratio was calculated and SWVs were measured [18]. Images A and B in Figs. 1 and 2 show the US plane used to assess the SSP muscle. The position of the transducer in which the SSP muscle is assessed is shown as a green line.
Using the method by Rosskopf et al [18] the SWV was measured in four quadrants; anterosuperior (A), posterosuperior (B), anteroinferior (C), and posteroinferior (D). Per quadrant velocity in meters per second was measured (Fig. 1B and Fig. 2B). The mean SWV (mSWV) of all quadrants was used for statistical analyses. As Rosskopf et al [18] described, test–retest and interexaminer reliability of the mean of quadrants A and B were excellent. Because of the high reliability of these upper quadrants, the mean of quadrants A and B (AB) was measured and also used in comparison with scan results.
The SSP fossa- and muscle were measured by drawing the surface according to Khoury et al [20] (Fig. 1A and Fig. 2A). The ratio between the cross-sectional area of the SSP muscle belly and that of its fossa was calculated and referred to as the occupation ratio. Visual assessment for grading by Goutallier staging was also applied to the US examination. Therefore, the Goutallier classification was collapsed to a three-point scale. The radiologist performed a visual assessment of the architecture and echogenicity for both the SSP and ISP muscle indicated by ‘Goutallier 0’, ‘Goutallier 1–2’, ‘Goutallier 3–4’, or ‘not assessable’ [13, 14].
Assessment of the ISP muscle (short axis) was obtained by turning the transducer perpendicular to the long axis of the muscle belly, with the scapular spine at the edge of the transducer. The blue line in images C and D in Figs. 1 and 2 indicates the position of the transducer to assess the ISP muscle. Blinded to the interpretation of the scan, US examination was performed by another musculoskeletal radiologist DI, with 9-year experience.
Statistical analysesData was collected using Castor v.36.41. Data analysis was performed using IBM SPSS Statistic Software (version 26). Descriptive statistics were used to report the frequency of each recorded variable. The normality of the data was tested using the Shapiro–Wilk test and Q–Q plots. Correlation between US and scan results was tested using either a Pearson correlation coefficient or the Spearman Rank test, depending on the normality of the data. The following classification was applied to interpret the Spearman’s correlation coefficient (r); poor (r < 0.29), fair (r = 0.30–0.59), moderate (r = 0.60–0.79), very strong (r = 0.80–0.99) or perfect (r = 1) (positive and negative rank correlations) [27]. Significant differences in mSWV or AB between the groups ‘tear’ or ‘no tear’ were calculated using the Mann–Whitney U Test.
留言 (0)