
記住我

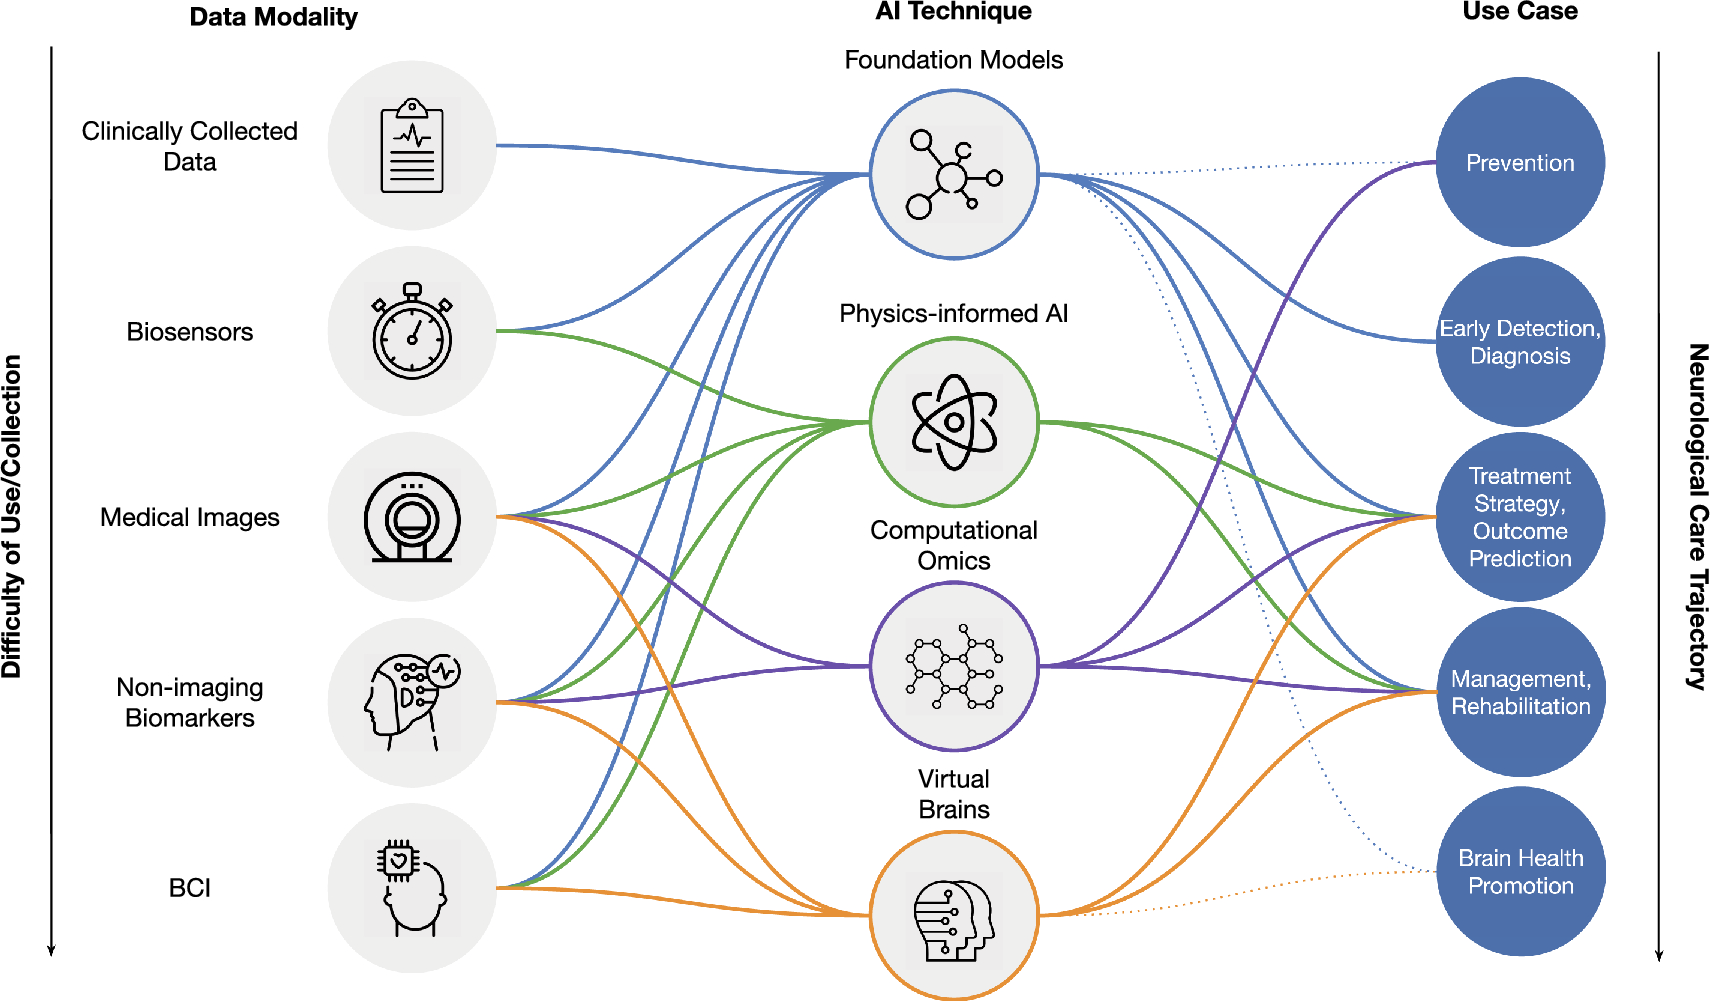
All data used in the current study were from the Alzheimer’s Disease Neuroimaging Initiative (ADNI) database (http://adni.loni.usc.edu/). This ongoing project was launched in 2003 to develop clinical, neuropsychological, and neuroimaging biomarkers for early disease detection and progression monitoring of AD.
ADNI criteria for MCI patients were: (1) subjective memory complaints, either self-reported, reported by a study partner, or reported by a clinician; (2) objective memory loss defined as scoring below an education adjusted cutoff score on delayed recall of the Wechsler Memory Scale-Logical Memory; (3) a mini-mental state examination (MMSE) score equals to or higher than 24 out of 30; (4) a global clinical dementia rating (CDR) score of 0.5; and (5) general cognitive and functional performance sufficiently preserved so that a diagnosis of dementia could not be made by the site physician at the time of screening. ADNI criteria for cognitively unimpaired (CU) participants were: (1) no report of any cognition complaints; (2) a MMSE score equals to or higher than 24 out of 30; and (3) a CDR score of 0.
Group stratification based on baseline Aβ levels and SVD severityThe amyloid positron emission tomography (PET) images underwent a standardized preprocessing procedure by the ADNI-PET Core. The standardized uptake value ratio (SUVR) was calculated as the average of the uptake values of the frontal, angular/posterior cingulate, lateral parietal, and temporal cortices divided by the mean uptake values in the cerebellum. As previously described [28], baseline Aβ positivity (A +) was defined by a SUVR ≥ 1.11. Following the research framework proposed by Jack et al. [29], MCI patients with A + were included in our study.
The burden of white matter hyperintensities (WMH) was used to reflect SVD severity and was evaluated on baseline T2 fluid‐attenuated inversion recovery (FLAIR) images according to the Fazekas et al. criteria [30]. Participants with moderate/severe WMH burden were labeled as V + (indicating vascular brain injury), while those with mild WMH burden were labeled as V − . Consequently, MCI patients with A + were further categorized into A + V + and A + V − groups, while CU participants with A − V − served as the control group. In addition, available neuropsychological tests and magnetic resonance imaging (MRI) data at 1-, 2-, and 4-year follow-ups were collected.
Demographics and cognitive assessmentDemographic information was assessed, including age, sex, education level, and APOE ε4 status. Participants with one or more ε4 alleles were identified as APOE ε4 carriers. To address the potential confounding influence of APOE ε2/ε4, all analyses will be reexamined after excluding participants identified as APOE ε2/ε4 carriers (see Supplementary Material 1). Furthermore, vascular risk factors such as hypertension, hypercholesterolaemia, diabetes, and smoking status were evaluated.
All participants underwent comprehensive neuropsychological tests involving multiple cognitive domains, including memory (Auditory Verbal Learning Test [AVLT] total recall score for trials 1–5 and 30-min delayed recall), attention (Trail Making Test, Part A [TMT-A]), executive function (Trail Making Test, Part B [TMT-B]), and language (semantic verbal fluency [SVF]).
MRI acquisitionAll participants underwent whole‐brain MRI scans using 3.0 T scanners, according to ADNI protocol. The sequence parameters of T1-weighted inversion recovery spoiled gradient recalled images were as follows: repetition time (TR) = 6.96 ms, echo time (TE) = 2.8 ms, voxel size = 1.01 × 1.01 × 1.2 mm3, matrix size = 256 × 256, and flip angle = 11°. Diffusion tensor imaging (DTI) images were acquired using spin echo pulse sequence echo-planar-imaging (SE-EPI) with the following parameters: TR = 9000 ms, voxel size = 2.7 × 2.7 × 2.7 mm3, matrix size = 256 × 256, flip angle = 90°, and the number of slices = 59. Each DTI scan consists of 46 separate images: 5 T2-weighted images with no diffusion sensitization (b0 images) and 41 diffusion-weighted images (b = 1000 s/mm2). In addition, T2 FLAIR data were obtained only at baseline using an echo-planar imaging sequence with the following parameters: TR = 9000 ms, TE = 90 ms, TI = 2500 ms, number of slices = 42, and slice thickness = 5 mm.
Cholinergic WM pathways analysisThe methods for tracking the cholinergic WM pathways largely followed the procedure described in previous studies [15, 31]. This approach comprised five key steps.
Preprocessing DTI dataWe used MRtrix3 (http://www.mrtrix.org) to remove Gibbs ringing and correct for eddy-current, head motion, and bias field. Then, fiber-orientation distributions (FODs) were determined for each participant using Single-Shell, 3-Tissue Constrained Spherical Deconvolution (SS3T-CSD) [32]. The 3-tissue response functions were estimated directly from the diffusion MRI data itself and then averaged to obtain a group average anisotropic single-fiber WM response function and isotropic gray matter (GM) and CSF response functions using an unsupervised method [33]. Finally, bias field correction and intensity normalization in the log-domain were performed on the 3-tissue compartments.
Determination of regions of interest masksFive regions of interest (ROIs) masks for cholinergic tractography—NBM, cingulum, external capsule, brainstem, and anterior commissure—were chosen based on the previous studies [15, 34]. These ROIs were then registered to individual diffusion space using a combination of nonlinear SyN registration algorithm [35] in Advanced Normalization Tools (ANTs, http://stnava.github.io/ANTs/) and FMRIB's Linear Image Registration Tool (FLIRT) [36].
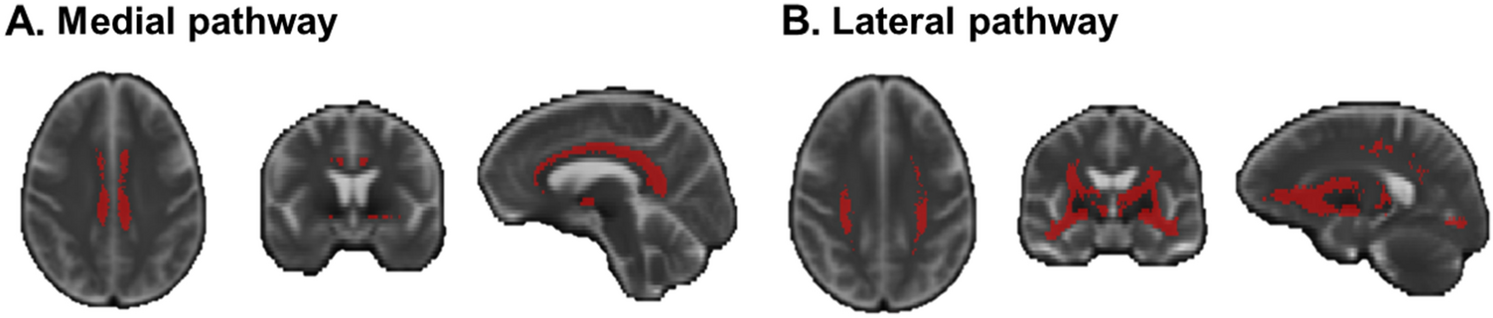
Individual tractographyTractography was performed on all CU participants using tckgen in MRtrix. The NBM ROI mask was designated as the seed mask, while the brainstem and anterior commissure ROI masks were set as exclusion mask. The cingulum and external capsule ROI masks were used to track cholinergic medial and lateral pathways, respectively. Tractography parameters: tractography algorithm: iFOD2; number of generated streamlines: 10,000; all other parameters, such as step size and angle constraints, were set to default values by MRtrix. Subsequently, a B0 template was created based on all CU participants’ B0 images using the ‘build-template’ module in ANTs. Individual cholinergic pathways were then registered to the B0 template space. Finally, only voxels that appeared in a minimum of 50% of the cases were preserved in template creation. The cholinergic WM pathways are shown in Fig. 1.
Fig. 1
Cholinergic WM pathways. The masks of cholinergic medial pathway (A) and lateral pathway (B) were displayed, respectively
Individual cholinergic pathwayAfter acquiring the cholinergic pathway templates, the individual medial and lateral pathways were warped into their respective individual spaces. Manual inspection was conducted to ensure their accuracy in individual space.
Cholinergic pathway integrity evaluationThe average MD index, which has previously been demonstrated to be sensitive to injury of cholinergic pathways [15,16,17], was utilized to characterize the microstructural properties of the cholinergic WM pathways.
NBM volumesThe methodology for obtaining the NBM volume involved three primary steps.
T1 image segmentationUtilizing the Longitudinal segmentation pipeline in the Computational Anatomy Toolbox (CAT12, http://dbm.neuro.unijena.de/cat/), all T1 images across different time points underwent preprocessing. Specifically, settings optimized for detecting significant changes such as aging or developmental effects were selected within the Longitudinal model option. Modulated GM/WM segmentations were chosen to compensate for spatial normalization effects. Initially, rigid alignment of individual T1 images created an average image, subsequently registered to CAT12's default-defined standard space. Within this standard space, subject-specific tissue probability maps for GM and WM were generated for each time point. Total intracranial volume (TIV) was also obtained from this segmentation process.
NBM maskNBM mask, initially acquired in MNI space, was registered to CAT12's default-defined standard space. This registration process involved nonlinear SyN registration algorithm in ANTs to align the MNI space T1 images with CAT12’s default-defined standard space T1 images. The deformation map obtained from this alignment was then applied to the NBM mask, resulting in the acquisition of CAT12’s default-defined standard space NBM mask.
NBM volume calculationThe GM probability map obtained in the first step and the NBM mask acquired in the second step were multiplied together to calculate the NBM volume for each participant.
Measurement of WMH volumeQuantitative WMH volumes were also measured on baseline T2 FLAIR images by an automatic segmentation tool (Lesion Segmentation Tool, LST) using a lesion prediction algorithm (LPA) based on Statistical Parametric Mapping software (SPM12, http://www.fil.ion.ucl.ac.uk/spm). The automatically created WMH images were then manually corrected to avoid incorrect segmentation. WMH volumes were automatically extracted by LST. For analysis, WMH volumes were normalized to the TIV and subsequently log-transformed to meet normal distribution.
Statistical analysisStatistical analysis was performed using SPSS statistical software (version 26; SPSS, Inc., Chicago, IL) and R studio (version 4.1.3). Results were considered statistically significant at P < 0.05 (two-tailed).
Cross-sectional comparison among groupsAge, years of education, cognitive measures, cerebral Aβ levels, and WMH volume were compared among the CUA−V−, MCIA+V−, and MCIA+V+ groups using one-way analysis of variance (ANOVA), followed by post hoc tests with Bonferroni correction for multiple comparisons. The Chi-square test was used for categorical variables, including sex, APOE genotype, and vascular risk factors. After adjusting for age, sex, education, and TIV, the NBM volume and cholinergic pathways MD were compared between groups using ANOVA, followed by pairwise post hoc tests with Bonferroni correction.
Cross-sectional associations between WMH burden and cholinergic deficits and the mediation analysis in MCI patientsWe conducted partial correlation analysis to examine the relationship between WMH burden and cholinergic deficits in MCI patients, with age, sex, and education as covariates. To investigate the potential mediating role of cholinergic deficits in the connection between WMH burden and cognitive impairment, we initially conducted partial correlation analyses involving the cholinergic system and cognitive performance. This step was essential as mediation analysis requires the presence of significant associations between WMH burden and the cholinergic system, as well as between the cholinergic system and cognitive performance. Subsequently, upon confirming these significant associations, we employed mediation analysis to determine whether WMH could potentially contribute to cognitive impairment through cholinergic injury in MCI patients using the PROCESS macro v3.5 in SPSS. We performed bias-corrected bootstrapping with 5000 replications to estimate the indirect effect. An indirect effect through mediators between the independent and dependent variables is significant if the 95% confidence interval (CI) does not include zero. In this analysis, we considered normalized NBM volume (TIV-corrected), medial pathway MD, and lateral pathway MD as separate mediators, with WMH volume as the independent variable. Different cognitive domains were successively entered as dependent variables. Age, sex, and education were included as covariates.
Longitudinal changes in cholinergic system among groupsLinear mixed models were used to examine longitudinal changes in cholinergic system. The analyses were performed using the ‘lme4’ package R studio [37, 38]. We tested the longitudinal changes in cholinergic system among groups. The model included age, sex, education, group (CUA−V− vs. MCIA+V−, CUA−V− vs. MCIA+V+, MCIA+V− vs. MCIA+V+), time (i.e., number of years from baseline), and group × time as fixed effects, while time was modeled as a random effect (random intercepts and slopes) for each participant. We separately analyzed three dependent cholinergic markers including normalized NBM volume, medial pathway MD, and lateral pathway MD.
Mediating effects of cholinergic changes between WMH burden and cognitive changes in MCI patientsTo explore the potential mediating role of changes in the cholinergic system in the relationship between WMH burden and cognitive alterations, we conducted partial correlation analyses involving WMH burden and cholinergic changes, as well as cholinergic changes and cognitive changes. After confirming these significant associations, we used mediation analysis to study whether WMH burden contribute to cognitive changes by accelerating cholinergic system degeneration. Baseline WMH burden was considered as independent variable. Slopes of normalized NBM volume change, medial pathway MD and lateral pathway MD were set as mediators separately. Different cognitive domains slopes were successively entered as dependent variables. The measurement of slopes was extracted for each patient using linear mixed-effects regression with random effects of intercept and linear slope (with respect to time). Age, sex, and education were included as covariates.
留言 (0)