Participants
We conducted a power analysis based on previous literature to determine the necessary sample size to reach 80% power to detect a difference of 10 mg/dL in average glucose. The 10 mg/dL difference is based on the change in average glucose for resting compared to exercise (DuBose et al. 2021), but we used a smaller value because we expected a smaller change based on EB usage. We used a standard deviation of 17 mg/dL (Shah et al. 2019). Based on this analysis, the necessary sample size to reach 80% power was 13 subjects. Twenty-three middle-aged, healthy adults (13 women; age = 52.8 ± 12.7 years (range = 28–67 years) participated in the present study (Table 1). None of the participants indicated that they regularly rode any type of bicycle. They all self-reported walking on average five days each week and engaging in moderate physical activity an average of three days each week. Based on IPAQ data, virtually all participants were active and met the minimum guidelines for physical activity. All participants gave written informed consent for the study after receiving a detailed explanation of the study and study procedures were conducted in accordance with Miami University’s Internal Review Board. All human studies have been approved by the appropriate ethics committee and have therefore been performed in accordance with the ethical standards laid down in the 1964 Declaration of Helsinki.
Table 1 Participant characteristics (n = 23)Study design
This was a crossover study with the first week serving as a control for all. Participants reported to the laboratory at the beginning of week one (day 1) and at the end of week two (day 14). During the first week, participants were instructed to continue their regular activities. On day 7, participants were provided an EB to ride at least 3 days that week, for a minimum of 30 min·day−1. Each participant served as their own control. The EB (Gazelle Medeo T9 HMB, Dieren, Netherlands) was a class 1 step-through pedal electric with 20 mph top speed. Power was provided by a Bosch Active Line Plus (50 Nm) engine with 400 Wh connected to a 36 V lithium ion battery. The EB weighed 19 kg with 2.7 kg attributed to the battery and rack. The battery provided power to the bicycle crank during pedaling, which assisted the rider up to a speed of up to 20 mph, a state requirement to be considered a bicycle. The electric system has both speed and impulse sensors that determine the amount of assistance provided by the motor based on the assistance level setting that each participant controls on the handlebar and the force each participant applies on the pedals.
Study variables
On day 1 and day 14, participants had their height, body composition (InBody 770, Cerritos, CA), resting blood pressure and heart rate (OMRON, Kyoto, Japan), carotid-femoral pulse wave velocity (cf-PWV), blood lipids and glucose, plasma insulin, hemoglobin A1c (HbA1c), and plasma endothelin-1 (ET-1) measured following an overnight fast.
On day 1, participants completed a YMCA submaximal cycle ergometer test to predict VO2peak (Golding 2000). This test was performed on a stationary cycle ergometer and lasted between 7 and 12 min. Heart rate (Polar T31 HR monitor (Kempele, Finland) and rating of perceived exertion (RPE) were monitored every minute during the submaximal test. Next, participants had a continuous glucose monitor (FreeStyle Libre Pro, Abbott Laboratories, Chicago, IL) placed on the back of their arm as well as a physical activity monitor (PAL Technologies, Scotland UK) placed on their thigh. Both monitors were worn for the entire 14 day duration of the study. If a sensor fell off the participant was provided a new sensor as soon as possible. Data was extracted and exported as txt files to GlyCulator 3.0 (Chrzanowski et al. 2023) for analysis of 24 h daily averages of mean glucose, glucose standard deviation (SD), glucose coefficient of variation (CV), and percentage of time in healthy range (TIR) (70–120 mg·dl−1). Only days with 24 h of complete data were used and 24 averages of the days of week 1 and week 2 were compared. Data from the ActivPAL accelerometers were exported into PAL software suite version 8 for activPAL management, data visualization and data processing, and outcomes were determined using the CREA enhanced algorithm (Montoye et al. 2022); only days with a full 24 h of wear were included in the analysis, and participants had to have at least three days of included ActivPAL data in each week to be included in the analysis. Active outcome measures from the ActivPAL included total daily steps, activity score (METs), upright time, stepping time, cycling time, moderate- and vigorous-intensity time, and breaks in sedentary time. Sedentary outcome measures included primary and secondary lying time, seated transport time, average duration of sedentary bouts and total sedentary time.
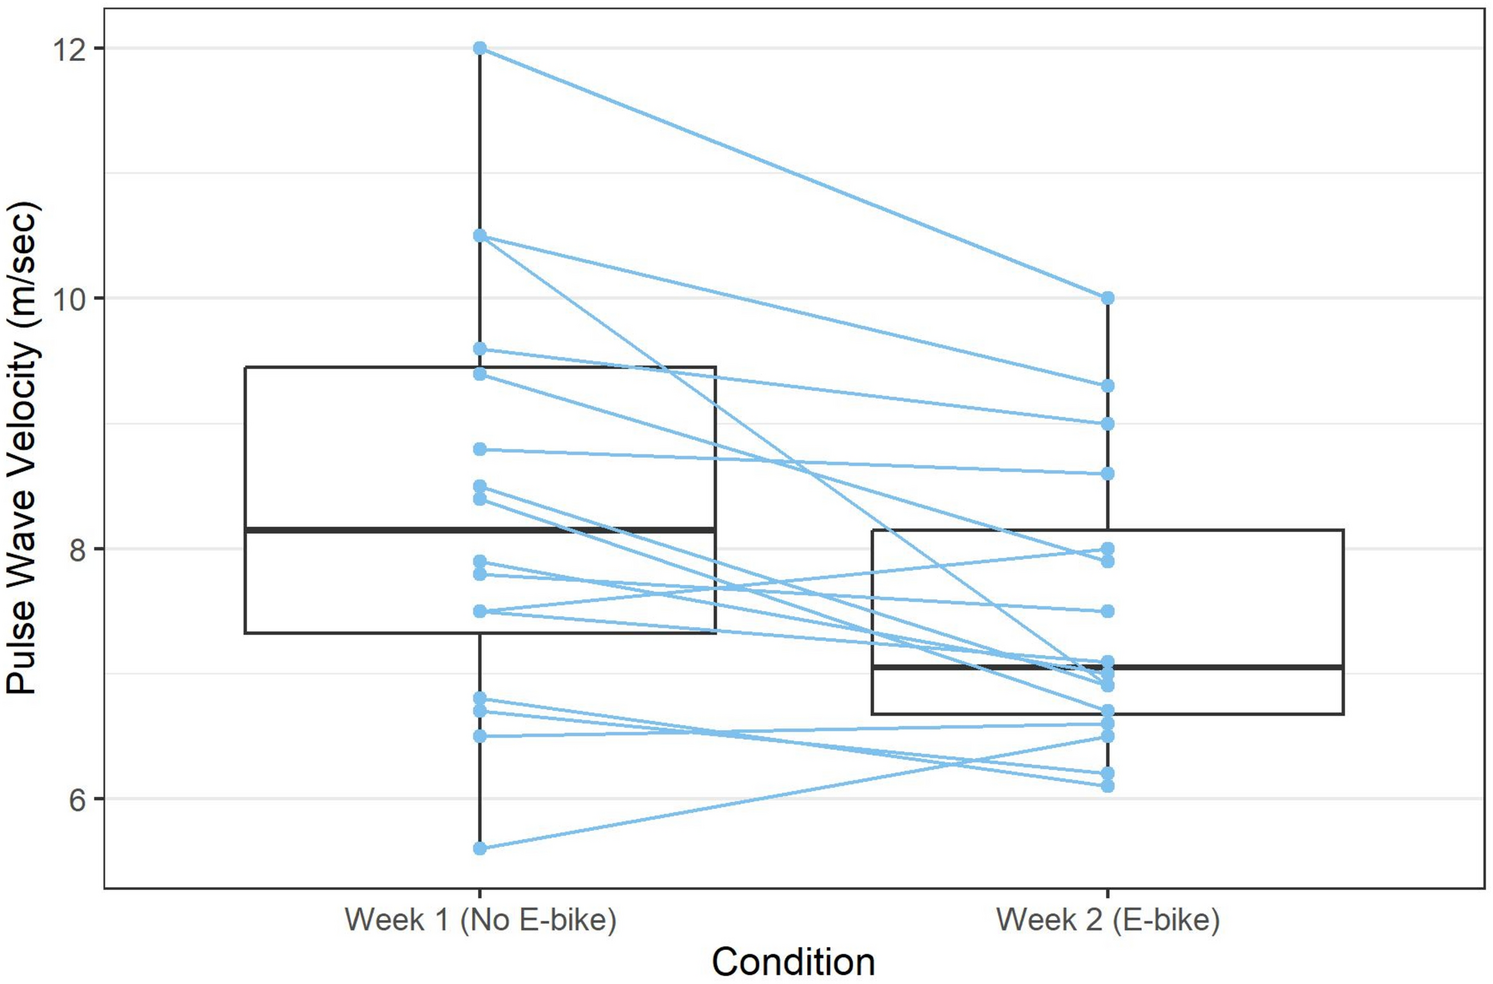
Carotid-femoral pulse wave velocity (cf-PWV) was measured on day 1 and day 14 using the SphygmoCor XCEL system (AtCor Medical, Naperville, IL) following 10 min of supine rest. All cf-PWV measurements were performed by the same trained technician. Due to technician availability, baseline and post-intervention cf-PWV values are reported for 16 participants.
Whole blood was collected from an antecubital vein into evacuated tubes for the determination of fasting blood lipids, glucose (Abbott Cholestech LDX Analyzer, Abbott Labs, Orlando, FL), and HbA1c (Alere Afinion, Abbott Labs, Orlando, FL). Plasma was obtained by centrifugation and stored at − 80 °C until analyzed. Plasma endothelin-1 (ET-1) was measured in duplicate (intra-assay CV = 5.1%) as previously described (Ballard et al. 2021) using an enzyme-linked immunosorbent assay (ELISA) kit in accordance with the manufacturer’s instructions (R and D Systems, Minneapolis, MN). Plasma insulin was measured using an ELISA kit in accordance with manufacturer’s instructions (Alpco, Salem, NH). Homeostatic model assessment of insulin resistance (HOMA-IR) was calculated (Gutch et al. 2015).
Statistical analysis
All descriptive statistics are shown with mean and standard deviations. Paired t-tests were performed to compare the dependent variables between Week 1 (without EB) and Week 2 (with EB). A box plot was used to visualize the difference in pulse wave velocity between Week 1 and Week 2, with profiles to show the change for each individual subject. All statistical analyses were performed with R version 4.1.1 (R Core Team 2020). Normality was assessed with normal quantile–quantile plots, which determined that parametric methods were reasonable.


留言 (0)