
記住我


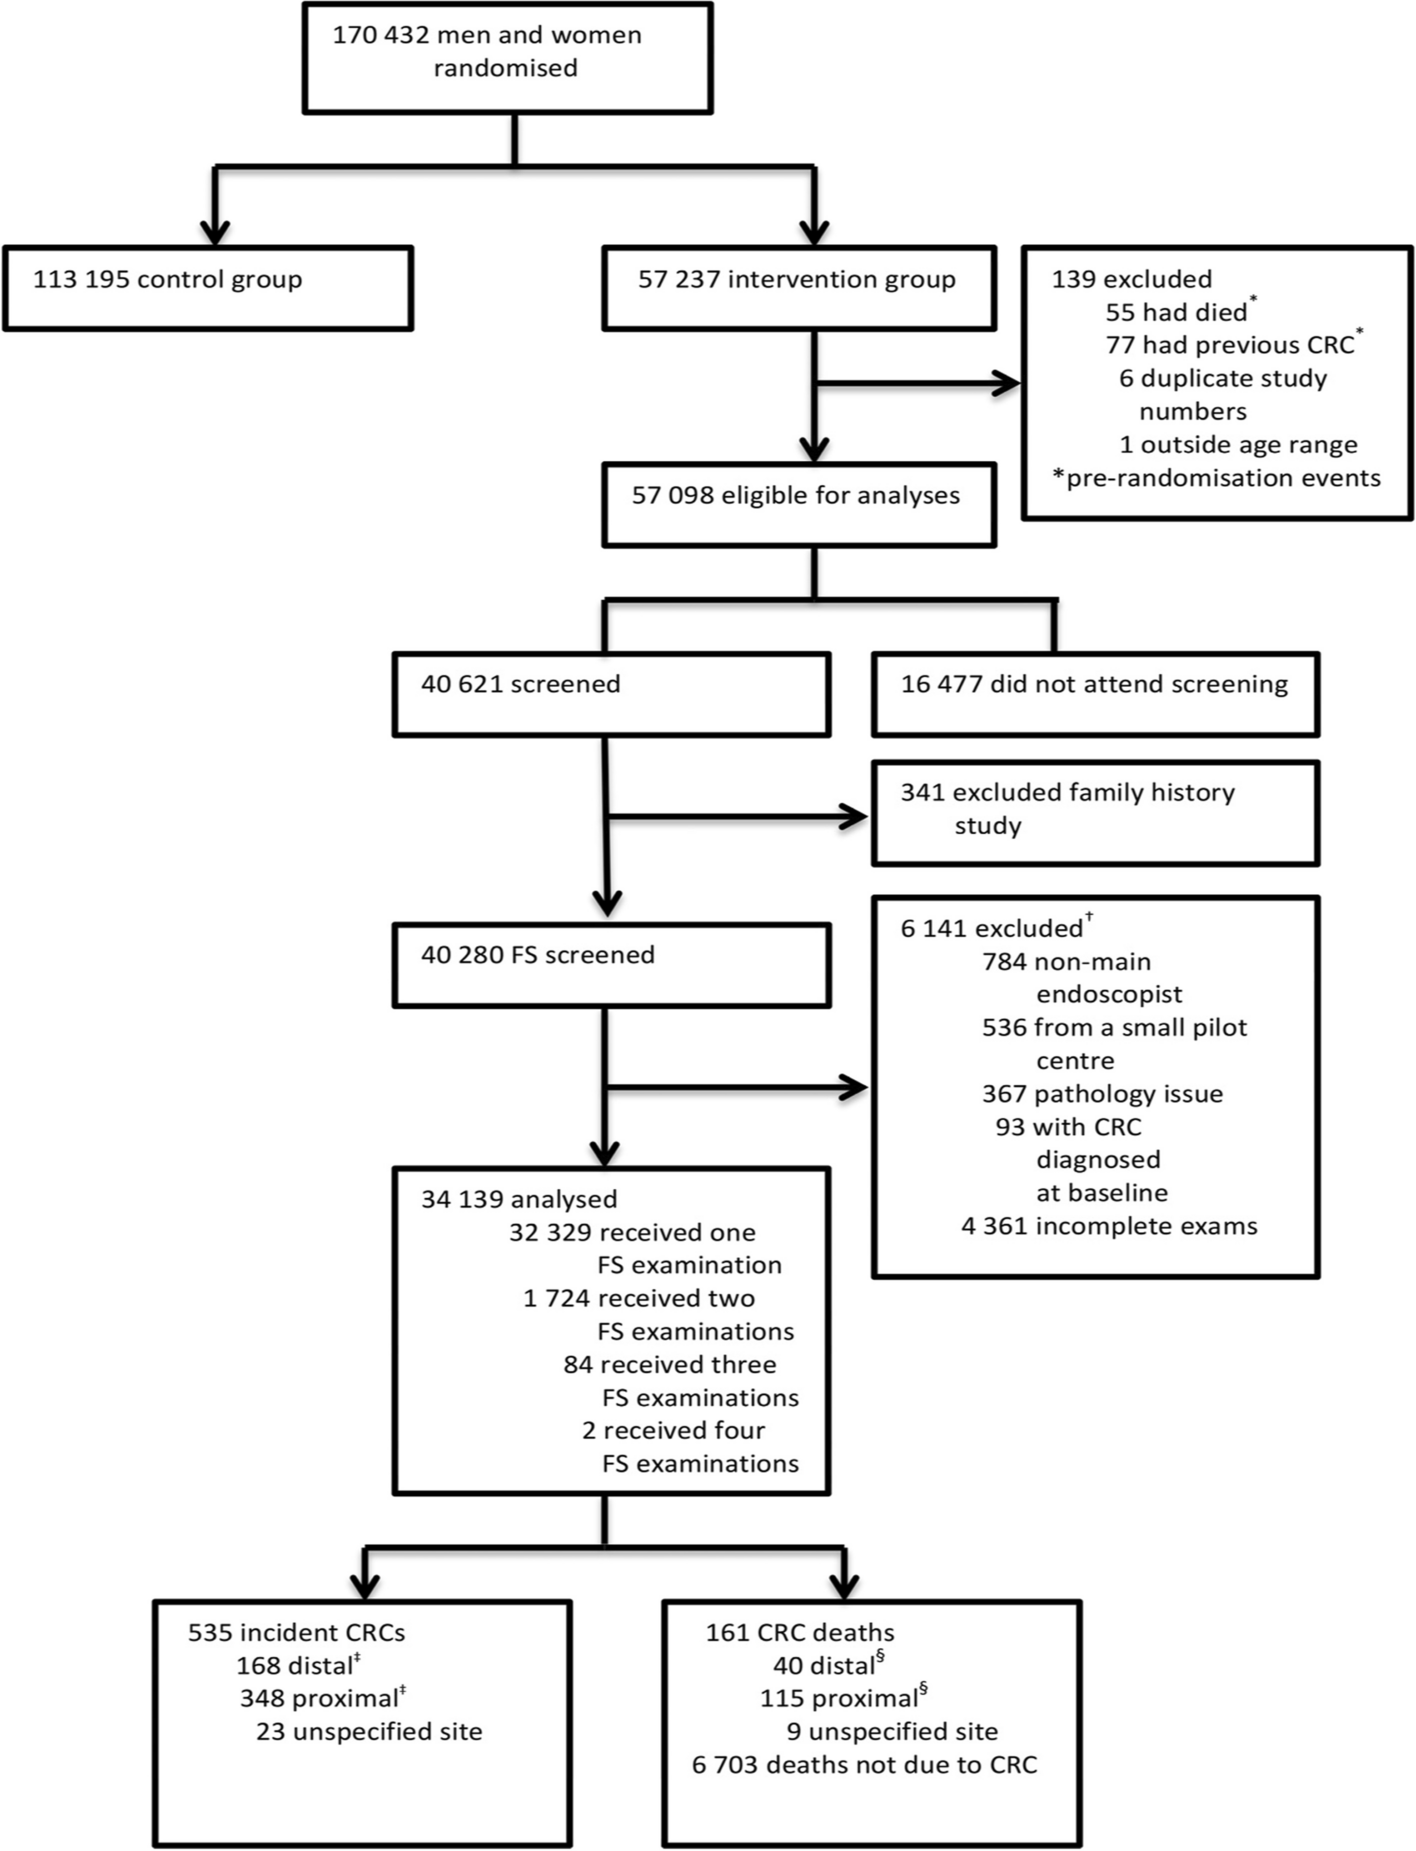
To explore the cellular diversity of overweight/obese CRC, we integrated scRNA-seq data from 14 overweight/obese CRC and 15 non-obese CRC tumor samples, categorizing them into obese and non-obese CRC (Obese and Non-obese) groups (Fig. 1A). We also conducted scRNA-seq analysis on adjacent normal tissue obtained from two overweight/obese CRC samples and three non-obese CRC samples, categorizing them into normal obese (Obese_N) and non-obese CRC (Non-obese_N) groups. The clinical characteristics of these samples are shown in Additional file 1: Table S1. Considering that some clinicopathological features such as age, sex, and tumor stage may be related to the immune microenvironment and metabolism of patients, we collected the clinical characteristics of all overweight/obese CRC and non-obese CRC samples, the results indicated that there were no significant differences in terms of age, sex, and clinical stage between the obese CRC group and the non-obese CRC group, as shown in Additional file 1: Table S1. This is important as it helps ensure that these factors do not confound the comparison between the two groups. Following rigorous quality control steps (Method section), we obtained single-cell transcriptomics data from a total of 192,785 cells across all samples for subsequent analysis. By evaluating marker gene expression patterns, we annotated nine main cell types in the CRC ecosystem, including epithelial cells, T cells, B cells, plasma cells, myeloid cells, mast cells, fibroblasts, endothelial cells, and enteric glial cells. These cell types distributed across both the obese and non-obese samples (Fig. 1B–D). Notably, significant differences in the abundance of cell types were observed between the different groups, indicating distinct microenvironmental components between obese CRC and non-obese CRC samples (Fig. 1C). While all cell types presenting in all samples, the proportion of each cell type varied across the samples (Fig. 1E, Additional file 3: Fig. S1A). The relative abundance of the nine major cell types in all samples and four groups is shown in Fig. 1E, F. Our results revealed that immune cells, including plasma cells, myeloid cells, and T cells, were more abundant in tumor samples, whereas fibroblasts, epithelial cells, and enteric glial cells were enriched in adjacent normal tissues (Additional file 3: Fig. S1B). Importantly, obese tumor samples showed a higher proportion of plasma cells and a lower proportion of B cells compared to non-obese tumor samples (Additional file 3: Fig. S1B). In summary, our results indicate significant differences in the composition of cell types between tumor tissues and adjacent normal tissues in CRC. Moreover, our findings highlight that obese CRC samples have a distinct tumor microenvironment compared to non-obese CRC.
Fig. 1
Single cell transcriptome landscape of CRC patients. A Schematic workflow of experimental design and data analysis in this study. B UMAP plot of the cell types, colored by cell types. C UMAP plot of the groups, colored by different groups. D Log normalized expression of marker genes of each cell type. E Proportions of each cell type in each sample, colored by cell types. F Proportions of each cell type in different groups, colored by cell types
Different functional characteristics of T&NK cell subpopulations between obese CRC and non-obese CRCT&NK lymphocytes were identified as the most abundant TME immune cell populations of CRC (Fig. 1E). To gain insights into the functional subtypes of T cell populations in CRC, we performed unsupervised cluster analysis using extracted T cells from all samples, including six subsets of CD4+T cells, five subsets of CD8+T cells, one NK cell subset, one mucosal associated invariant T cell subset (MAIT) and a proliferative T cell subset (Fig. 2A). Each cluster was defined by the expression of specific marker genes (Additional file 4: Fig. S2A). The CD4+T cells were further categorized into CCR6+T cells, ANXA1+T cells, FOXP3+regulatory T cells (Treg), LEF1+naïve T cells, CCR7+naïve T cells, and CXCL13+T cells (Fig. 2A, Additional file 4: Fig. S2A). Previous studies have shown that enrichment of CXCL13+T cells, which express high levels of PDCD1 and CTLA4, are associated with enhanced sensitivity to immunotherapy targeting PD1 or CTLA4 in CRC patients [26]. CD8+T cells were divided into GZMK+T cells, GZMH+T cells, TIGIT+T cells, IL7R+T cells, and HSPA1A+T cells (Fig. 2A, Additional file 4: Fig. S2A). Notably, HSPA1A+T cells also exhibited high expression of genes related to tissue-resident characteristics, implying their potential as tissue-resident T cells (Fig. 2B). The FCGR3A+NK cells showed high expression of cytotoxic genes such as GNLY, GZMB, and PRF1, as well as the inhibitory-related gene HAVCR2 (Fig. 2B). The high expression of FCGR3A suggests that these cells might be recruited from the peripheral blood. Importantly, we observed that these T cell subtypes were present in both obese and non-obese samples, as well as among different patients. However, there were notable differences in their distribution. Specifically, the majority of CD8+T cell clusters were significantly enriched in adjacent normal tissue samples, whereas CD4+T cell clusters including CXCL13+T cells and Treg cells showed higher enrichment in tumor samples (Fig. 2C). Interestingly, the distribution of CXCL13+T cells was particularly prominent in the obese tumor samples. Additionally, FCGR3A+NK cells were enriched in tumor samples, indicating that tumor-infiltrating NK cells primarily originated from peripheral blood (Fig. 2C). These findings suggest potential differences in T cell functionality between obese CRC and non-obese CRC patients.
Fig. 2
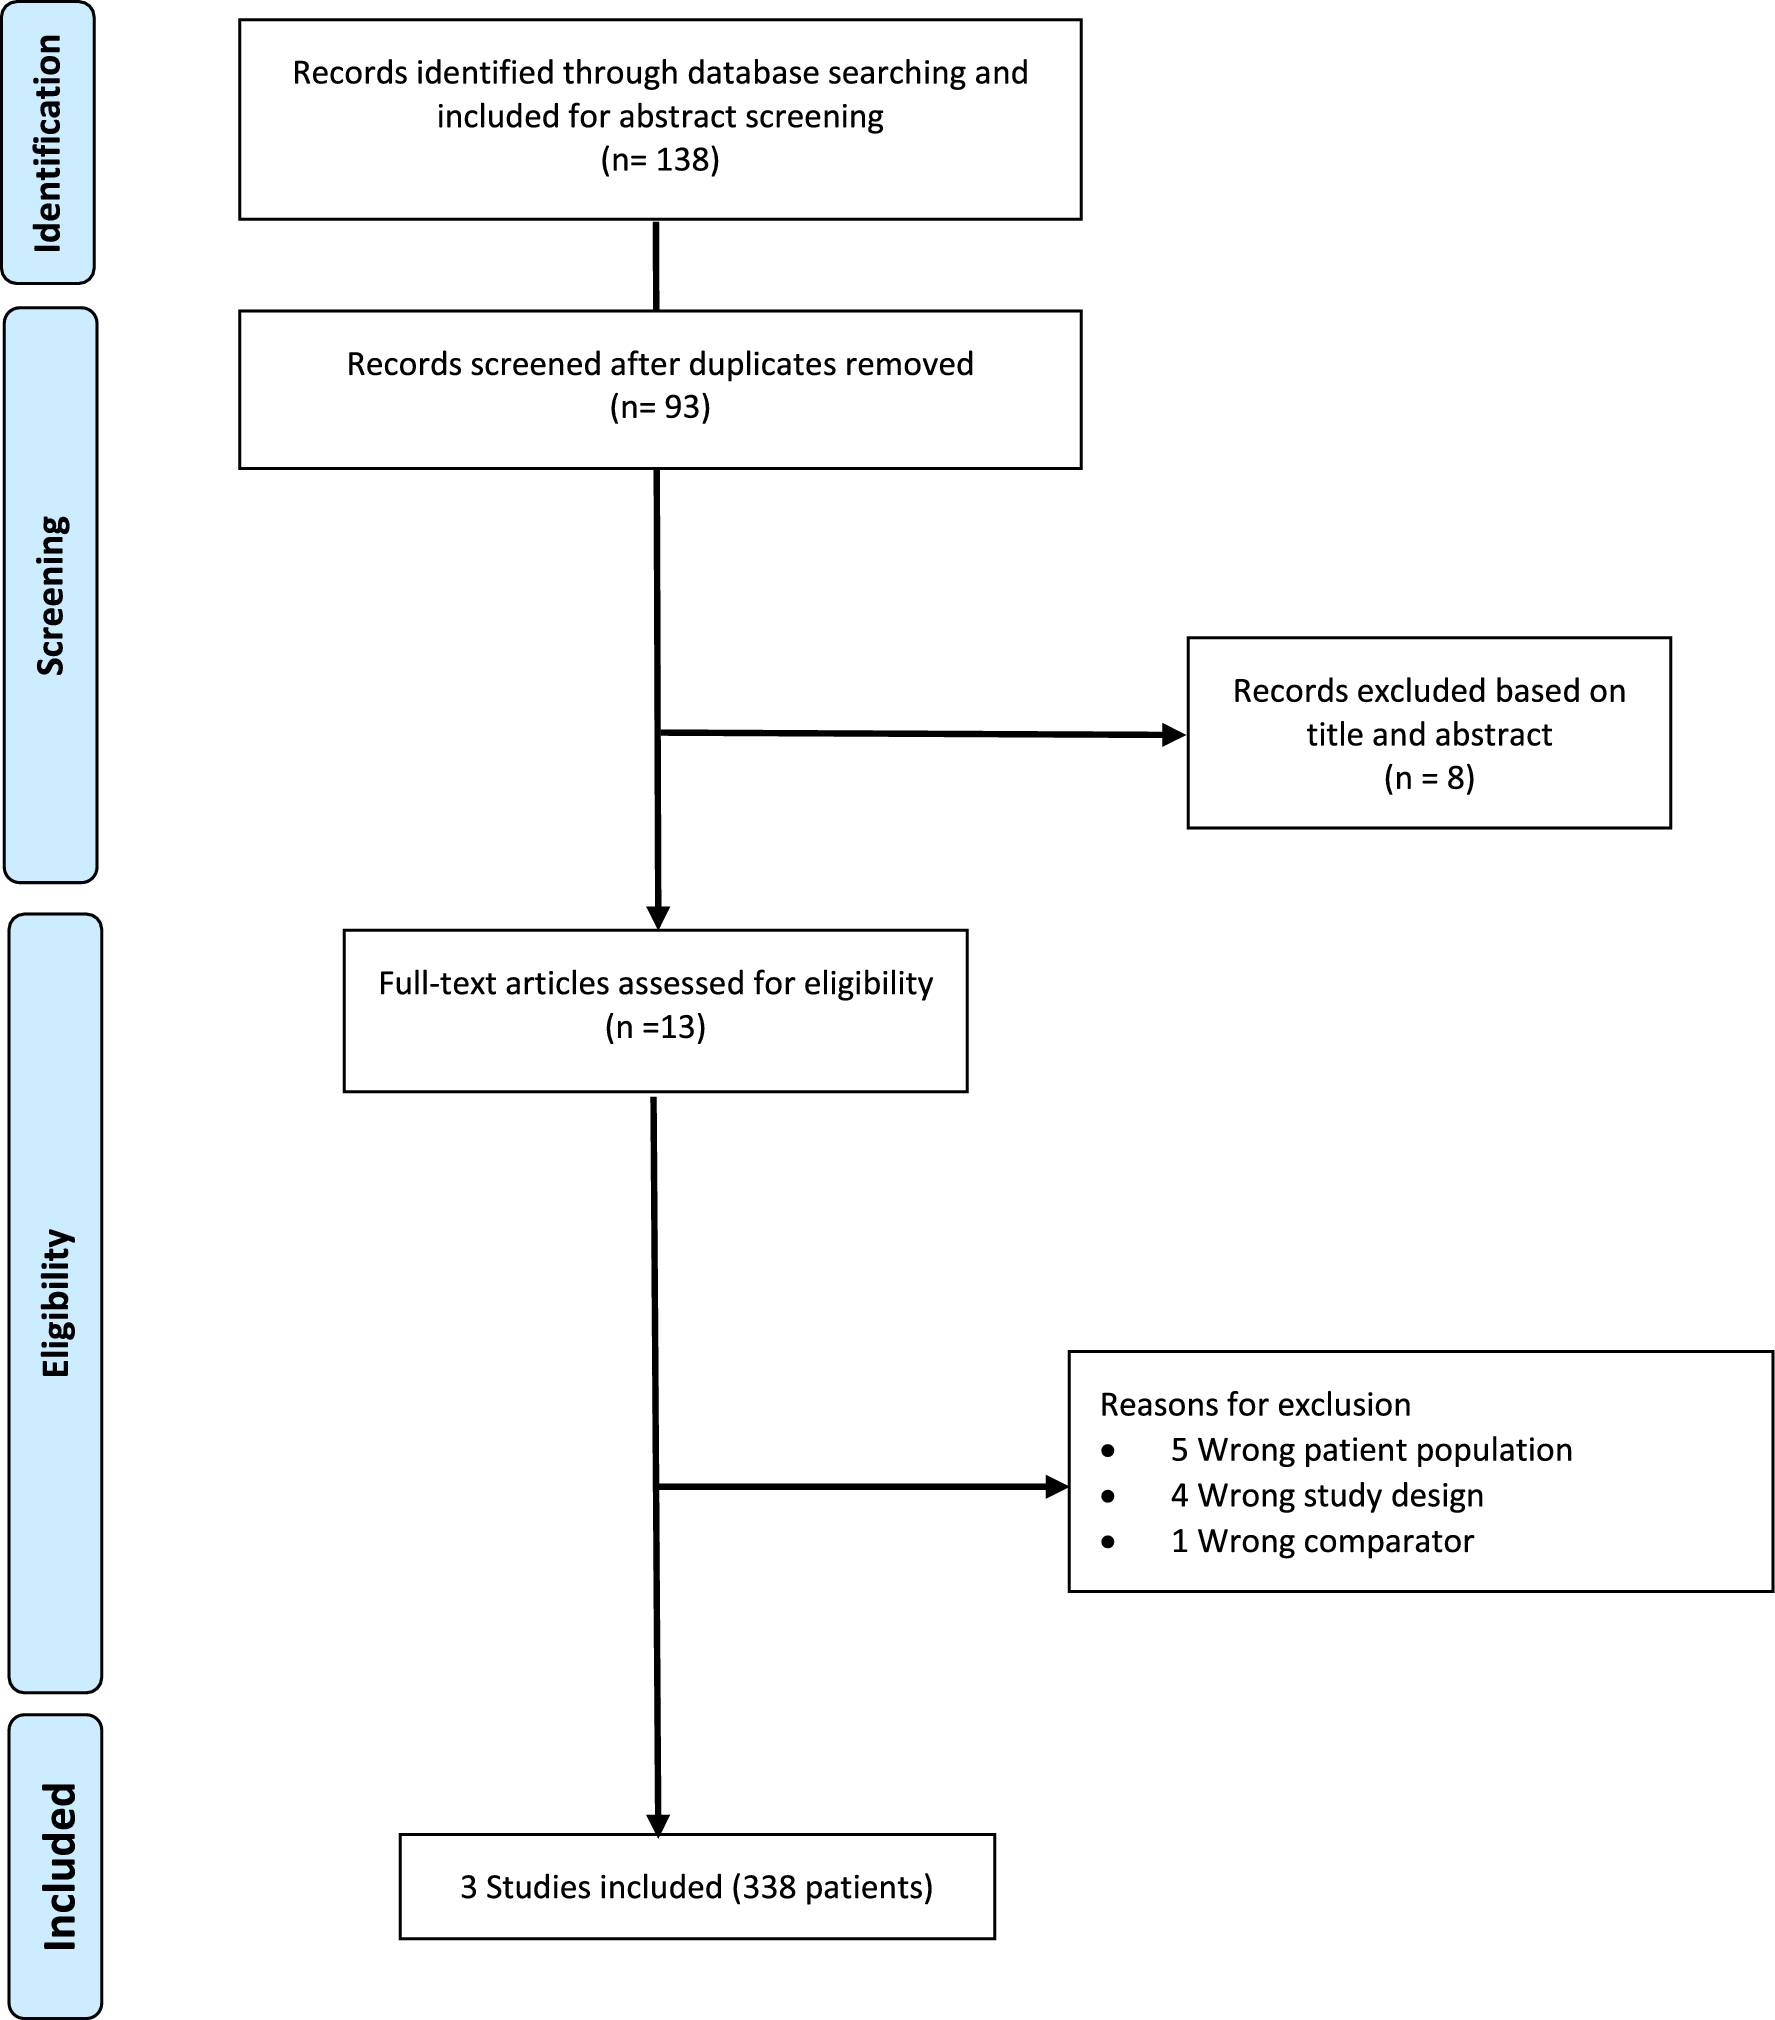
Functional and metabolic dysregulation of T&NK cell subpopulations in obese CRC. A UMAP plots of the T cell subsets, colored by cell subsets. B Heatmap showing the expression of canonical T/NK cell marker genes. C Tissue prevalence of each T cell subset estimated by Ro/e score, in which Ro/e denotes the ratio of observed to expected cell number. D Signature scores for CD8+GZMK+T cells. Comparisons were performed by unpaired two-tailed Student’s t-test. Significance levels are expressed as *P < 0.05, **P < 0.01 and ***P < 0.001. E The Spearman correlation analysis between the scores of cytotoxicity score and glycolysis metabolism score in CRC samples. F Violin plots showing immune checkpoints expression of CD4+T cells from obese CRC and non-obese CRC samples. G Exhaustion signature scores for CD4+FOXP3+T and CD4+CXCL13+T cells. Comparisons were performed by unpaired two-tailed Student’s t-test. Significance levels are expressed as *P < 0.05, **P < 0.01 and ***P < 0.001. H Volcano plot showing the DEGs of NK cells in obese CRC and non-obese CRC. Red and blue represent DEGs that are up—and down-regulated in obese CRC, respectively. I GSEA analysis comparing transcriptomic profiles of NK cells in obese CRC and non-obese CRC, with positive scores indicating enrichment in the obese CRC group, and negative scores indicating enrichment in the non-obese CRC group. NES, normalized enrichment score. J Heatmap showing the expression of NK cells activating and inhibitory receptors
We conducted further analysis to examine the differences in pathways and gene expression among T cell subsets. Specifically, we compared the cytotoxic scores of all CD8+T cells and found that GZMK+T cells exhibited the highest cytotoxic scores, indicating their importance as key effector cells in the immune response against tumors (Additional file 4: Fig. S2B). Interestingly, GZMK+T cells in obese tumor samples showed a lower cytotoxic expression pattern compared to those in non-obese tumor samples (Fig. 2D), which suggests that obesity may impact the cytotoxic function of GZMK+T cells in CRC. Obesity is known to cause chronic metabolic dysfunction, resulting in altered levels of insulin/glucose, leptin/adiponectin, and other hormones and adipokines in the blood [34,35,36]. Previous studies have also shown that obesity and the metabolic dysfunctions associated with it can have a profound effect on the status of the immune system [37]. In addition, immune cells undergo dynamic metabolic changes during development and activation [38, 39]. Therefore, we further investigated the metabolic activity of T cells. Our findings revealed that GZMK+T cells in obese tumor samples have a lower glycolytic metabolic score compared to those in non-obese tumor samples (Fig. 2D). Naïve T cells remain in a quiescent state, reliant on oxidative phosphorylation for their energy needs. However, upon activation, their metabolic profiles shift to support increased glycolysis and meet the energy demands of the activated cell. We investigated the correlation between the cytotoxic scores and glycolysis metabolism scores of GZMK+T cells in obese tumor samples and non-obese tumor samples (Fig. 2E), and the results showed that the cytotoxic scores and glycolysis scores of GZMK+T cells were positively correlated in CRC samples. These results suggest that decreased effector T cells cytotoxic activity in obese CRC samples may be related to impaired glycolysis metabolism. Subsequently, we compared the expression of exhaustion related molecules in CD4+T cells and found that CD4+T cells in obese tumor samples had higher expression of TIGIT and CTLA4 molecules compared with non-obese tumor samples (Fig. 2F). CXCL13+T cells were found to have a higher expression level of PDCD1 in obese CRC (Additional file 4: Fig. S2C), which implied that obese CRC may have a better response to anti-PD-1 treatment. We further compared the exhaustion scores of CD4+T cells and showed that Treg cells and CXCL13+T cells had higher exhaustion scores in obese tumor samples (Fig. 2G). These results may indicate that obese CRC induces a T cell exhaustion phenotype. It is characterized by increased expression of inhibitory receptors.
We analyzed the differential gene expression in NK cells between obese CRC and non-obese tumor samples. The results showed that the cytotoxicity-related markers GNLY and NKG7 were down-regulated in NK cells of obese CRC compared with non-obese CRC (Fig. 2H). This indicate that NK cell killing function is down-regulated in obese CRC. Cellular metabolism also plays a crucial role in NK cell function. We used GSEA to compare the different pathways in NK cells between obese tumor samples and non-obese tumor samples. NK cell mTORC1 pathway and oxidative phosphorylation pathway activity were decreased in obese CRC (Fig. 2I). Previous studies have shown that the mTOR pathway and oxidative phosphorylation activation are critical for the NK cell cytotoxicity process [40, 41]. Therefore, our study may indicate NK cell dysfunction in obese CRC due to decreased metabolism of mTOR and oxidative phosphorylation. NK cells express a variety of receptors that coordinate their effector function. To further investigate the differences expression in functional receptors between non-obese tumor samples and obese tumor samples, we analyzed the expression of these receptors. Our results demonstrated that most of the activating receptors were less expressed in NK cells of obese CRC, while the inhibitory receptor SIGLEC7 showed significantly high expression in obese CRC (Fig. 2J). SIGLEC7, which belongs to the sialic acid-binding immunoglobulin-like lectins (SIGLECS) family predominantly expressed in leukocytes, has been previously identified as a potential immune checkpoint in bladder cancer [42]. It has been shown to dampen the cytotoxic activity of NK cells against bladder cancer cells. Given its significantly high expression in obese CRC, SIGLEC7 may represent a promising novel immune checkpoint for this particular subset of CRC patients.
Collectively, our data suggest that effector T cells and NK cells in the obese CRC TME are dysfunctional and have lower cytotoxicity, which may both be associated with dysregulated metabolic activity. In contrast, CD4+T cells in the TME of obese CRC had a higher exhaustion score and expressed higher exhaustion genes.
Metabolic reprogramming of macrophages and functional suppression of DCs in obese CRCThe proportion of myeloid cells in the tumor tissue was significantly higher than that in the adjacent normal tissue (Additional file 3: Fig. S1B). Subsequently, we investigated the composition and gene expression of myeloid cells in non-obese and obese group. Reclustering of all myeloid cells extracted revealed 10 cell subsets with different frequencies in different tissues (Fig. 3A, B). The monocyte population (cluster 10) was characterized by high expression of FCN1, S100A8, and S100A9 (Fig. 3C). For macrophages we used marker genes based on specific expression to define including MMP19+, SELENOP+, SPP1+, CCL4+macrophage, and a group of proliferative macrophages with high expression of proliferation genes TOP2A and MKI67 (Fig. 3A, C). By calculating M1 and M2 polarization scores using relevant gene sets, we could not clearly distinguish M1 from M2 macrophages (Additional file 5: Fig. S3A), similar to a previous study [43]. Notably, SPP1+macrophages showed higher M2 characteristics and significant angiogenesis characteristics. CCL4+macrophages have higher M1 characteristics but also highly express M2 characteristics (Additional file 5: Fig. S3A). In summary, our findings highlight the limitations of the in vitro polarization model and suggest a more diverse and complex phenotype of macrophages within the TME. Furthermore, we identified four distinct subsets of dendritic cells (DCs), including LAMP3+DCs, which have been previously reported as tumor-specific and were found to be more enriched in tumor samples in our dataset [44]. We also observed a population of CD1C+DCs that exhibited high expression of CD1C and CLEC10A, resembling the previously reported DC2 cells [43]. Additionally, we identified a subset of CLEC9A+DCs expressing the classic DC1 cell marker gene, CLEC9A, predominantly distributed in obese adjacent tissues (Fig. 3B, C). Moreover, our analysis revealed a population of plasmacytoid dendritic cells (pDCs) characterized by high expression of LILRA4 and GZMB (Fig. 3C).
Fig. 3
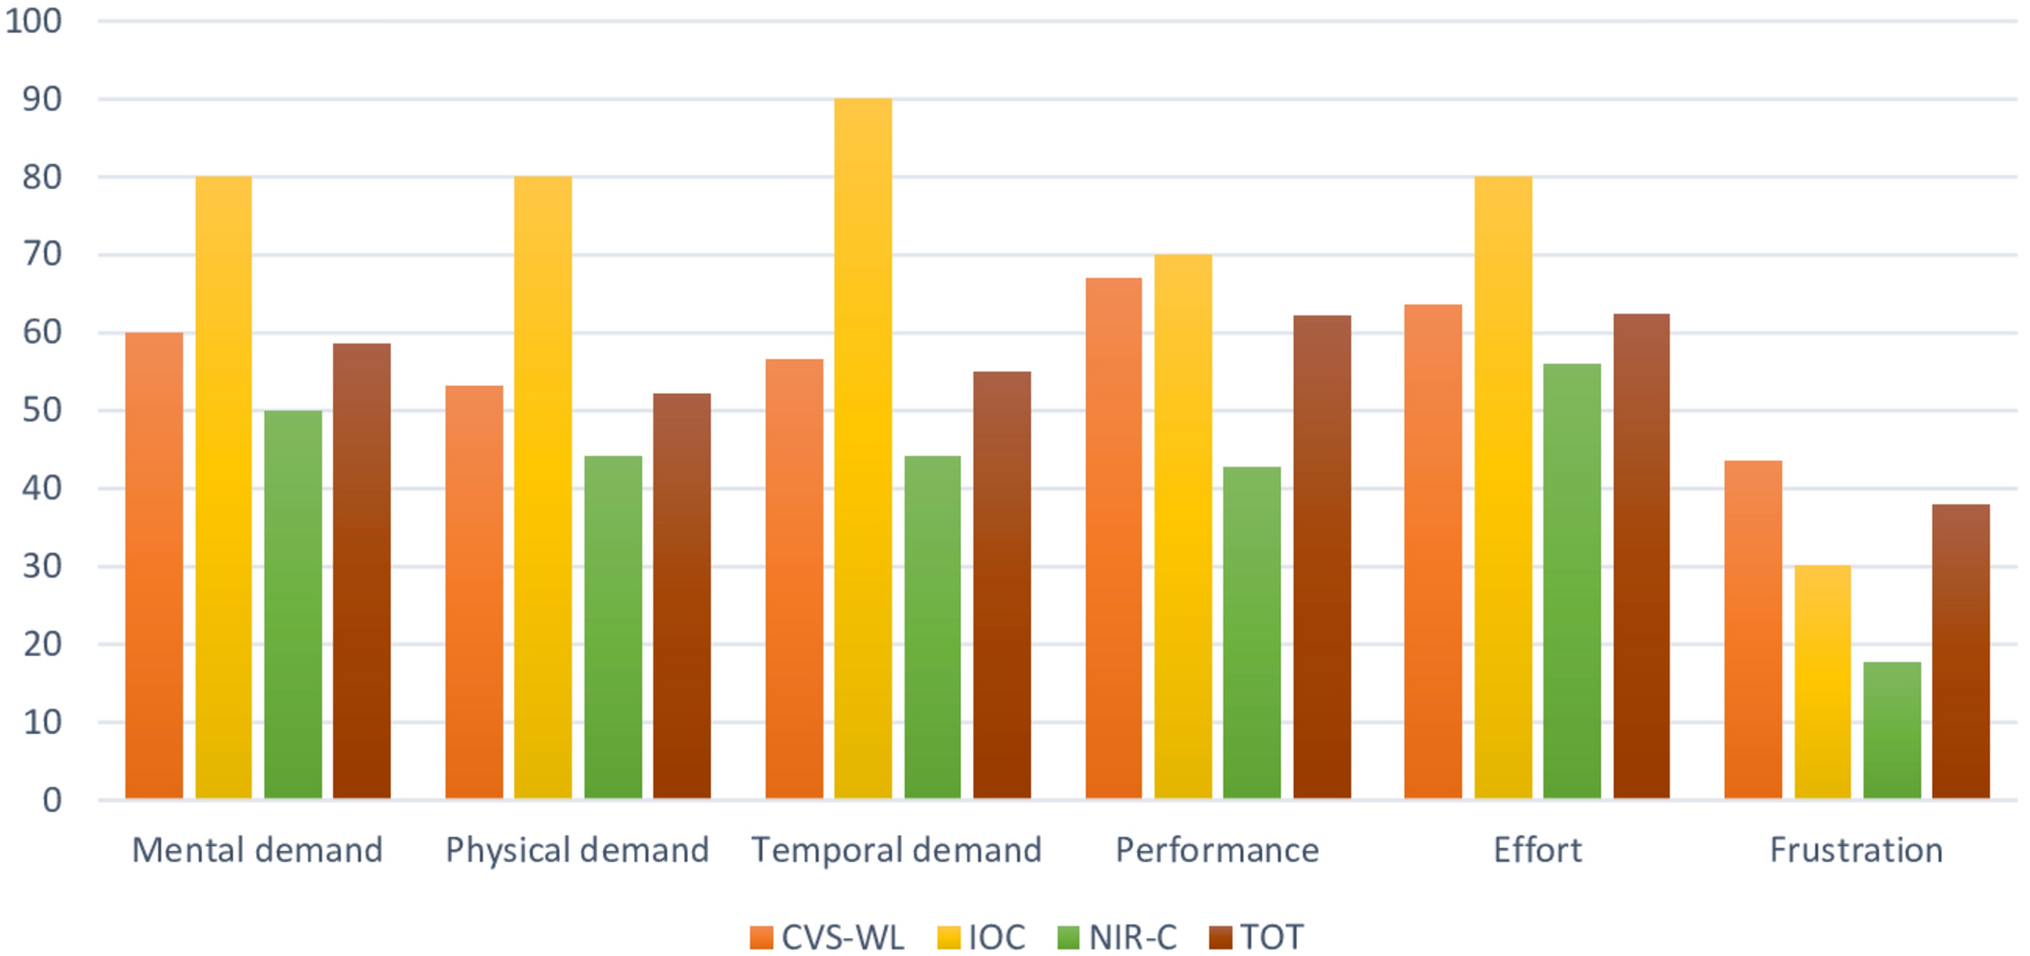
The immunosuppressive phenotype of obese CRC-derived myeloid cells. A UMAP plots of the myeloid cell subsets, colored by cell subsets. B Tissue prevalence of each myeloid cell subset estimated by Ro/e score, in which Ro/e denotes the ratio of observed to expected cell number. C The expression of the marker genes of the myeloid cell subsets. The pct.exp reflects the percentage of cells expressing the gene at non-zero levels. The Average expression reflects the averaged log-normalized expression. D Log-normalized expression of selected marker genes in myeloid cells. E Dot plots showing the metabolic activity analysis of three lipid-associated macrophages (LAMs) subsets by scMetabolism. The circle size and color darkness both represent the scaled metabolic score. F Violin plots showing the metabolic score of metabolic pathways in three LAMs subsets. Comparisons were performed by unpaired two-tailed Student’s t-test. Significance levels are expressed as *P < 0.05, **P < 0.01 and ***P < 0.001. G Violin plots showing MHC class II molecules expression of DC from obese CRC and non-obese CRC samples. H Violin plots showing the antigen presentation score in four DCs subsets. Comparisons were performed by unpaired two-tailed Student’s t-test. Significance levels are expressed as *P < 0.05, **P < 0.01 and ***P < 0.001
Our analysis revealed three distinct lipid-associated macrophages (LAMs) exhibiting high expression of the macrophage marker CD68 and lipid metabolism genes such as APOE and APOC1 (Fig. 3D). Interestingly, one group of LAMs displayed elevated expression of SPP1, which has been reported to be secreted by tumor-associated macrophages (TAMs) to promote cancer progression [45]. On the other hand, the other two groups exhibited high expression of CCL4 and SELENOP, both of which have immunosuppressive and tumor-promoting functions (Fig. 3C) [46, 47]. To gain further insights into the metabolic activity of LAMs in non-obese and obese samples, we used the scMetabolism package to systematically quantify metabolic activity using our scRNA-seq data. We calculated metabolic pathway activity scores for all KEGG metabolic pathways annotated in scMetabolism. Intriguingly, we discovered significantly higher metabolic scores in LAMs from obese tumor tissues compared to non-obese tumor and adjacent normal tissues (Fig. 3E, F), indicating that they are extremely active and vibrant in obese CRC. Notably, numerous lipid metabolism-related pathways, including fatty acid elongation and fatty acid degradation, were highly enriched in LAM cells infiltrating obese CRC (Fig. 3E).
DCs exhibit high expression of MHC class II molecules, such as HLA-DRA which are critical for activating T cells and promoting antitumor immunity. In our comparison of differentially expressed genes in DCs between non-obese tumor samples and obese tumor samples, we observed significantly lower expression of certain MHC class II molecules, such as HLA-DQA2 and HLA-DRB5, in obese CRC compared to non-obese CRC (Fig. 3G). Furthermore, we examined the antigen presentation function of all DC subsets and found that, except for LILRA4+pDCs the antigen presentation function of DCs was significantly downregulated in obese CRC (Fig. 3H). DCs excel at antigen presentation and play a crucial role in initiating T cell-mediated antitumor immune responses. Therefore, we evaluated the correlation between the cytotoxic scores of GZMK+T cells and the antigen presentation scores of DCs in tumor samples, and the results showed a significant positive correlation (Additional file 5: Fig. S3B). This may imply that the ability of DCs to activate T cells is limited in obese CRC.
Taken together, these findings suggest that both macrophages and DCs play important roles in the establishment of an immunosuppressive TME in obese CRC.
Functional characteristics of stromal cells in obese CRCAmong the various types of stromal cells present in the TME, fibroblasts are the predominant component, and cancer-associated fibroblasts (CAFs) play significant and diverse roles in supporting tumor growth. We identified 10 distinct fibroblast subsets based on their specific expression markers (Fig. 4A). By analyzing the distribution of cell proportions (Additional file 6: Fig. S4A), we found that cells expressing ADAMDEC1+, DPT+, MYH11+, and POSTN+ markers were mainly derived from adjacent normal tissues, referred to as normal fibroblasts (NFs). Six tumor-rich clusters were considered CAF because they were primarily derived from tumor tissue (Fig. 4A, Additional file 6: Fig. S4A). There are several groups of CAFs that highly express inflammation genes and complement factors, consisting of four distinct subsets namely, F3+, FAP+, CCL11+, and MMP3+fibroblasts. Furthermore, there exists another subset characterized by RGS5+fibroblasts, which demonstrate elevated expression of classical myofibroblast marker, ACTA2, thus categorizing them as myofibroblasts (mCAFs) (Fig. 4B, Additional file 6: Fig. S4B). There was also a group of TOP2A+ fibroblasts with high expression of proliferation-related gene TOP2A (Fig. 4B). We analyzed major fibroblast subsets to explore potential activation processes specific to CAFs. Evolutionary trajectory analysis revealed two distinct activation pathways leading from NFs to CAFs. NFs derived from adjacent normal tissues were positioned at the initial stages of the trajectory. For CAF activation, there was an upregulation of expression in certain metal matrix proteases like MMP3, MMP10, and MMP1, while mCAF expressed high levels of genes involved in pathways crucial for cancer initiation and progression, including extracellular matrix remodeling genes (COL1A1, COL4A2) and genes involved in hypoxia regulation (HIF1A, LDHB) (Fig. 4C, D). Both hypoxia pathway scores and TGFB signaling pathway scores gradually increased along the CAF activation trajectory, reaching their peaks in the mCAF state (Additional file 6: Fig. S4C), indicating the important roles of hypoxia and TGFB pathway in CAF differentiation. The accumulation of RGS5+fibroblasts was significantly higher in tumor tissues compared to adjacent normal tissues (Additional file 6: Fig. S4A), highlighting the potential biological significance of RGS5+fibroblasts in the TME. Furthermore, we compared the pathway differences of RGS5+fibroblasts among different groups, and the results revealed the enrichment of pathways related to epithelial-mesenchymal transition and extracellular matrix receptor responses in obese CRC samples (Fig. 4E). These pathways have been implicated in tumor development and metastasis [48, 49].
Fig. 4
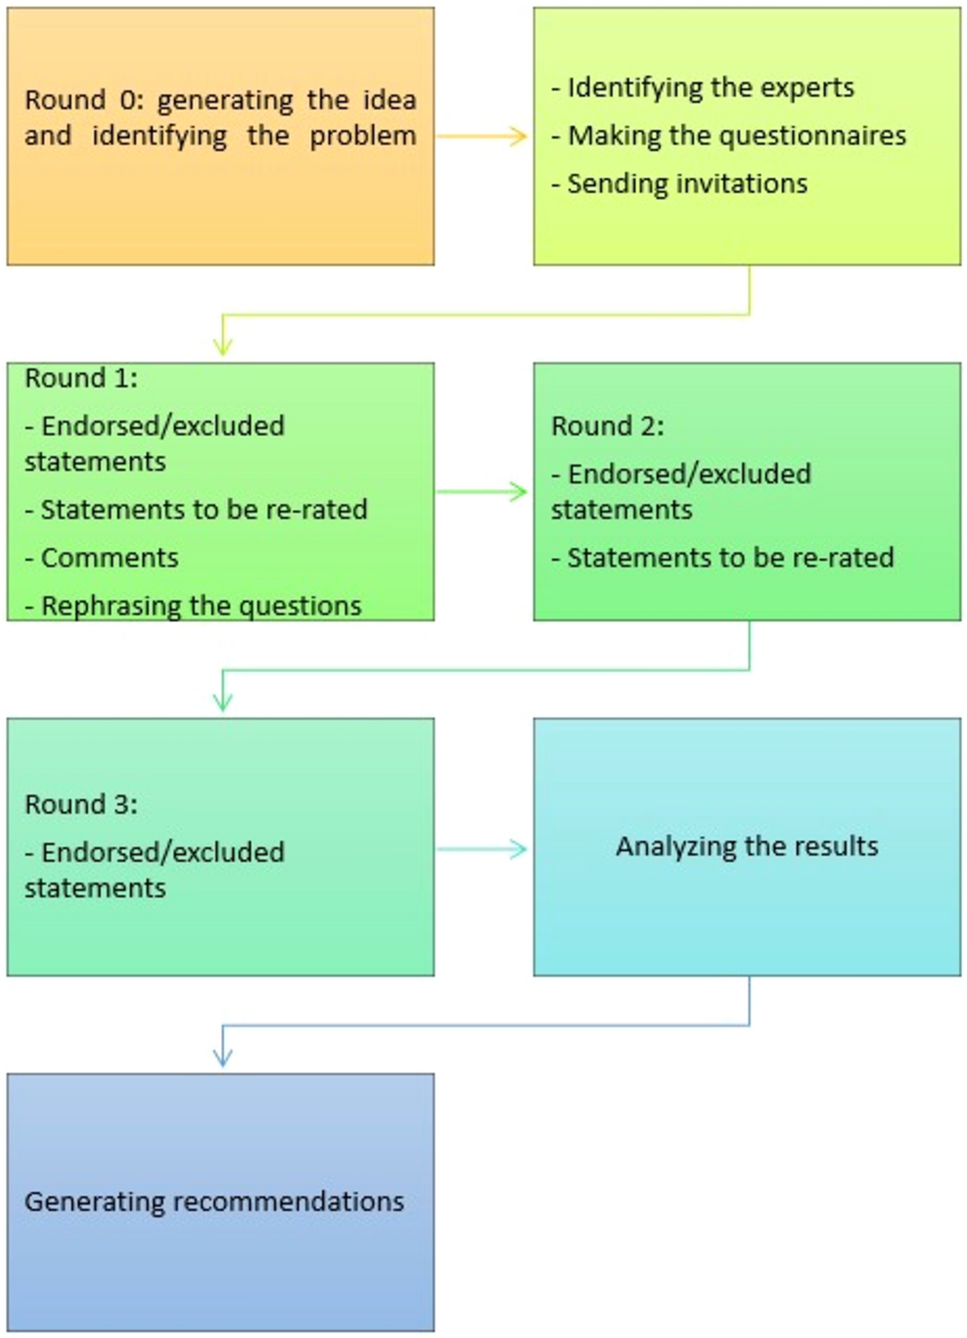
Dysregulation of stromal cells in obese CRC. A UMAP plots of the fibroblast subsets, colored by cell subsets. B Violin plots showing the expression of markers in various subsets of fibroblasts. C Heatmap showing the dynamic changes in gene expression along the pseudotime (lower panel). The distribution of fibroblasts subsets during the transition, along with the pseudo-time. Subsets are labeled by colors (upper panel). D Pseudotime-ordered analysis of fibroblasts. colored by pseudotime, cell subsets, and groups, respectively. E GSEA analysis comparing transcriptomic profiles of RGS5+fibroblasts in obese CRC and non-obese CRC, with positive scores indicating enrichment in the obese CRC group, and negative scores indicating enrichment in the non-obese CRC group. NES, normalized enrichment score. F UMAP plots of the endothelial cell subsets, colored by cell subsets. G Tissue prevalence of each endothelial cell subset estimated by the Ro/e score, in which Ro/e denotes the ratio of observed to expected cell number. H Kaplan–Meier survival analysis of TCGA CRC patients stratified by ESM1+EC. I Bar plots showing typically significantly enriched GO terms in ESM1+EC
Endothelial cells (ECs) play a crucial role in tumor angiogenesis, facilitating cancer growth and metastasis. Through unsupervised dimensionality reduction and clustering analysis, we identified six distinct subclusters of ECs with specific marker gene expression patterns: ESM1+EC, GJA5+EC, ACTA2+EC, ACKR1+EC, TOP2A+EC, and LYVE1+EC (Fig. 4F). Analyzing the relative proportions of each subcluster across the different patient groups revealed that ESM1+EC were enriched in the tumor samples, specifically in obese tumor samples (Fig. 4G). We then evaluated whether the abundance of the ESM1+EC subcluster had any association with patient survival using bulk RNA-seq data from TCGA. This showed that the frequency of ESM1+EC was negatively correlated with survival (Fig. 4H). The obese CRC samples demonstrates a increased enrichment of ESM1+EC cells, potentially indicating a correlation with a worse prognosis. To investigate the possible reasons why this subcluster exhibits poor prognosis in CRC, we performed the functional enrichment analysis. GO analysis revealed the enrichment of pathways related to the extracellular matrix (ECM) and the regulation of epithelial cell migration and adhesion in ESM1+EC (Fig. 4I), which are associated with tumor development and metastasis.
Enrichment of IgG+plasma cells and dysregulation of B cell antitumor function in obese CRCTo further reveal the diversity of B cells and their immunological characteristics, we conducted detailed clustering analysis of B cells and identified three subsets of MS4A1+B cells along with three subsets of plasma cells (Fig. 5A). The plasma cells were further categorized into IgG+plasma cells, IgA+plasma cells, and proliferating plasma cells based on the expression of specific marker genes. Naïve B cells expressed IGHD, memory B cells expressed TNFRSF13B and GPR183, and germinal center B cells exhibited high expression levels of BCL6 and MKI67 (Additional file 7: Fig. S5A). In assessing the distribution of B cell plasma cell subsets across different tissues, we observed a higher enrichment of IgA+plasma cells in none-obese adjacent normal tissues (Fig. 5B). IgA antibodies are primarily found in mucosal areas such as the gastrointestinal tract, respiratory tract, and urogenital tract, where they play a critical role in preventing pathogen colonization. Conversely, IgG+plasma cells displayed a preferential enrichment in obese tumor samples (Fig. 5B). Previous studies have highlighted a correlation between the abundance of CXCR4+IgG+plasma cells and the severity of intestinal inflammatory diseases [50].
Fig. 5
Enrichment of IgG plasma cells and immunosuppression of B cells in obese CRC. A UMAP plots of the B/plasma subsets, colored by cell subsets. B Tissue prevalence of each B/plasma cell subset estimated by the Ro/e score, in which Ro/e denotes the ratio of observed to expected cell number. C Dot plots showing the expression of the chemokine receptors in IgG+plasma cells. The pct.exp reflects the percentage of cells expressing the gene at non-zero levels. The Average expression reflects the averaged log-normalized expression. D Dot plots showing the expression of the chemokine in all cell types. The pct.exp reflects the percentage of cells expressing the gene at non-zero levels. The Average expression reflects the averaged log-normalized expression. E Dot plots showing the comparison of communication probabilities from four endothelial cell subsets to three plasma cell subsets among different groups. F Violin plots showing the expression of CXCL12 in endothelial cell subsets, colored by groups. G Dot plots showing typically significantly enriched GO terms in memory B cells. H Violin plots showing the antigen presentation score in memory B cells. Comparisons were performed by unpaired two-tailed Student’s t-test. Significance levels are expressed as *P < 0.05, **P < 0.01 and ***P < 0.001
Then we first asked how IgG+ plasma cells were recruited into the obese CRC microenvironment. We examined chemokine receptor expression of IgG+plasma cells in obese tumor samples and non-obese tumor samples, including CXCR3, CXCR4 and CXCR5, and found that IgG+plasma cells in obese CRC highly expressed CXCR4 (Fig. 5C). Next, we compared the expression levels of chemokines across all cell types and made an intriguing discovery: CXCL12, which is the ligand for CXCR4, was found to be most highly expressed in ECs (Fig. 5D). Based on this finding, we hypothesized that ECs might be involved in the recruitment of IgG+plasma cells. To investigate this further, we examined the cell–cell interactions between plasma cells and ECs using CellChat. The results revealed that the interaction via the CXCL12-CXCR4 pathway was particularly strong in obese CRC samples (Fig. 5E). We also compared the expression of CXCL12 in endothelial cells and found that endothelial cells in obese tumor samples exhibited the highest level of CXCL12 expression (Fig. 5F), pointing towards the possibility that CXCL12 secreted by endothelial cells in obese CRC could attract IgG+plasma cells expressing CXCR4.
GO enrichment analysis demonstrated that memory B cells shared similar functions with naïve B cells and were enriched in pathways related to antigen presentation and T cell activation (Fig. 5G). This suggests that memory B cells primarily contribute to anti-tumor immunity by facilitating antigen presentation to T cells and subsequently activating them to target tumor cells. We compared the antigen presentation function of memory B cells in non-obese tumor samples and obese tumor samples. Surprisingly, our findings indicated that the antigen presentation capacity of memory B cells was lower in obese CRC compared to non-obese CRC (Fig. 5H). In summary, our findings highlight the significant involvement of endothelial cells in the recruitment of IgG+plasma cells in obese CRC. Concurrently, we observed a diminished antigen presentation capacity of memory B cells in obese CRC, thereby exacerbating the development of an immunosuppressive microenvironment.
Characteristics of cancer cells in obese CRCWe distinguished malignant from nonmalignant epithelial cells based on the chromosomal profiles inferred from the scRNA-seq data (Fig. 6A, Additional file 8: Fig. S6A). Differentially expressed genes between obese CRC and non-obese CRC malignant epithelial cells have been identified (Fig. 6B, Additional file 8: Fig. S6B). The expression of genes involved in glycolysis metabolism, such as HMGB2 and LDHB, was higher in obese CRC than in non-obese CRC samples (Fig. 6B). In addition, some genes associated with poor prognosis of CRC, such as CEACAM6 and TGFBI, were also highly expressed in obese CRC samples (Fig. 6B). Previous studies have reported that overexpression of CEACAM6 in a variety of malignant tumors can promote cell invasion and metastasis [51], and TGFBI promotes tumorigenesis and development by increasing cancer cell chemotaxis and cell migration potential of a variety of cancer cell types in vitro and in vivo [52]. Therefore, we further explored the feature scores associated with metastasis in obese CRC and non-obese CRC malignant epithelial cells. The results showed that malignant epithelial cells in obese CRC had higher scores of cell migration and proliferation characteristics than those in non-obese CRC (Fig. 6C). These results indicate that obese CRC has a higher invasive potential, which is consistent with clinical observations.
Fig. 6
Characteristics of cancer cells in obese CRC. A UMAP plots of the epithelial cell, colored according to inferCNV inferred results. B Violin plots showing the expression of DEGs in malignant epithelial cells, colored by groups. C Violin plots showing the invasive characteristics score in malignant epithelial cells. Comparisons were performed by unpaired two-tailed Student’s t-test. Significance levels are expressed as *P < 0.05, **P < 0.01 and ***P < 0.001. D Heatmap showing the metabolic activity score of malignant epithelial cells by GSVA. The color darkness represents the scaled metabolic score. E Violin plots showing the expression of metabolism related DEGs in malignant epithelial cells, colored by groups. F Representative images of IHC staining detecting LDHA and SCD expression in obese CRC and non-obese samples. Scale bar, 20 μm. G The number of intercellular communications among different cell types in obese CRC and non-obese CRC samples. The line color represents cell types, and the line thickness represents interaction numbers. H Heatmap showing the overall CCL signaling by aggregating outgoing and incoming signaling together in the obese CRC and Non-obese CRC groups. I Dot plots showing the comparison of communication probabilities from malignant epithelial cells to six endothelial cell subsets among different groups
In order to investigate potential differences in malignant epithelial cells metabolism between obese CRC and non-obese CRC samples, we conducted an analysis of metabolic pathway activity in each malignant epithelial cell and identified pathways that were specifically activated in obese CRC (Fig. 6D). The results revealed that pathways related to glycolysis and fatty acid metabolism, including fatty acid biosynthesis and fatty acid elongation, exhibited significantly higher activity in obese CRC malignant epithelial cells (Fig. 6D). Notably, LDHA, a key gene involved in glycolysis, was found to be significantly up-regulated in obese CRC. Furthermore, SCD, an enzyme that controls synthesis of unsaturated fatty acids, as essential in breast and prostate cancer cells [53], was also observed to be elevated in obese CRC (Fig. 6E). More importantly, IHC staining further verified at the clinical CRC sample scale that the density of LDHA and SCD was increased in tumor regions of obese CRC samples compared to the non-obese CRC samples (Fig. 6F, Additional file 8: Fig. S6C). Recent research has reported increased uptake of fatty acids by tumor cells, while tumor-infiltrating CD8+T cells remain unaffected in high-fat diet (HFD)-induced obese mice. These different adaptations result in altered fatty acid distribution within HFD tumors, leading to impaired infiltration and function of CD8+T cells [
留言 (0)