
記住我
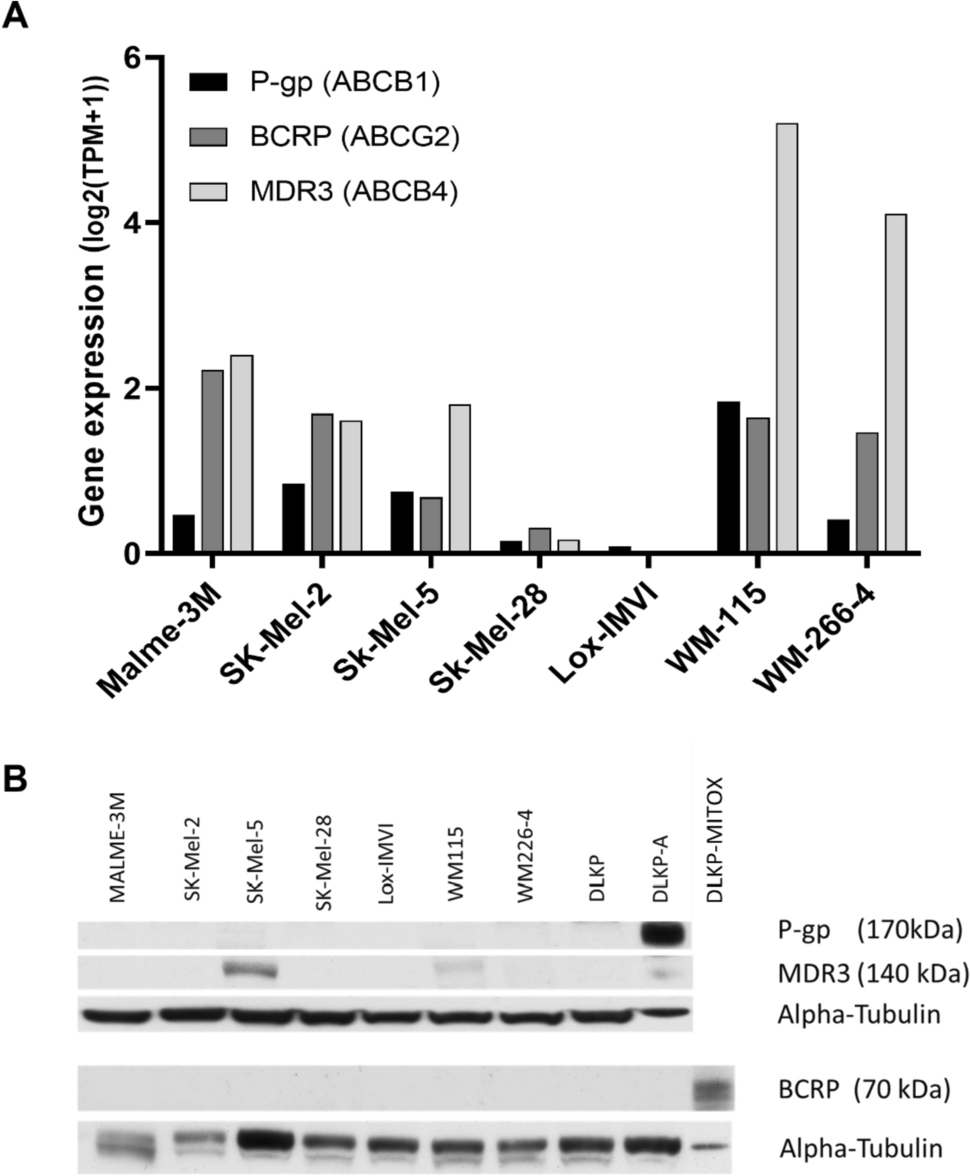
Expression of P-gp, MDR3, and BCRP was first queried using gene expression data from the Cancer Cell Encyclopedia Depmap Portal [30]. This analysis (Fig. 1A) showed variable RNA expression of the three efflux transporter genes ABCB1 (P-gp), ABCB4 (MDR3) and ABCG2 (BCRP) across the melanoma cell line panel. ABCB4 (MDR3) had the highest expression across the panel, particularly in the WM-115 and WM-244-4 cell lines. WM-115 was also found have the highest expression of ABCB1 (P-gp), while the LOX cell line had extremely low levels of gene transcript for all three transporters.
Fig. 1
Protein and RNA expression of drug efflux transporters varies across melanoma cell lines in this study. A RNA expression of P-gp (ABCB1), BCRP (ABCG2), and MDR3 (ABCB4) for the melanoma cell lines, exported from CCLE Depmap portal. B P-gp, MDR3, and BCRP protein expression in the melanoma cell line panel and the control DLKP/DLKP-A/ DLKP-MITOX cell lines. DLKP-A was used as a positive control for P-gp expression. DLKP-MITOX was used as positive control for BCRP detection. Western blot results are representative of three replicates
Follow-up western blot analyses (Fig. 1B), showed the melanoma cell line panel did not express detectable levels of P-gp or BCRP protein suggesting a level of post-transcriptional control for the drug transporter proteins of interest. However, two cell lines, SK-MEL-5 and WM-115 displayed MDR3 protein expression. In contrast, our previous study conducted on melanoma patient tissue samples showed over 80% of samples to express P-gp and/or MRP-1 [13]. This discrepancy suggests a disparity in drug efflux transporter expression in vivo and in vitro. As none of the melanoma cell lines expressed a detectable level of P-gp protein in vitro, DLKP-A (P-gp over-expressing lung cancer cell line) were used as a model of P-gp over-expression [28] and DLKP-MITOX cells were used as a positive control for BCRP protein expression [29].
ABT-751 is effective at clinically relevant concentrations in melanoma cell lines and is not impacted by drug transporter expressionAll melanoma cell lines displayed greater sensitivity to taxanes than ABT-751. Low IC50 ranges from 0.07–2.5 nM for docetaxel and 0.32–6.1 nM for paclitaxel were observed, whereas ABT-751 displayed an IC50 concentration range of 208.2–1007.2 nM within the melanoma cell line panel (Table 1). WM-115 and WM-266-4 are derived from the primary site and a metastatic site from the same patient [31]. Interestingly, the WM-226-4 cells were significantly more sensitive to docetaxel and paclitaxel compared to WM-115 (p < 0.05, Students t test) but there was no difference in sensitivity to ABT-751 between the two cell lines (Table 1). There are differences in MDR3 protein expression and P-gp RNA expression levels between these two cell lines, however it is not possible to attribute the variation in drug sensitivity to these factors within this study (Fig. 1B).
Table 1 IC50 values ± standard deviations for taxanes and ABT-751 in seven melanoma cell linesAnalysis of RNA expression data from all 78 melanoma cell lines available on the DepMap portal revealed a wide range of gene expression of the three efflux transporters of interest with MDR3 (ABCB4) most highly expressed (Fig. 2A). Comparing this gene expression data to drug sensitivity data from the PRISM Repurposing dataset version 19Q4 available from Depmap portal [30], allowed further examination of efflux transporter gene expression and taxane resistance in a larger sample set. As illustrated in Fig. 2B, moderate (Spearman’s rank correlation coefficient, r = 0.4542) and weak (r = 0.3510) positive correlations were found between docetaxel toxicity area under the curve (AUC) and P-gp and MDR3 expression, respectively, in melanoma cell lines. This suggests P-gp has influence on taxane efficacy in cell line models, in agreement with a similar screen conducted on 60 cancer cell lines [32]. Some positive correlation was also seen for the sensitivity to paclitaxel and expression of P-gp and MDR3 (r = 0.2671 and r = 0.4104). No correlation was seen between P-gp expression and response to ABT-751. Overall, BCRP expression had no correlation with sensitivity to the three compounds assessed.
Fig. 2
Correlation analysis of drug transporter genes versus drug sensitivity in melanoma cell lines, derived from DepMap Portal CCLE expression and drug sensitivity datasets. A Overall gene expression profile of P-gp (ABCB1), BCRP (ABCG2) and MDR3 (ABCB4) in all melanoma cell lines available on CCLE (n = 78). B Correlation analysis using Spearman’s rank correlation coefficient of MDR drug transporter gene expression versus docetaxel, paclitaxel and ABT-751 drug sensitivity (AUC)
The anti-proliferative effect of ABT-751 is not impacted by P-gp over-expressionFollowing the suggestion that ABT-751 efficacy is not influenced by drug transporter expression (Fig. 2B), we next tested the correlation experimentally, using a previously characterized cell line model of P-gp-mediated MDR. The P-gp over-expressing DLKP-A cell line displayed 139-fold resistance (p < 0.0001) to paclitaxel and 358-fold resistance to docetaxel (p < 0.001) compared to the P-gp-null parent cell line DLKP (Fig. 3). In contrast, there was no significant difference in ABT-751 IC50 between DLKP and DLKP-A (p = 0.4007), supporting the data in Fig. 2B.
Fig. 3
The IC50 of docetaxel, paclitaxel and ABT-751 in parental DLKP cells versus P-gp-expressing, MDR DLKP-A. Difference between cell lines was assessed using unpaired t test, ****p < 0.0001, ***p < 0.001
Elacridar impacts ABT-751 response in MDR3-expressing SK-MEL-5 cell lineTo confirm the observed resistance of the DLKP-A cell line to taxanes is driven by P-gp drug transporter activity, co-treatments with the P-gp/BCRP inhibitor elacridar were carried out in the parental DLKP and resistant DLKP-A cell lines. Low concentrations of docetaxel were used to treat the DLKP (0.2 nM) and DLKP-A (10 nM) cell lines to produce < 10% cytotoxicity and provide a window to observe increased cytotoxicity due to efflux pump inhibition. Elacridar significantly enhances docetaxel cytotoxicity in DLKP-A, and reverses the acquired resistance phenotype (Table 2).
Table 2 The effect on relative cell proliferation following addition of 500 nM elacridar to docetaxel treatment in parental DLKP and resistant DLKP-A cell linesFollowing the impact of elacridar on docetaxel toxicity in DLKP-A, ABT-751 and P-gp substrate paclitaxel [33] were combined in DLKP-A, resulting in a significant increase in toxicity (Table 3). While additive mechanistic effects of paclitaxel and ABT-571 cannot be discounted, this suggests that P-gp-mediated paclitaxel transport may be impeded by ABT-751. ABT-751/elacridar combination assays were also carried out in two melanoma cell lines, LOX-IMVI (P-gp/BCRP/MDR3-null by RNA and protein expression), and SKMEL-5, which displayed the highest MDR3 protein expression of the cell lines investigated (Fig. 1). As with the docetaxel combinations in Table 2, a low concentration of ABT-751 (150–250 nM) was used that resulted in 5–10% cytotoxicity, leaving a window to observe additional toxicity associated with potential efflux pump inhibition. Elacridar has been reported to inhibit MDR3 [34]. As detailed in Table 3, no effect was seen upon addition of elacridar to ABT-751 in LOX-IMVI but in the SKMEL-5 cell line, the addition of elacridar caused a small but significant (p = 0.020, Student’s t test) decrease in cell proliferation compared to ABT-751 alone.
Table 3 Combination proliferation assays combining ABT-751 with elacridar (500 nM) or paclitaxel (250 nM) in the drug-resistant P-gp + /MDR3 + DLKP-A, the P-gp − /MDR3 − LOX-IMVI cell line, and the P-gp − /MDR3 + SK-MEL-5 cell lineTwo further melanoma cell lines were treated with ABT-751 in the presence and absence of elacridar. Elacridar had no significant effect when combined with ABT-751 in the P-gp-negative (−), MDR3 − WM-266-4 cell lines, as expected, or in the P-gp −, MDR3-positive (+) WM-115 cell line (Fig. 4). The WM-115 cell line expresses lower levels of MDR3 than SK-MEL-5 (Fig. 1).
Fig. 4
IC50 ABT-751 proliferation assays carried out in the presence or absence of 0.25 μM elacridar in A the P-gp −/MDR3 + WM-115 and B P-gp −/MDR3− WM-266–4. Error bars represent the standard deviation of triplicate experiments, *significant, p < 0.05
ABT-751 is a potential BCRP substrate and P-gp inhibitorFollowing the proliferation assays in Fig. 4 and Table 3, we next conducted ATPase assays to directly gauge the activation or inhibition of P-gp and BCRP ATPase activity by ABT-751. No MDR3 ATPase assays were available. Cell-free membrane preparations of P-gp and BCRP were exposed to varying concentrations of docetaxel (a known P-gp substrate) and ABT-751 with the measured changes in liberated inorganic phosphate (Pi) as the transporters consume ATP conferring a read-out of transporter activity. P-gp substrate docetaxel increased the activity of P-gp ATPase above baseline for 6/7 concentrations tested but in contrast, ABT-751 decreased P-gp ATPase activity below baseline for all concentrations, similar to known P-gp inhibitor Cyclosporin A (Fig. 5A(i)). The ability of docetaxel and ABT-751 to inhibit substrate-activated P-gp ATPase activity was also investigated (Fig. 5A(ii)). As a P-gp substrate, docetaxel further increased P-gp ATPase activity in the presence of verapamil at lower concentrations, decreasing P-gp ATPase activity above 1.6 µM in a concentration dependent manner. However, ABT-751 consistently inhibited verapamil-activated P-gp ATPase activity at all concentrations but did not return P-gp ATPase activity to baseline, or match the ability of cyclosporin A to inhibit verapamil-activated P-gp ATPase activity (Fig. 5A(ii)). This suggests that some active P-gp-mediated substrate transport may remain ongoing in the presence of ABT-751. ABT-751 does interact with P-gp, but acts in an inhibitory fashion, decreasing the rate of ATP consumption by the active transporter, both from baseline and for pre-activated P-gp.
Fig. 5
P-gp A and BCRP B ATPase activity assays in the presence of docetaxel and ABT-571. The baseline activity represents the ATPase activity measured in the absence of added test compounds. For activation studies, A (i) and B (i), control inhibited transporter activity was induced by cyclosporine A (P-gp) or Ko143 (BCRP). For inhibition studies, A (ii) and B (ii), maximal ATPase activity was induced by verapamil (P-gp) or sulfasalazine (BCRP). Data are mean + / − SD for each concentration determined in duplicate
The ATPase profile for ABT-751 is considerably different in the BCRP ATPase assays. Docetaxel is not a BCRP substrate and it had little effect on BCRP ATPase from baseline (Fig. 5B (i)). ABT-751 does appear to interact with BCRP, increasing BCRP ATPase activity above baseline at all concentrations examined (Fig. 5B(i)). For BCRP pre-activated with sulfasalazine, docetaxel had little to no effect on rates of liberated Pi while ABT-751 further enhanced BCRP ATPase activation (Fig. 5B(ii)). Both BCRP ATPase studies suggest ABT-751 can activate BCRP ATPase and is therefore a potential BCRP substrate.
留言 (0)