Study design
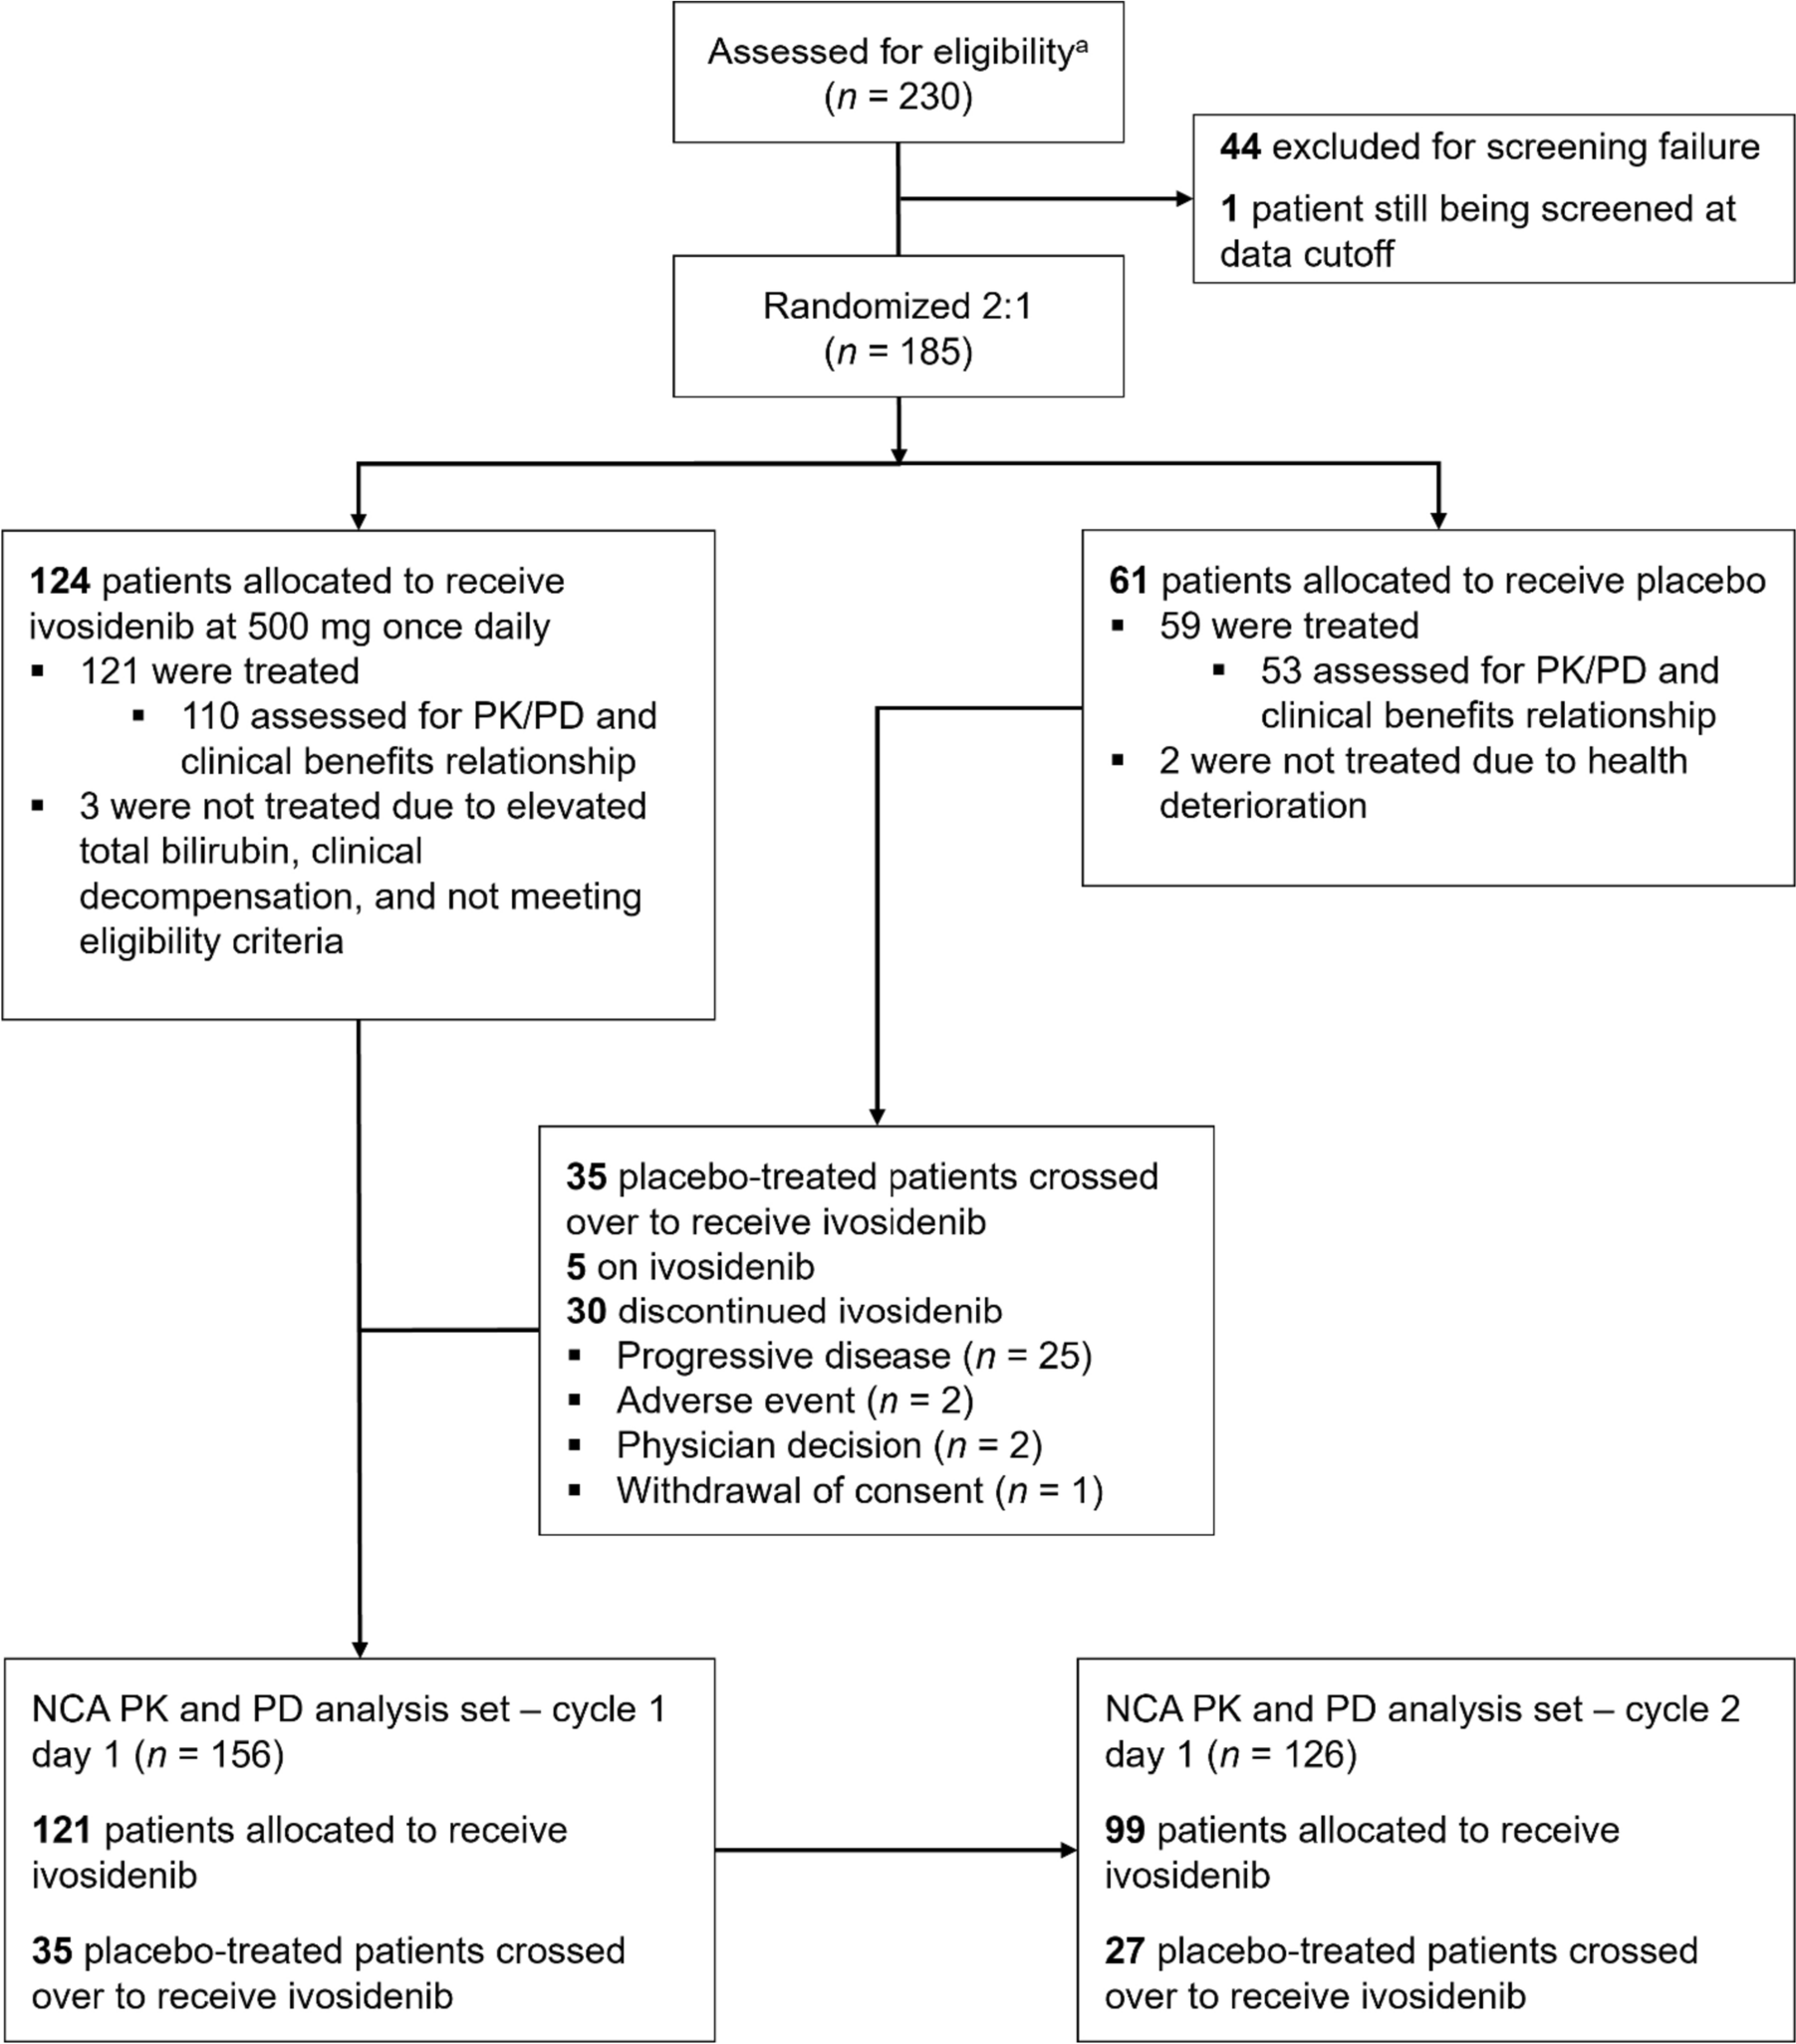
The study design for ClarIDHy has been described in detail elsewhere [15]. Eligible patients of 18 years of age or older with a histologically confirmed diagnosis of mIDH1 cholangiocarcinoma were randomized 2:1 to oral ivosidenib 500 mg qd or matched placebo, and stratified by number of prior systemic treatments for advanced disease (one or two). Treatment cycles were 28 (± 2) days long and daily study treatment began on cycle (C) 1 day (D) 1 (C1D1), with continuous dosing. Upon disease progression per investigator assessment, and if the patient continued to meet eligibility criteria, crossover into the ivosidenib treatment arm from placebo was permitted. Patients who crossed over started again with study procedures as at C1D1.
This study was conducted according to the International Council for Harmonisation of Good Clinical Practice guidelines and the principles of the Declaration of Helsinki. Approval from the institutional review board and independent ethics committee was obtained by all study investigators. Informed consent was obtained from all patients included in the study.
Study assessments and analysis
For radiographic assessments of disease response at baseline and throughout the study period, computed tomography or magnetic resonance imaging were conducted from C1D1 onwards every 6 weeks (± 5 days) through week 48 and every 8 weeks (± 5 days) thereafter, independent of dose delays or interruptions. Objective tumor response was assessed per Response Evaluation Criteria in Solid Tumours version 1.1 (RECIST v1.1) [17] and performed by institutional radiologists. All responses were centrally reviewed by an independent radiology center per RECIST v1.1. Progression-free survival was defined as the time from the date of randomization to the date of first documentation of disease progression or death owing to any cause, whichever occurred first.
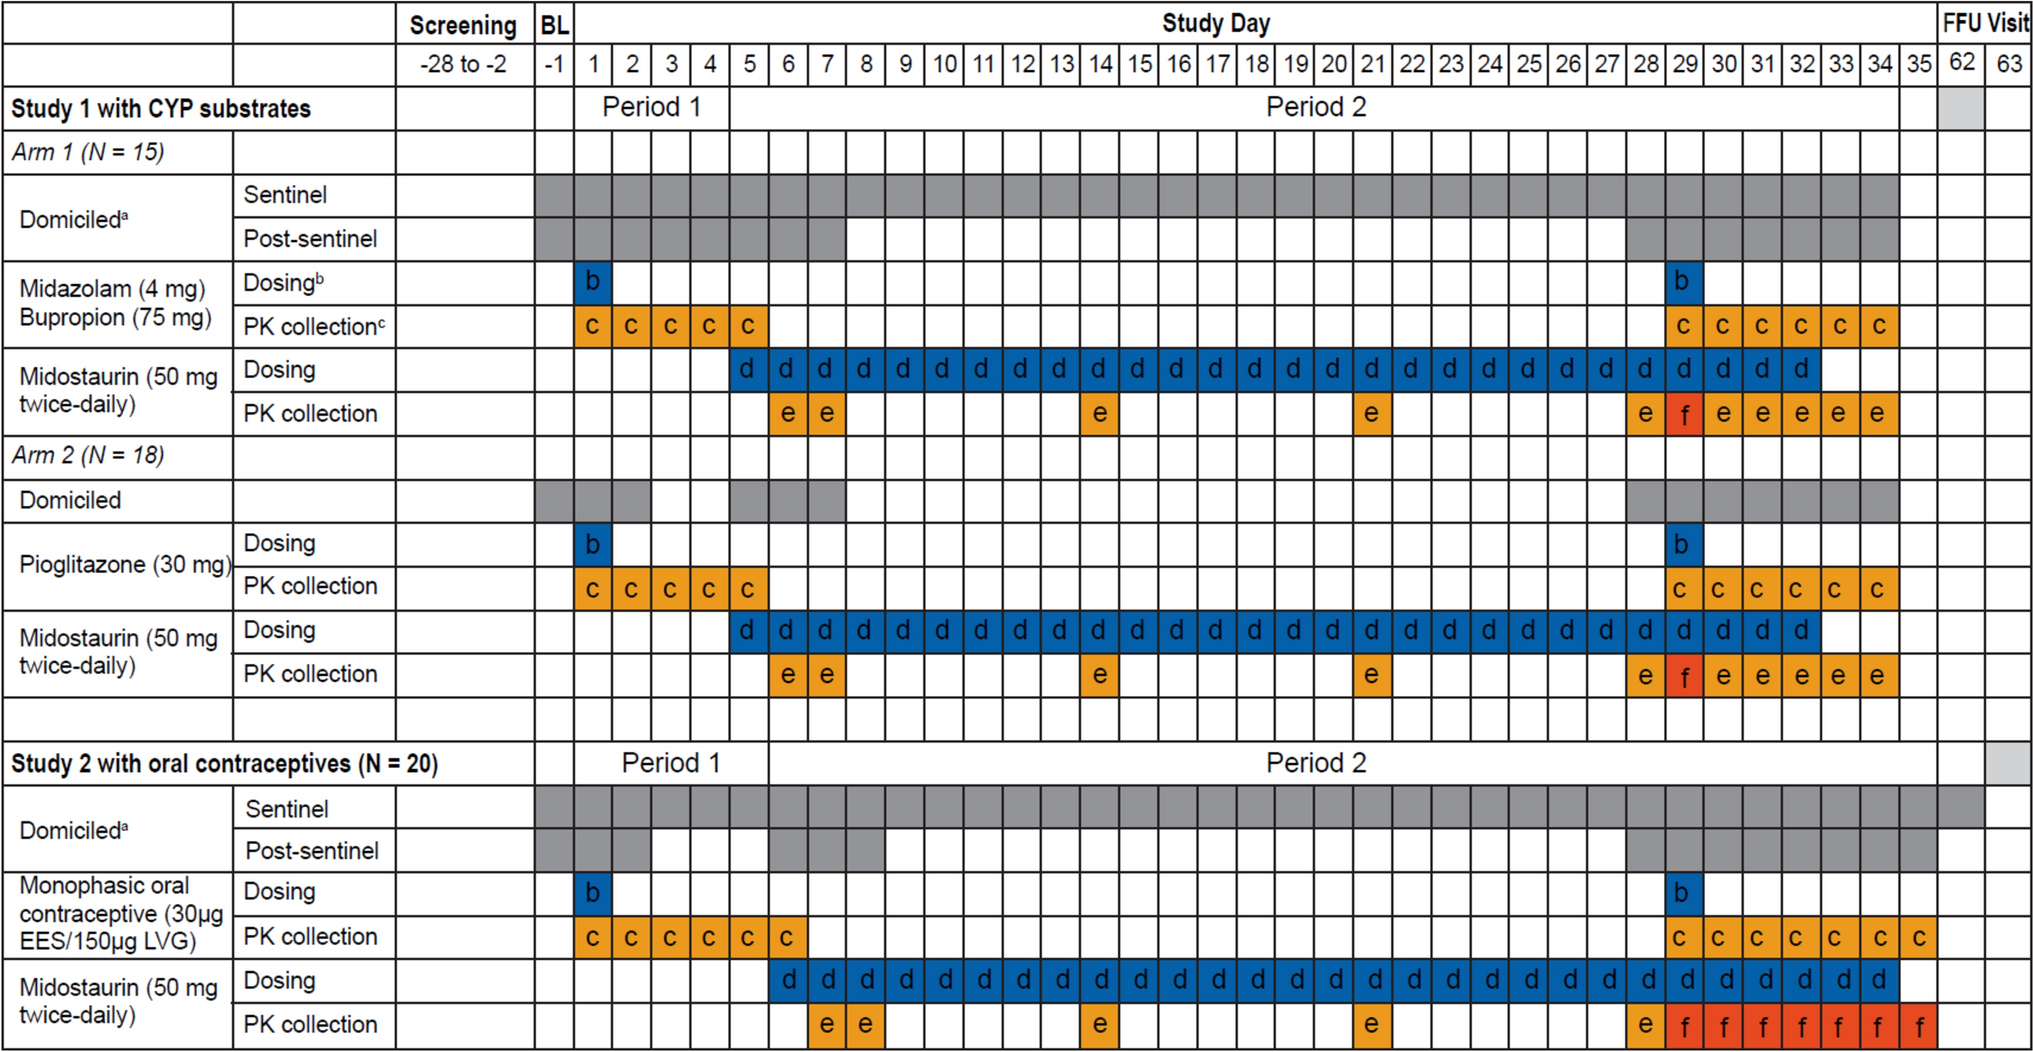
On C1D1 (including both C1D1 and crossover C1D1) and C2D1 (including both C2D1 and crossover C2D1), blood samples for PK/PD assessments were drawn pre-dose and at 0.5, 2, and 4 h post-dose. As this a phase III study in patients with a relatively large sample size (N = 185), sparse PK sampling over 4-h post-dose was used to capture the maximum concentration (Cmax) for concentration-QTc analysis and to perform population PK. On C1D15 and crossover C1D15, blood samples were drawn pre-dose and at 2 h (± 10 min) post-dose. On C3D1 and crossover C3D1 and D1 of each treatment cycle thereafter (including crossover), and at any time during the end-of-treatment visit, blood samples were drawn pre-dose (within 30 min).
Plasma ivosidenib was measured using a validated liquid chromatography-tandem mass spectrometry (LC–MS/MS) method, with a lower limit of quantitation (LLOQ) of 50.0 ng/mL. Plasma 2-HG concentrations were measured using a qualified LC–MS/MS method, with a LLOQ of 29.6 ng/mL.
Data analysis and processing were completed using a validated version of Phoenix® WinNonlin® 7.0 (Certara, Princeton, NJ) or R v3.3.1 (R Core Team, Vienna, Austria). Additional graphing was performed with Prism 9.4.1 (GraphPad Software, Boston, MA). Enrolled patients who received at least one dose of ivosidenib and who had sufficient plasma sample data to assess PK or PD parameters comprised the PK or PD analysis populations. The PK/PD analysis population included all patients in the PK analysis population who had at least one PD concentration data point time-matched to the PK concentration.
PK/PD methods
Concentration values of plasma ivosidenib reported as below the limit of quantitation (BLQ) were set to 0 for the PK and statistical analyses. Plasma 2-HG levels reported as BLQ were set to the value of the LLOQ for the PD and statistical analyses. All plasma PK parameter calculations were performed using actual times calculated relative to the most recent time of study drug administration. PK parameters were determined using non-compartmental analysis (NCA) methods based on individual plasma concentration–time data for ivosidenib and included:
Time of the last quantifiable concentration (Tlast)
Area under the plasma concentration–time curve from time 0 to 4 h (AUC0–4)
Area under the plasma concentration–time curve from time 0 to Tlast (AUC0–t)
Maximum observed plasma concentration (Cmax)
Time of maximum plasma concentration (Tmax)
Observed concentration at the end of a dosing interval, right before the next dose (Ctrough)
Accumulation ratio based on Cmax (Racc (Cmax)), calculated as:
$$_}} (_}})=\frac_},\,\mathrm-\mathrm}}_},\,\mathrm}}$$
Accumulation ratio based on AUC0–4 (Racc (AUC0–4)), calculated as:
$$_}} (}}_)=\frac}}_-\mathrm}}}}_}}$$
Actual doses of ivosidenib were used to calculate PK parameters, and concentration–time profiles were excluded from the analyses for all missed doses or dose adjustments. Data interpolation was applied for any missing plasma concentration at the end time of the pre-defined AUC time curve. If the pre-defined end time fell within the range of the available data but did not coincide with an observed data point, then the plasma concentration corresponding to the missing time point was estimated (imputed) by performing a linear interpolation, as applicable. If the pre-defined end time fell outside the range of the available data (i.e., if the last available data for calculation of AUC0–4 was 3.98 h), one of the following two methods was used: (1) if the 4-h sample was collected within 48 min prior to 4 h post-dose (i.e., 20% deviation from the scheduled 4 h allowed) AUC0–t was used to estimate AUC0–4; (2) if the 4-h sample was collected more than 48 min prior to 4 h, AUC0–4 was not reported. Observed individual plasma concentrations and percent inhibition of 2-HG were analyzed using actual times (nominal times were used when actual times were not available) and calculated relative to the most recent time of study drug administration.
Patient-specific plasma 2-HG values at baseline were used for baseline adjustment. PD parameters were determined using NCA methods, based on individual observed plasma concentration–time data for 2-HG, and included:
The last non-missing observation collected from each patient before the first ivosidenib dose (baseline effect value, B)
Area of the response curve from time point 0 (pre-dose) up to 4 h post-dose (AUEC0–4)
Percent inhibition for AUEC0–4 (%BAUEC0–4), calculated as:
$$ }_ \left( }}} } \right] - }_ }}}}} } \right]}}} \right) \times 100 $$
Observed response value at the end of a dosing interval immediately before the next dose (Rtrough)
Percent inhibition for Rtrough (%BRtrough), calculated as:
$$}_}}=\left(\frac_}}}\right)\times 100$$
PK/PD correlation analysis
Correlations between selected plasma ivosidenib PK parameters and selected plasma 2-HG PD parameters at C2D1 were explored using graphical display of data. The strength of the PK/PD relationships was assessed using locally weighted scatterplot smoothing. Longitudinal PK/PD profiles of pre-dose plasma ivosidenib and plasma 2-HG were also derived.
Associations between steady-state plasma 2-HG and clinical response were also assessed.
Statistical analysis
Individual plasma PK and PD parameters were listed and summarized in accordance with grouping factors (i.e., cycle and day). For all summary statistics, crossover C1D1 and crossover C2D1 visits were combined with C1D1 and C2D1 visits, respectively. Descriptive statistics were used to summarize concentration data at each nominal time point.

留言 (0)