
記住我
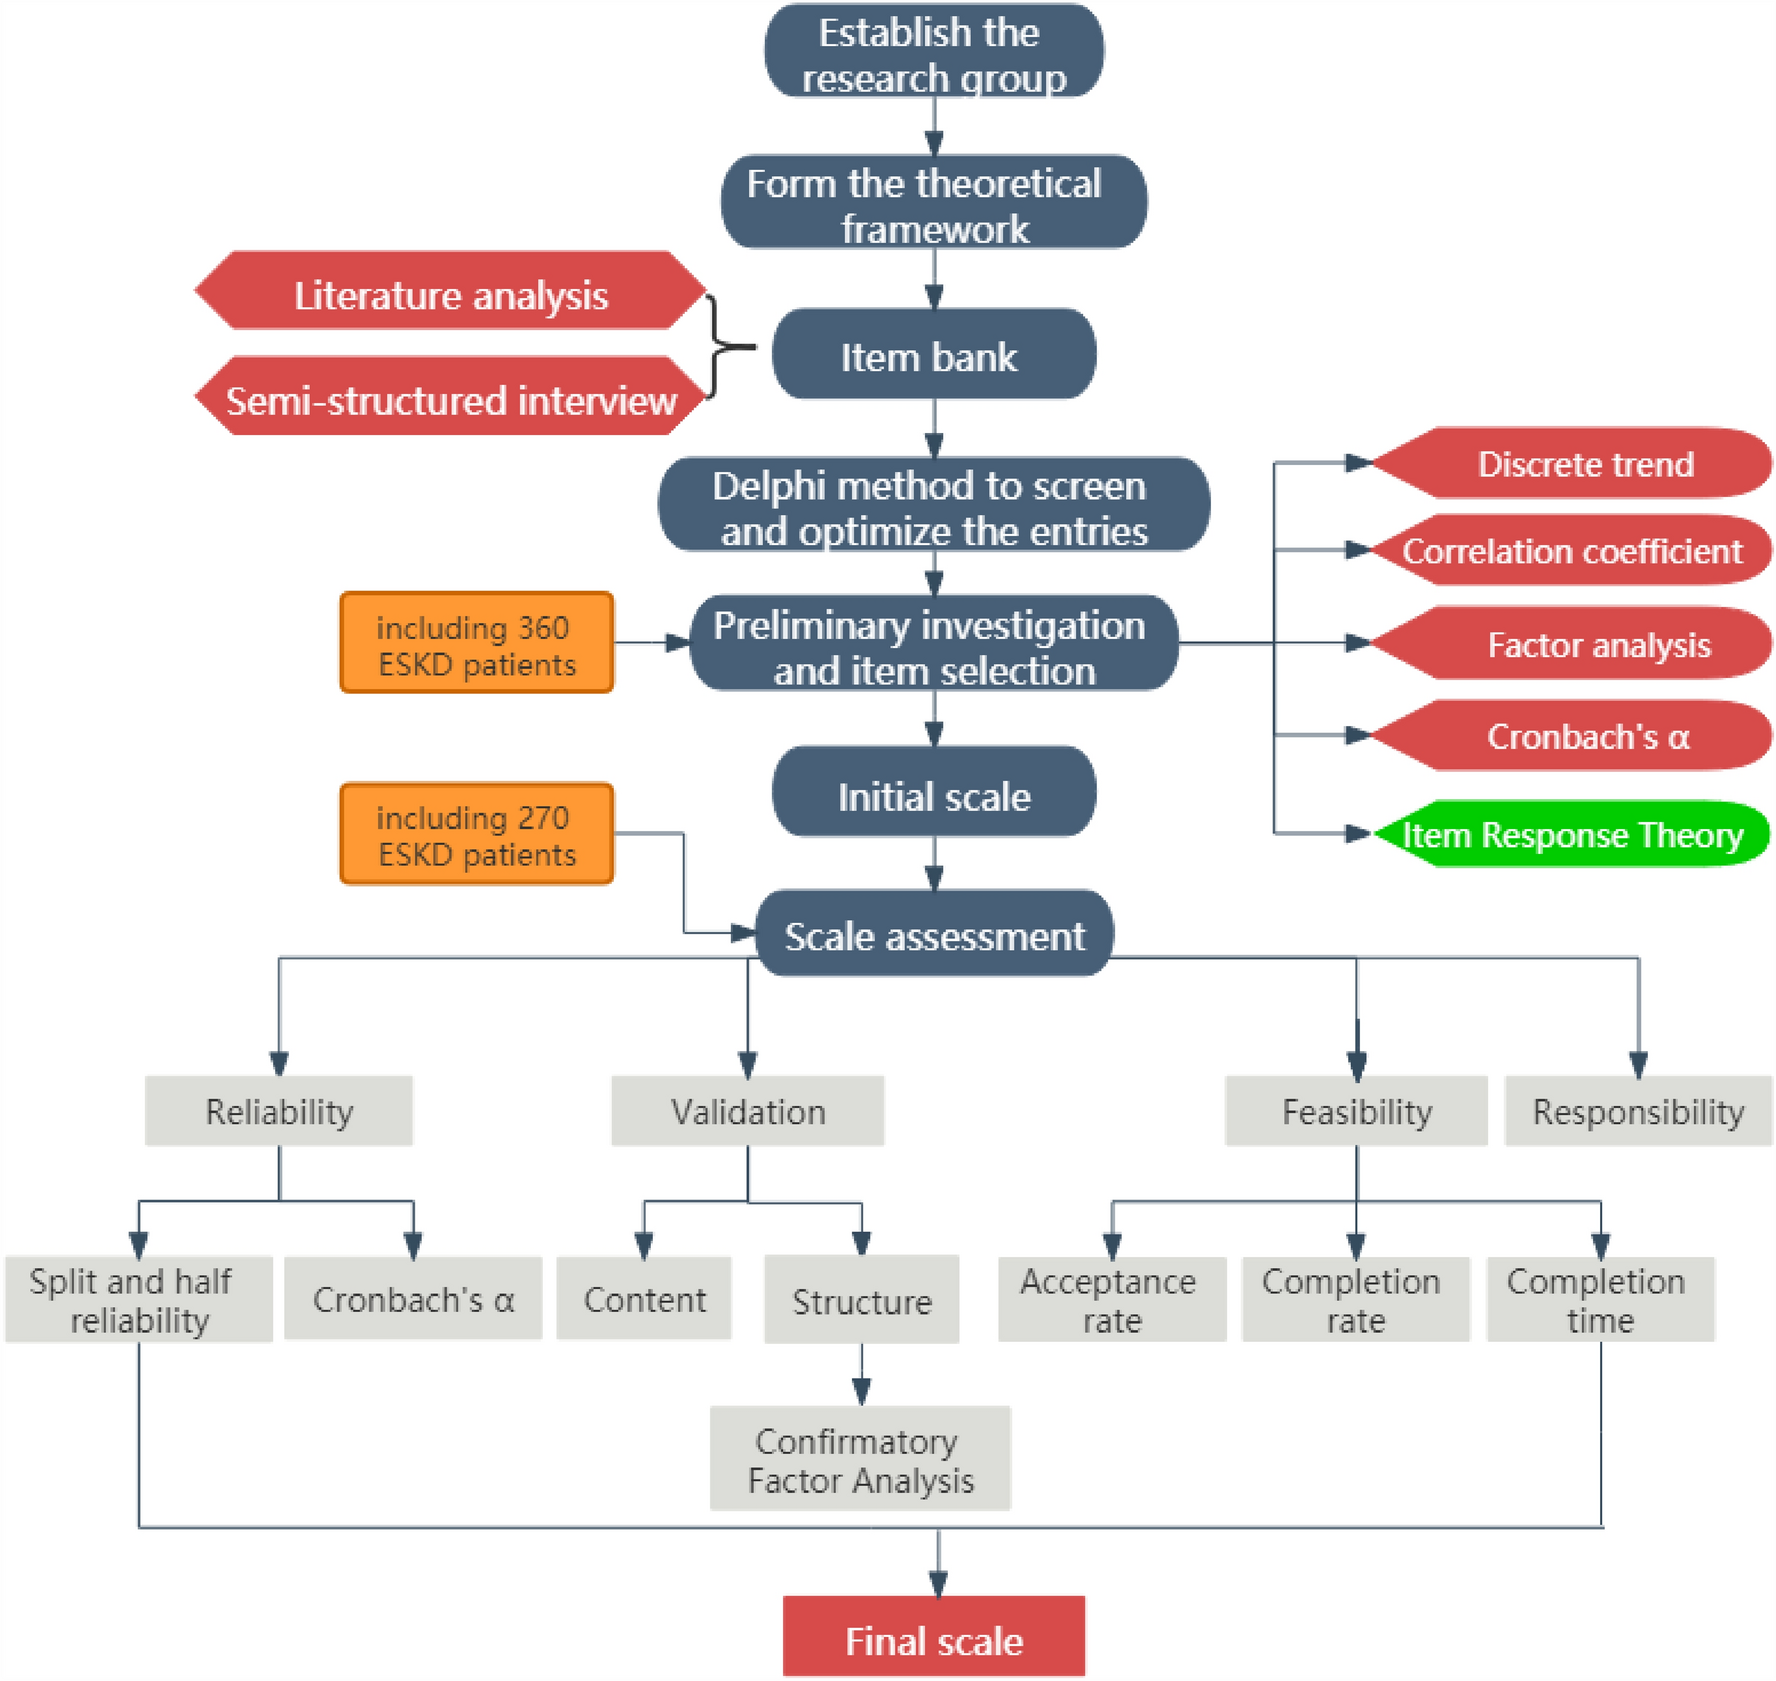

During the item filtering process, we conducted a clinical survey of 365 patients, and 360 valid samples were collected. The patients’ average age was 54 ± 12.56, and there were 187 males (51.9%) and 173 females (48.1%). To examine the reliability and construct validity of the scale, 272 patients were surveyed with the final scale. The mean age of these patients was 51 ± 13.48 years; 188 were males (69.1%), and 84 were females (31.9%). 47 (13.1%) individuals had primary school education or below, 236 (65.5%) had junior high or senior high school education, and 77 (21.4%) had undergraduate education or above; 271 (75.3%) were married, and the remaining 89 (24.7%) were single, including those who were divorced; 238 (66.1%) of the patients were engaged in paid work, and the remaining 122 (33.9%) were unemployed; 21 (5.8%) individuals had high income (annual household income > 150,000 CNY), 192 (53.3%) had moderate income (annual household income between 50,000 and 150,000 CNY), and 147(40.9%) had low income (annual household income < 50,000 CNY); 58 (16.1%) cases had concurrent diabetes, 125 (34.7%) had concurrent hypertension, 43 (11.9%) had concurrent cardiovascular disease, and 66 (18.3%) were infected with hepatitis B. The distribution of personal and clinical characteristics of the study patients is shown in Table 1.
Table 1 Demographic and disease characteristics of patientsPsychometric properties of the level of CKD-PROItem generation and selectionIn total, 79 entries were generated through literature analysis and patient interviews. In addition, in the physiological, psychological, social, and therapeutic domains, there were 27, 20, 12 and 20 items, respectively.
Subsequently, a total of 22 questionnaires were distributed in the 2 rounds of this study. The recovery rates of expert consultation questionnaires in the first and second rounds were 100% and 90.9%, and the positive coefficients of experts were 100% and 90.9%, respectively, indicating a high degree of participation and importance in this study. The Kendall coordination coefficient W of the second round of consultation was 0.254, which was statistically significant by the χ2 test (χ2 = 175.500, p < 0.001). The coordination coefficient of each dimension was between 0.201 and 0.273 (p < 0.05), indicating that the expert scores were consistent. The coefficient of variation for the importance of each item was 0–0.34, indicating that the experts agreed on the content of the index. The coefficient Cr value of expert authority degree was 0.92, indicating high reliability of expert scoring and authoritative and reliable research results.
In the first round of expert consultation, 9 items—dry mouth, constipation, leg discomfort, tinnitus, slow reaction, bad emotional control, stable blood pressure, protein intake control and water intake control—were deleted due to weak correlation, repeated content, and inconsistent fields. Four items—foam urine, skin damage, folk prescription purchase, blood pressure and blood sugar monitoring—were added, and some items were revised and improved. In the second round of expert consultation, six items were deleted: soreness and pain in the back, memory loss, confidence in the future, financial burden, social status, and impact on daily work. After 2 rounds of expert consultation and discussion and modification by the research group, a preliminary scale containing 64 items in 12 dimensions was formed.
Finally, researchers analyzed the data from 360 patients with CKD. The discrete trend method, correlation coefficient method, factor analysis method, Cronbach’s α coefficient method and item response theory were used to screen the scale items, and the items were removed with strict standards. The items that were recommended to be retained by at least three methods were selected, that is, the items that did not meet the standards by more than two methods were deleted. The final scale consists of 54 items, which belong to 12 dimensions and 4 domains. Among them, 16 are in the field of physiology, 14 in the field of psychology, 9 in the field of society and 15 in the field of therapy. The results are shown in Table 2.
Table 2 Results of the item-selection phase using CTT and IRTValidation of the CKD-PROThere were 272 issued copies of the CKD-PROs in all, and 270 of them were retrieved for analysis.
Reliability analysisCronbach’s α coefficients were calculated in four domains internally: 0.916 physiological, 0.893 psychological, 0.811 social domain, and 0.888 therapeutic. The coefficient for the entire scale was 0.939. The split-half reliability coefficient of the CKD-PROs was 0.945, and in the physiological, psychological, social, and therapeutic domains, it was 0.922, 0.904, 0.821 and 0.912, respectively. Thus, the scale showed excellent reliability.
Content validityThe CVIs of all items were higher than 80%, indicating that there was acceptable content validity. In addition, in the preparation of the CKD-PROs scale, many relevant studies and domestic and foreign scales were consulted. Methods such as expert consultation and patient interviews were used to conduct in-depth and repeated argumentations on the optimization of the scale items to ensure that the scale had high content validity.
Construct validityThe results show that the standard load solutions of each factor are all greater than 0.3. The results in Table 3 show that the values were all less than 8 except for the SOD field. The AGFI value of SOD was less than 0.8, but the AGFI value of other fields was greater than 0.8. Except for PSD, SOD RMSEA is greater than 0.1, SOD RMR is greater than 0.1, and all other fields are less than 0.1. The CFI value of the SOD field is 0.860, and the CFI value of other fields is greater than 0.9. The overall fitting of the model agrees with all the expressions, suggesting that the model has good structural validity (Fig. 3).
Table 3 Goodness-of-fit statistics of the CKD-PROsFig. 3
Confirmatory factor analysis model
Dimensional correlationThere is a strong correlation between each item and its field, and the correlation number r of each item ranges from 0.413 to 0.669.
Response analysisIn this survey, 2 measurements of 147 subjects before and after treatment were used, and the matched sample t test was used to analyze the 2 measurements. According to the results in Table 4, the scores of subjects before and after treatment were statistically significant except for GEN and DOS (all p < 0.05). The differences were all within a reasonable range, indicating that the scale can effectively distinguish patients before and after treatment and that the scale has a good response degree.
Table 4 The scores of all aspects of the scale were compared before and after treatmentFeasibility analysisA total of 636 questionnaires were issued in the 2 clinical investigations, and 630 questionnaires were finally collected with a recovery rate of 99.1%, among which 630 were effective for an effective rate of 100%. The completion time for each questionnaire was approximately 13 min. The above results show that this scale has good feasibility.
留言 (0)