Chemicals
Thiobarbituric acid (TBA), trichloroacetic acid (TCA), Ellman’s reagent (DTNB), N-(1-Naphthyl)ethylenediamine dihydrochloride, neocuproine, 2,4,6-Tris(2-pyridyl)-s-triazine (TPTZ), 2,2-diphenyl-1-picryl-hydrazyl (DPPH), acetylthiocholine iodide and quercetin were obtained from Sigma-Aldrich, USA. Methanol was obtained from Merck (Darmstadt, Germany). The remaining chemicals and reagents used for this study were obtained from other standard sources.
Extraction of plant leaves
Spondias mombin, Carica papaya and Kalanchoe crenata leaves were obtained from farmlands (Latitude 7° 18′ 15.372″ N and longitude 5° 8′ 13.247″ E; Latitude 7° 18′ 37.076″ N and longitude 5° 15′ 28.789″ E; Latitude 7° 16′ 57.698″ N and longitude 5° 13′ 39.065″ E, respectively) in Akure, Southwest Nigeria, in July 2019. Authentication was carried out at The Federal University of Technology, Akure, Nigeria, and voucher specimens were deposited at the University’s herbarium. The leaves were air-dried at 25–30 °C for 2 weeks with relative humidity ranging between 56 and 57%. The dried plant materials were pulverized, and 200 g of each powdered sample was extracted by maceration in 800 mL of 80% methanol for 48 h. The mixtures were filtered, using Whatman (No. 1) filter paper, concentrated and lyophilized to obtain the dry extracts of the plants. The percentage yields were Spondias mombin 10.5%, Carica papaya 8.5% and Kalanchoe crenata 7.0%.
Qualitative and quantitative phytochemical screening
Qualitative and quantitative phytochemical screening were carried out to detect and quantify phytochemicals present in the plant extracts.
Qualitative phytochemical
The preliminary phytochemical studies were performed to identify diverse classes of chemical compounds present in the plant extracts using standard procedures. Test for tannins, alkaloids, anthraquinones, saponins [59], test for flavonoids [54] and test for steroids [23] were performed as previously described.
Determination of total phenolic content (TPC)
Deionized water (0.5 mL) and 125 μL of Folin–Coicalteu reagent were added to 125 μL of extract (1 mg/mL), mixed and then allowed to stand for 6 min before 1.25 mL of a 7% (w/v) Na2CO3 solution was added. The reaction mixture was then allowed to stand for an additional 90 min before the absorbance was taken at 760 nm. Various concentrations of gallic acid solutions (6.25, 12.5, 25, 50, 75, 100, 200 µg/mL) were prepared and used to create a standard curve. The amount of total phenolics was expressed as gallic acid equivalents (GAE, mg gallic acid/g sample).
Determination of total flavonoid content (TFC)
The total flavonoid content was determined using a colorimetric method described by [16]. Extracts (1.0 mg/mL), 75 μL of 5% (w/v) NaNO2 solution, 0.150 mL of freshly prepared 10% (w/v) AlCl3 and 0.5 mL of 1 M NaOH solution were added. The final volume was then adjusted to 2.5 mL with deionized water. The mixture was allowed to stand for 5 min, and the absorbance was measured at 510 nm. Various concentrations of quercetin solutions (6.25, 12.5, 25, 50, 75, 100, 200 µg/mL) were prepared and used to create the standard curve. The amount of total flavonoids was expressed as quercetin equivalents (QE, mg quercetin/g sample).
Determination of tannin content
Tannin content of extracts was determined by the Folin–Ciocalteu method [28]. Sample (0.1 mL) was added to a 10-mL volumetric flask containing 7.5 mL of distilled water, 0.5 mL of Folin–Ciocalteu phenol reagent, and 1 mL of 35% sodium carbonate solution and diluted to 10 mL with distilled water. The mixture was thoroughly shaken and kept at room temperature for 30 min. A standard curve was prepared with graded concentrations of tannic acid (6.25, 12.5, 25, 50, 75, 100, 200 µg/mL). The absorbance was measured at 700 nm and tannin content was expressed in terms of mg of tannic acid equivalent/ g of dried sample.
HPLC–DAD fingerprinting
High-performance liquid chromatography (HPLC) was used to identify the presence of phytocompounds in methanolic leaf extracts of Spondias mombin, Carica papaya and Kalanchoe crenata. The samples were dissolved in aqueous acetonitrile (10 mg/20 mL) and mixed vigorously for 30 min. After mixing, the aqueous end was run off while the organic solvent end was collected into a 25-mL standard flask. The analysis was performed on a Shimadzu (NexeraMX) HPLC system fitted with uBONDAPAK C18 column (length 100 mm, diameter 4.6 mm, and thickness 7 μm). The mobile phase consisted of a mixture of an aqueous acetonitrile (acetonitrile/water, 80:20). The flow rate of the sample was 2 mL/min. Compounds were detected by a UV detector (Diode Array Detector, DAD) at 254 nm. The retention times of the identified compounds of interest were measured by standard solution at a concentration of 15.69 mg/g. The extract was injected into the high-performance liquid chromatographic machine to obtain a curve providing peak area and retention time in a chromatogram. The peak area of the sample was compared with that of the standard relative to the concentration of the standard to obtain the concentration of the sample.
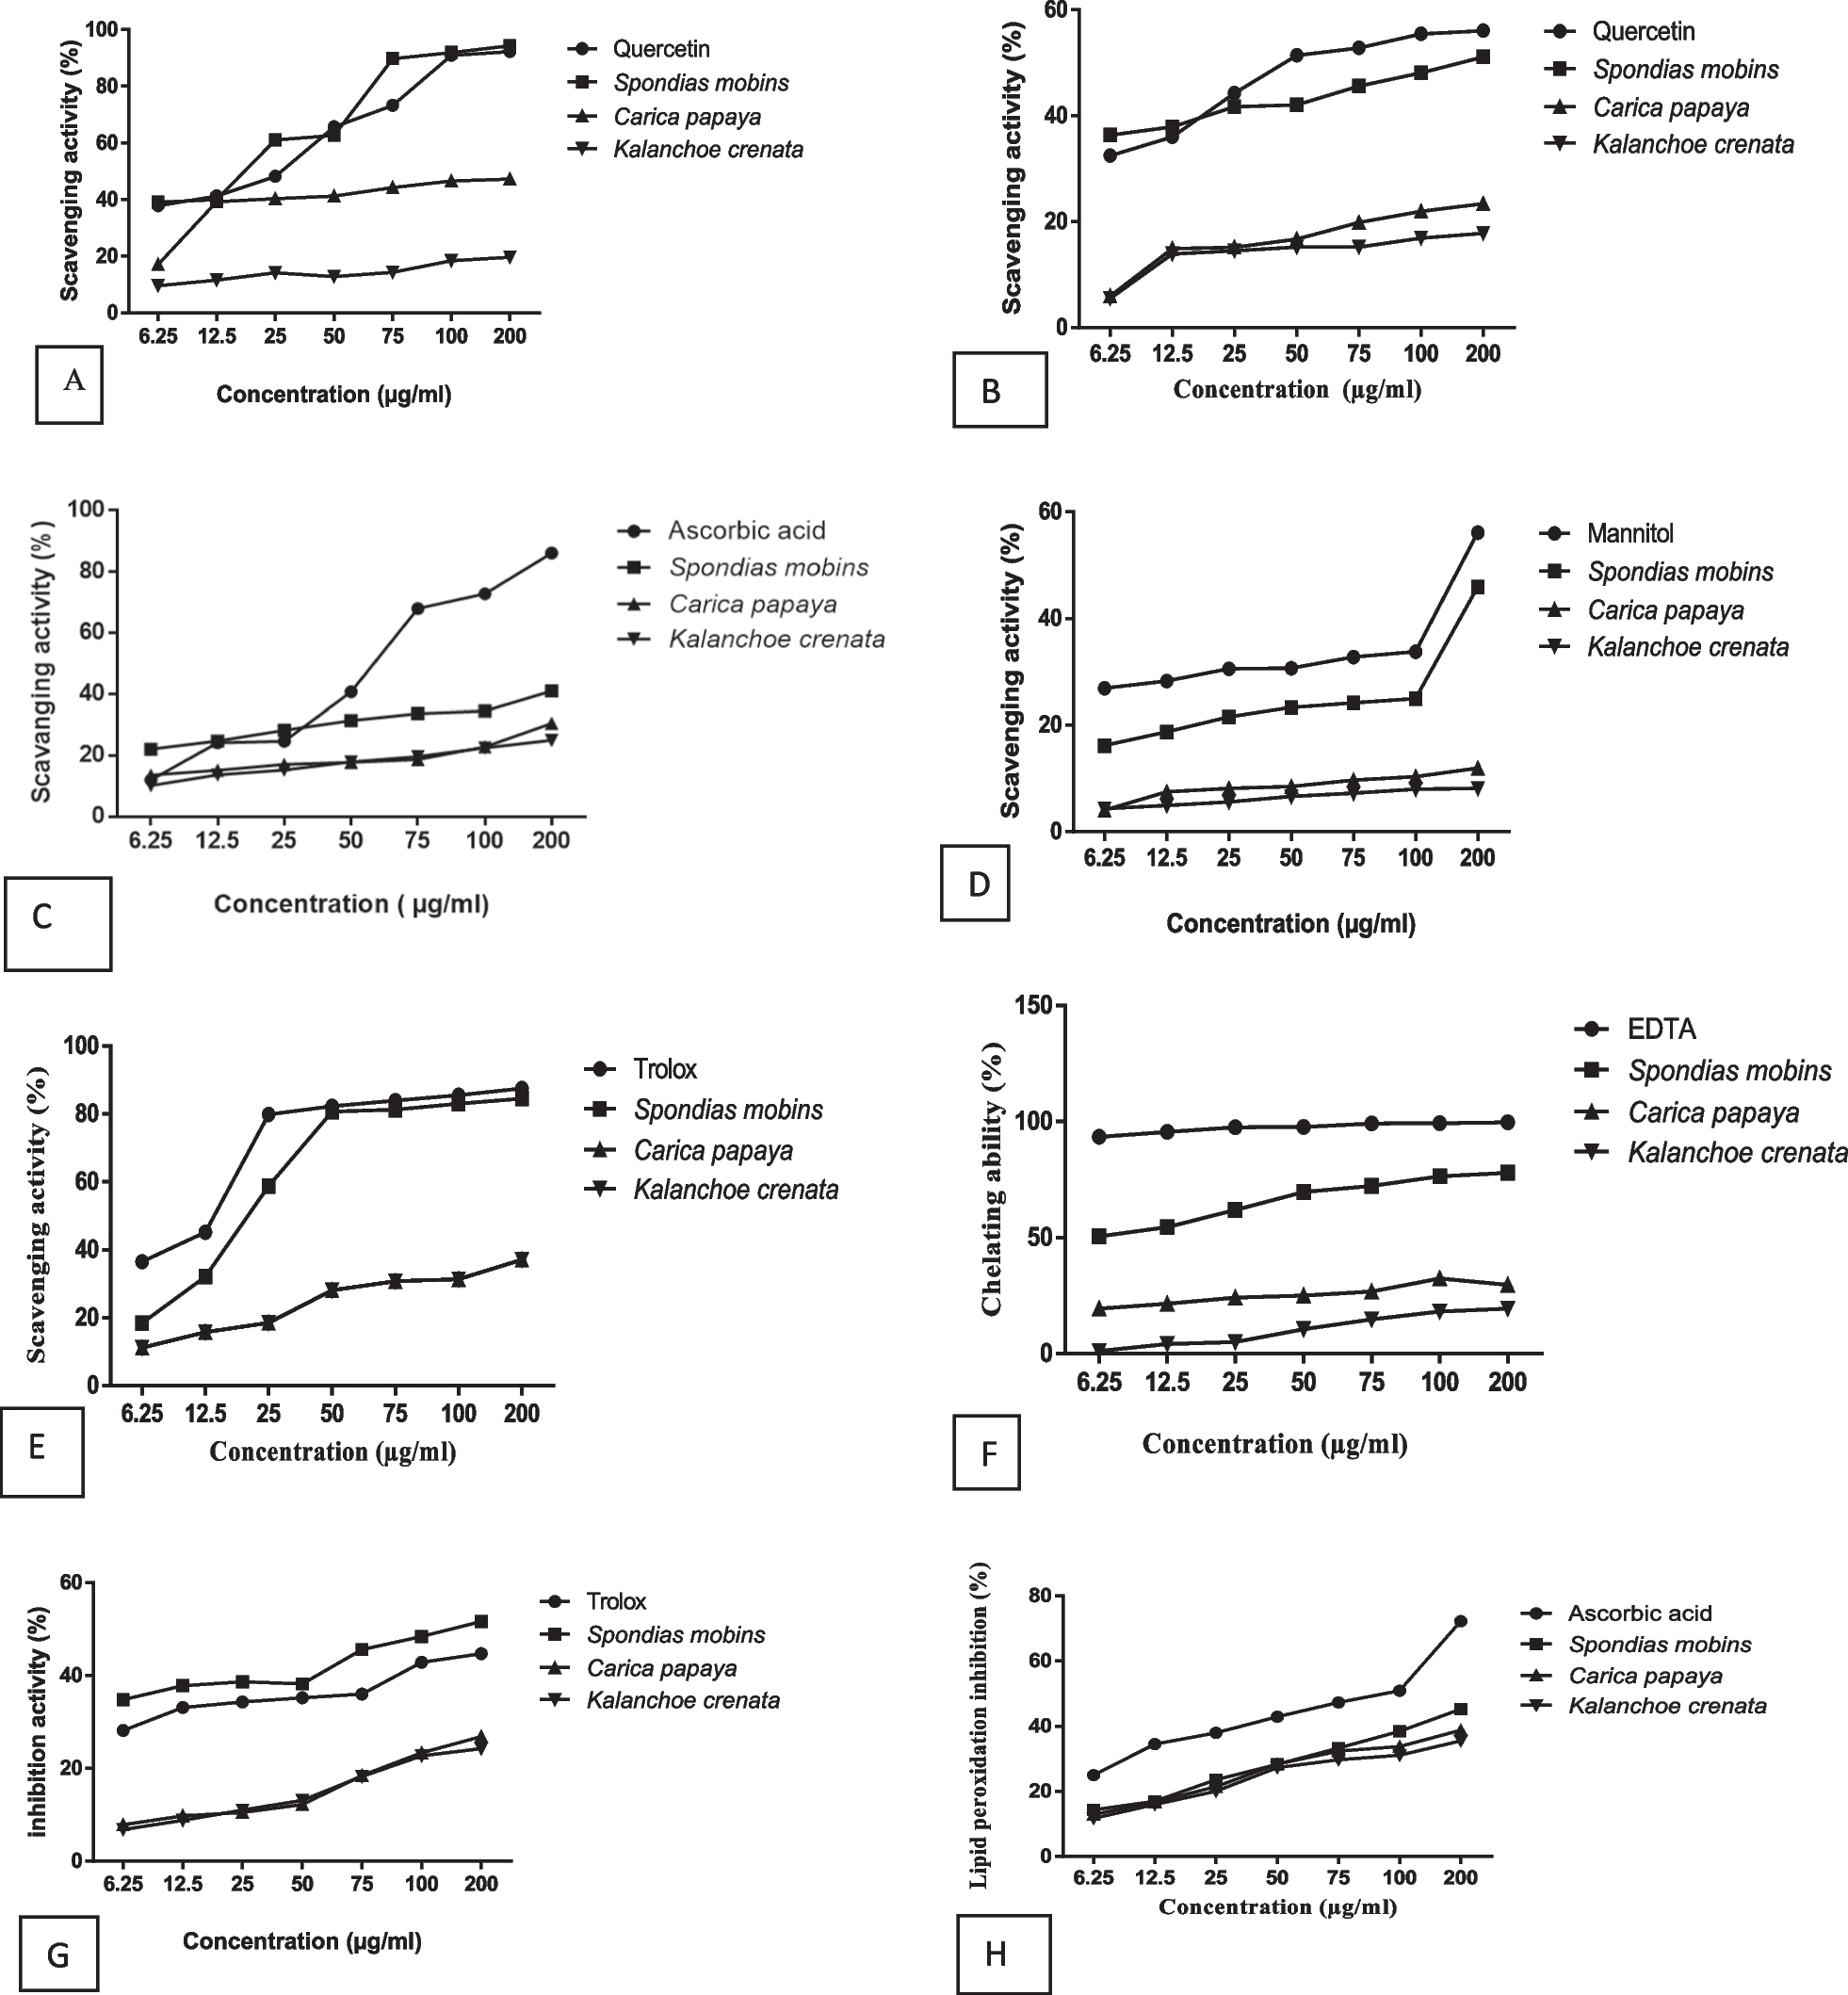
Evaluation of antioxidant and radical scavenging potentialsDPPH (1, 1-diphenyl-2-picrylhydrazyl) radical scavenging activity
The ability of the extracts to scavenge DPPH radical was determined according to the method described by [33]. One mL of 0.3 mM DPPH methanol solution was added to individual extracts and quercetin (6.25–200 µg/mL, 2.5 mL) and allowed to react at room temperature for 30 min in the dark. The absorbance of the resulting mixture was measured at 517 nm and converted to percentage antioxidant activity.
Superoxide radical scavenging activity
The superoxide radical scavenging capacity was determined according to the method of [26]. Tris–HCl buffer (50 mM, pH 8.2, 4.5 mL), 25 mM pyrogallol solution (0.4 mL), sample (1 mL) were mixed together and incubated at 25 °C for 5 min. Then, 1 mL of 8 mM HCl solution was dripped into the mixture promptly to terminate the reaction. The absorbance was measured at 420 nm. Quercetin was used as the reference standard. The superoxide radical scavenging capacity was calculated using the formula:
$$}\;\left( \% \right) = \left[ - A_ }} }}} \right]*100$$
where A0 is the absorbance of the control, A1 is the absorbance of the sample.
Nitric oxide (NO) scavenging activity
NO scavenging activity was determined as previously described [10]. The reaction mixture (3 mL) containing sodium nitroprusside (10 mM) in phosphate-buffered saline and the extract were incubated at 25 °C for 150 min. Then, 0.5 mL of the reaction mixture was removed, and 0.5 mL of Griess reagent was added. The absorbance of the chromophore formed was measured at 546 nm. The results were expressed as percentage radical scavenging activity.
Hydroxyl radical scavenging activity
A mixture containing FeCl3 (10 mM), ascorbic acid (1 mM), H2O2 (10 mM), deoxyribose (28 mM), EDTA (1 mM) and different concentrations of test samples in 500 µL phosphate-buffered saline (PBS, 20 mM, pH 7.4) was incubated for 30 min at 37 °C. After adding 1 mL of trichloroacetic acid (10%, w/v) and 1 mL thiobarbituric acid (2.8% w/v; in 25 mM NaOH), the reaction mixture was boiled for 15 min. After cooling, the extent of oxidation was measured at 532 nm and the scavenging activity of test sample was expressed as the percentage inhibition of the deoxyribose degradation to malondialdehyde [22].
2,2′-Azino-bis-(3-ethylbenzothiazoline-6-sulfonic acid) (ABTS) radical scavenging activity
The ABTS·+ stock solution was prepared by mixing the two stock solutions (7 mM ABTS solution and 2.45 mM K2S2O8 solution) in equal quantities and allowing them to react for 16 h at room temperature in the dark. The working solution was then prepared by mixing 5 mL ABTS·+ solution with 145 mL of distilled water to obtain an absorbance of 0.076 ± 0.001 units at 734 nm. Extracts (1 mL) at various concentrations (6.25–200 μg/mL) were allowed to react with 1 mL of ABTS+ solution, and the absorbance was measured at 734 nm after 30 min using a spectrophotometer [45]. The percentage scavenging activity was calculated using the formula: scavenging
$$}\;\left( \% \right) = \left[ - A_ }} }}} \right]*100$$
where Ac is the absorbance of control and As the absorbance of the extract.
Fe2+ chelating ability
The principle of the assay is based on disruption of O-phenanthroline-Fe2+ complex in the presence of a chelating agent. The Fe2+ chelating ability of the extracts was assayed according to a previously described method [36]. FeSO4 (500 μL, 500 μM) and 200 μL of extract were incubated for 5 min at room temperature, and 500 μL of 1,10-phenanthroline (0.5 mM) was added. The absorbance of the orange-colored solution was read at 510 nm with a spectrophotometer. The in vitro Fe2+ chelating ability of the sample is calculated using the formula:
$$}\;\left( \% \right) = \left[ - A_ }} }}} \right]*100$$
where Ac is the absorbance of control and As the absorbance of the extract.
Cupric ion-reducing antioxidant capacity (CUPRAC)
Determination of the cupric ion (Cu2+)-reducing ability of the individual extracts was based on a previously described method [7]. CuCl2 solution (0.01 M), 1.0 M ammonium acetate buffer solution and 7.5 mM of ethanol neocuproine solution were added to each test tube containing different concentrations of standard antioxidant (Trolox) or extracts. Finally, the total volume was adjusted to 2 mL with distilled water and incubated for 30 min at room temperature. Absorbance was measured at 450 nm against a reagent blank.
Ferric-reducing antioxidant power (FRAP)
The assay involved the rapid reduction of ferric-tripyridyltriazine (Fe3+-TPTZ) to ferrous-tripyridyltriazine (Fe2+-TPTZ), a blue-colored product by antioxidants present in sample [12]. FRAP reagent comprising 300 mM acetate buffer (pH 3.6), 100 mM TPTZ in 40 mM HCL solution, and 20 mM ferric chloride (10:1:1) was prepared, and 0.2 mL of each sample was mixed with 1.3 mL of the FRAP stock solution. Absorbance was measured at 620 nm, and FRAP value was extrapolated from a standard curve of Fe2+ solution.
Lipid peroxidation inhibitory activity
Brains were obtained from albino rats and homogenized in ice-cold Tris–HCl buffer (20 mM, pH 7.4). The resulting homogenate was centrifuged at 3000 rpm for 10 min to obtain the supernatant. Aliquot (0.5 mL) of the supernatant was added to 0.2 mL extracts of various concentrations (6.25–200 µg/mL), and the volume was made up to 1 mL with distilled water. Then, 0.05 mL of 0.07 mM FeSO4 was added, and the mixture was incubated at 37 °C for 30 min and 1.5 mL of acetic acid (pH 3.5, 20%) was added. Thereafter, 1.5 mL of 0.8% (w/v) TBA in sodium dodecyl sulfate 1.1% (w/v) was added. The mixture was heated at 95 °C for 60 min. Then, the samples were cooled and centrifuged at 3000 rpm for 10 min. The intensity of the pink-colored complex was measured at 532 nm and converted to percentage inhibition of lipid peroxidation [49].
Acetylcholinesterase (AChE) inhibitory activity
AChE inhibitory activity was measured by the colorimetric method of [18]. Rats were decapitated; the brains quickly removed and placed on an ice-cold plate. The brain was weighed and homogenized in cold 10 mM Tris–HCl buffer, pH 7.2, containing 160 mM sucrose. The homogenates were centrifuged at 10,000×g for 10 min at 4 °C, and the resulting clear supernatants were used as enzyme sources. Briefly, enzyme in 20 mM phosphate buffer (pH 7.4) was incubated in the presence of 10 mM DTNB solution with different concentrations of each extract. The enzyme reaction was initiated by the addition of 75 mM acetylthiocholine iodide after the pre-incubation times of 0, 1, 2 and 3 min. Substrate hydrolysis was monitored by the formation of a yellow anion of 5-thio-2-nitrobenzoic acid at 415 nm. Enzyme activity was estimated through differences in absorbance/min and the percentage inhibition of AChE.
Prediction of pharmacokinetic properties
Pharmacokinetic properties of natural compounds such as MW (molecular weight), LogP, HBD (number of hydrogen bond donors), HBA (number of hydrogen bond acceptors), TPSA (topological polar surface area), nrtB (number of rotatable bonds), nViolation (violations of Lipinski’s rule of five) were predicted using SwissDock Online server (http://www.swissadme.ch/) and Molinspiration Online tool (http://www.molinspiration.com/). The percentage of absorption (% ABS) was calculated using the Zhao et al. formula:
$$\% } = \left[ \left( }} \right)} \right]$$
Molecular docking
The molecular docking study of compounds was performed to evaluate the binding interaction mode in the active site of the AChE enzyme (4EY5) that was obtained from the Protein Data Bank. The binding pocket of the receptor was predicted using DogSite platform of the protein-plus webserver (http://proteinsplus.zbh.unihamburg.de). The protein was prepared by removing co-crystallized ligands and additional water molecules using Pymol 2.5.1. The 3D sdf file of the compounds (Quercetin (CID: 5280343), Kaempferol (CID: 5280863), Ferulic acid (CID: 445858), Lycopene (CID: 446925), Leucocyanidin (CID: 3705436), Gallic acid (CID: 370), Isorhamnetin (CID: 5281654) were obtained from PubChem database and OpenBabel 2.4.1 was used to convert to the pdb format. AutoDock Vina version 1.1.2 was used for molecular docking process. Docking analysis was carried out with the grid size set as 60 × 60 × 60 with 1.0 Angstrom spacing and Centres x, y and z to be − 2.857, − 40.075 and 30.865, respectively. The exhaustiveness that determines how comprehensive the software search for the best binding mode was set to the default value of 8 Angstrom. Biovia Discovery Studio 2021 was used for visualization and analyzing of the docking results.
Inhibition constant (Ki)
The inhibition constant (Ki) of all the compounds against AChE was calculated from docking energy using the following equation:
$$}\;\left( }} \right) = \exp \, \left( \right)/RT$$
where T = 298.15 K, R = 1.987.
Correlation analyses
The strength and direction of the relationship between the antioxidant properties and AChE inhibitory activities of the extracts were evaluated statistically.
Statistical analyses
All statistical analyses were performed using the GraphPad version 6 software. Results were expressed as mean ± SEM (n = 3). One-way analysis of variance was used for data analysis. Significant differences between groups were detected in the analysis of variance using Duncan’s multiple range test at P < 0.05. Statistical differences between mean values of individual tests were detected using independent-sample t test. The correlation analyses the GraphPad software.


留言 (0)