
記住我


A total of 16 patients with GD (three with GD1, six with GD2, and seven with GD3) participated in the pre-test (Table 1). The mean age at diagnosis was 4.3, 1.0, and 6.6 years, and the mean current age was 46.3, 9.0, and 28.4 years in patients with GD1, GD2, and GD3, respectively. All three patients with GD1 and 4/7 (57.1%) patients with GD3 completed the PROM themselves, whereas all six patients with GD2 required a proxy to complete the PROM.
Table 1 Patient demographics and clinical characteristicsPROM scoresThe PROM questionnaire consisted of three parts (Additional file 1: Table S1; Additional file 2: Table S2): Parts 1 and 2 were translated into Japanese from the previously published PROM for GD1 [14], whereas Part 3 was newly developed. Part 1 assessed patient experiences over the previous month, whereas Parts 2 and 3 assessed experiences over the previous week.
For Part 1, mean (standard deviation [SD]) total scores were 27.5 (10.6) and 38.8 (27.2) for GD2 and GD3, respectively, out of a maximum of 150 (highest possible burden) (Table 2). Mean scores were not calculated for GD1 because data were not fully collected for all three patients. Data were also not fully collected for 4/6 (66.7%) and 3/7 (42.9%) patients with GD2 and GD3, respectively. In reviewing the answers to Item 14 (“Over the past month, all of my health concerns have been about Gaucher’s disease”), it appeared that the Japanese translation was misinterpreted as how large a burden GD was instead of the burden of other health concerns relative to GD. For this reason, the scores for this item were reversed for analysis. For the 15 individual items, the mean (SD) score in the overall pre-test population was lowest (0.625 [1.77]) for Part 1 Item 3 (P1-3) “Over the past month, my Gaucher disease has restricted my ability to have intimate relationships with my spouse/partner” and highest (6.00 [3.38]) for P1-14 “Over the past month, all of my medical concerns have been Gaucher-related” (Additional file 3: Table S3).
Table 2 PROM scores: summary of Parts 1, 2, and 3For Part 2, mean (SD) total scores were 17.0 (8.19), 45.8 (24.1), and 16.2 (15.7) for GD1, GD2, and GD3, respectively, out of a maximum of 90 (Table 2). For the nine individual items, the mean (SD) score in the overall pre-test population was lowest (1.53 [3.23]) for P2-2 “Over the past week, how visibly big or swollen has your abdomen looked because of your Gaucher disease?” and highest (5.69 [4.67]) for P2-1 “Over the past week, how dependent on others have you been because of your Gaucher disease?” (Additional file 3: Table S3).
For Part 3, mean (SD) total scores were 79.0 (41.4) and 25.7 (12.7) for GD2 and GD3, respectively, out of a maximum of 150 (Table 2). Mean scores were not calculated for GD1 because all three patients had data that were not fully collected. Data were also not fully collected for 3/6 (50.0%) and 4/7 (57.1%) patients with GD2 and GD3, respectively. For the 15 individual items, the mean (SD) score in the overall pre-test population was lowest (1.90 [2.69]) for the item “Over the past week, have you had any pain in the body?” (P3-6 in the pre-test, P3-7 in the main survey) and highest (5.90 [3.11]) for the item “Have you ever felt physically tired after visiting the hospital or treatment?” (P3-12 in the pre-test, P3-13 in the main survey) (Additional file 3: Table S3).
Cronbach’s alphaCronbach’s alpha, an indicator of content consistency, was calculated as 0.926 for the overall PROM, 0.841 for Part 1, 0.902 for Part 2, and 0.934 for Part 3.
Inter-item correlationsInter-item correlations were mapped in a correlation matrix (Additional file 4: Figure S1). In general, most items in Part 2 were positively correlated with items in Part 3. P1-7 (“Because of my Gaucher disease, I am concerned I will be at risk of cancers”) was negatively correlated with other items in Part 1 and with several items in Parts 2 and 3, but positively correlated with P3-1 (“Over the past week, have you had any difficulty hearing?”). Most items in all three parts were negatively correlated with patient age and duration of disease.
InterviewsInterviews with the seven patients and nine caregiver proxies who completed the pre-test provided insights into the usefulness of the PROM for different GD types. For example, the items in Part 3 that focus on neurological symptoms are not applicable to GD1. In addition, patients with GD2 or GD3 who have cognitive or speaking difficulties were not able to convey their emotions to a proxy who completed the PROM; therefore, items related to emotions may not be useful for these patients.
The interviews also identified potential areas for improvement of the PROM. As a result of patient feedback and discussion among the authors, “swallowing food” and “speaking” were considered to be separate symptoms; therefore, the item “Over the past week, have you had any difficulty swallowing food or speaking?” was divided into two items in the main survey. Patients with all types of GD and/or their proxies found the 0–10 scale used in Parts 2 and 3 difficult to use; however, because the original English version of Part 2 used a 0–10 scale [14], we did not change the scale in either Part 2 or Part 3.
Main surveyDemographic and baseline clinical characteristicsA total of 33 patients with GD (nine with GD1, 13 with GD2, and 11 with GD3) participated in the main survey (Table 1). About half (51.5%) of the patients were female. The mean age at diagnosis was 23.4, 0.6, and 8.1 years, and the mean current age was 58.6, 10.0, and 37.1 years in patients with GD1, GD2, and GD3, respectively. All patients with GD1 and 8/11 (72.7%) patients with GD3 completed the questionnaire themselves, whereas all patients with GD2 required a parent to complete the questionnaire as a proxy.
PROM scoresFor Part 1, mean (SD) total scores were 42.1 (31.5), 13.8 (12.4), and 65.0 (21.3) for GD1, GD2, and GD3, respectively, out of a maximum of 150 (Table 2). Data were not fully collected for 3/9 (33.3%), 11/13 (84.6%), and 7/11 (63.6%) patients with GD1, GD2, and GD3, respectively, suggesting that the items in Part 1 were particularly difficult for patients with nGD to answer. In addition, many of the Part 1 items are not applicable to children with nGD (e.g. questions about how GD affects jobs, intimate relationships, financial burden, etc.). For the individual items, the mean (SD) score in the overall main survey population was lowest (1.17 [2.81]) for P1-3 “Over the past month, my Gaucher disease has restricted my ability to have intimate relationships with my spouse/partner” and highest (5.15 [2.65]) for P1-14 “Over the past month, all of my medical concerns have been Gaucher-related” (Additional file 3: Table S3), consistent with the pre-test findings.
For Part 2, mean (SD) total scores were 17.0 (8.47), 38.7 (21.5), and 26.5 (20.6) for GD1, GD2, and GD3, respectively, out of a maximum of 90 (Table 2). For the individual items, the mean (SD) score in the overall main survey population was lowest (1.03 [2.01]) in P2-2 “Over the past week, how visibly big or swollen has your abdomen looked because of your Gaucher disease?” and highest (5.12 [4.25]) in P2-1 “Over the past week, how dependent on others have you been because of your Gaucher disease?” (Additional file 3: Table S3), consistent with the pre-test findings.
For Part 3, mean (SD) total scores were 24.2 (16.5), 79.7 (42.5), and 52.1 (30.2) for GD1, GD2, and GD3, respectively, out of a maximum of 160 (Table 2). Data were not fully collected for 3/9 (33.3%), 1/13 (7.7%), and 1/11 (9.1%) patients with GD1, GD2, and GD3, respectively. Notably, the percentage of patients with nGD who could complete Part 3 was much higher in the main survey (90.9–92.3%) than in the pre-test (42.9–50.0%), indicating that the modifications to Part 3 made it easier for patients to complete. For the individual items, the mean (SD) score in the overall main survey population was lowest (1.94 [2.86]) in P3-11 “During the past week, have you had any concerns about continuing treatment for Gaucher's disease?” and highest (5.48 [3.44]) in P3-13 “Have you ever felt physically tired when you went to the hospital or after treatment?” (Additional file 3: Table S3). Scores for P3-13 were consistently high across GD subtypes, indicating that fatigue related to hospital visits and treatment was a burden for all patients with GD.
Cronbach’s alphaCronbach’s alpha was calculated as 0.898 for the overall PROM, 0.896 for Part 1, 0.882 for Part 2, and 0.916 for Part 3.
Test–retest reliabilityPatients in the main analysis repeated the questionnaire twice, 2 weeks apart, and test–retest reliability was assessed by calculating Cohen’s kappa. In the overall study population, the highest kappa coefficients were for P3-4 (0.988), P2-1 (0.971), and P3-5 (0.961), and the lowest were for P1-10 (0.097), P3-9 (0.266), and P1-7 (0.286) (Table 3). Overall, most items in Part 1 had low reliability (except P1-3) and most items in Part 3 had high reliability (except P3-9). Patterns of test–retest reliability differed between the subtypes (Table 3). In patients with GD1, most items in Parts 1 and 2 had generally good reliability, whereas items in Part 3 tended to have lower reliability. In patients with GD2, items in Part 1 had low reliability, items in Part 2 had intermediate reliability, and items in Part 3 had high reliability. In patients with GD3, most items in all three parts had high reliability.
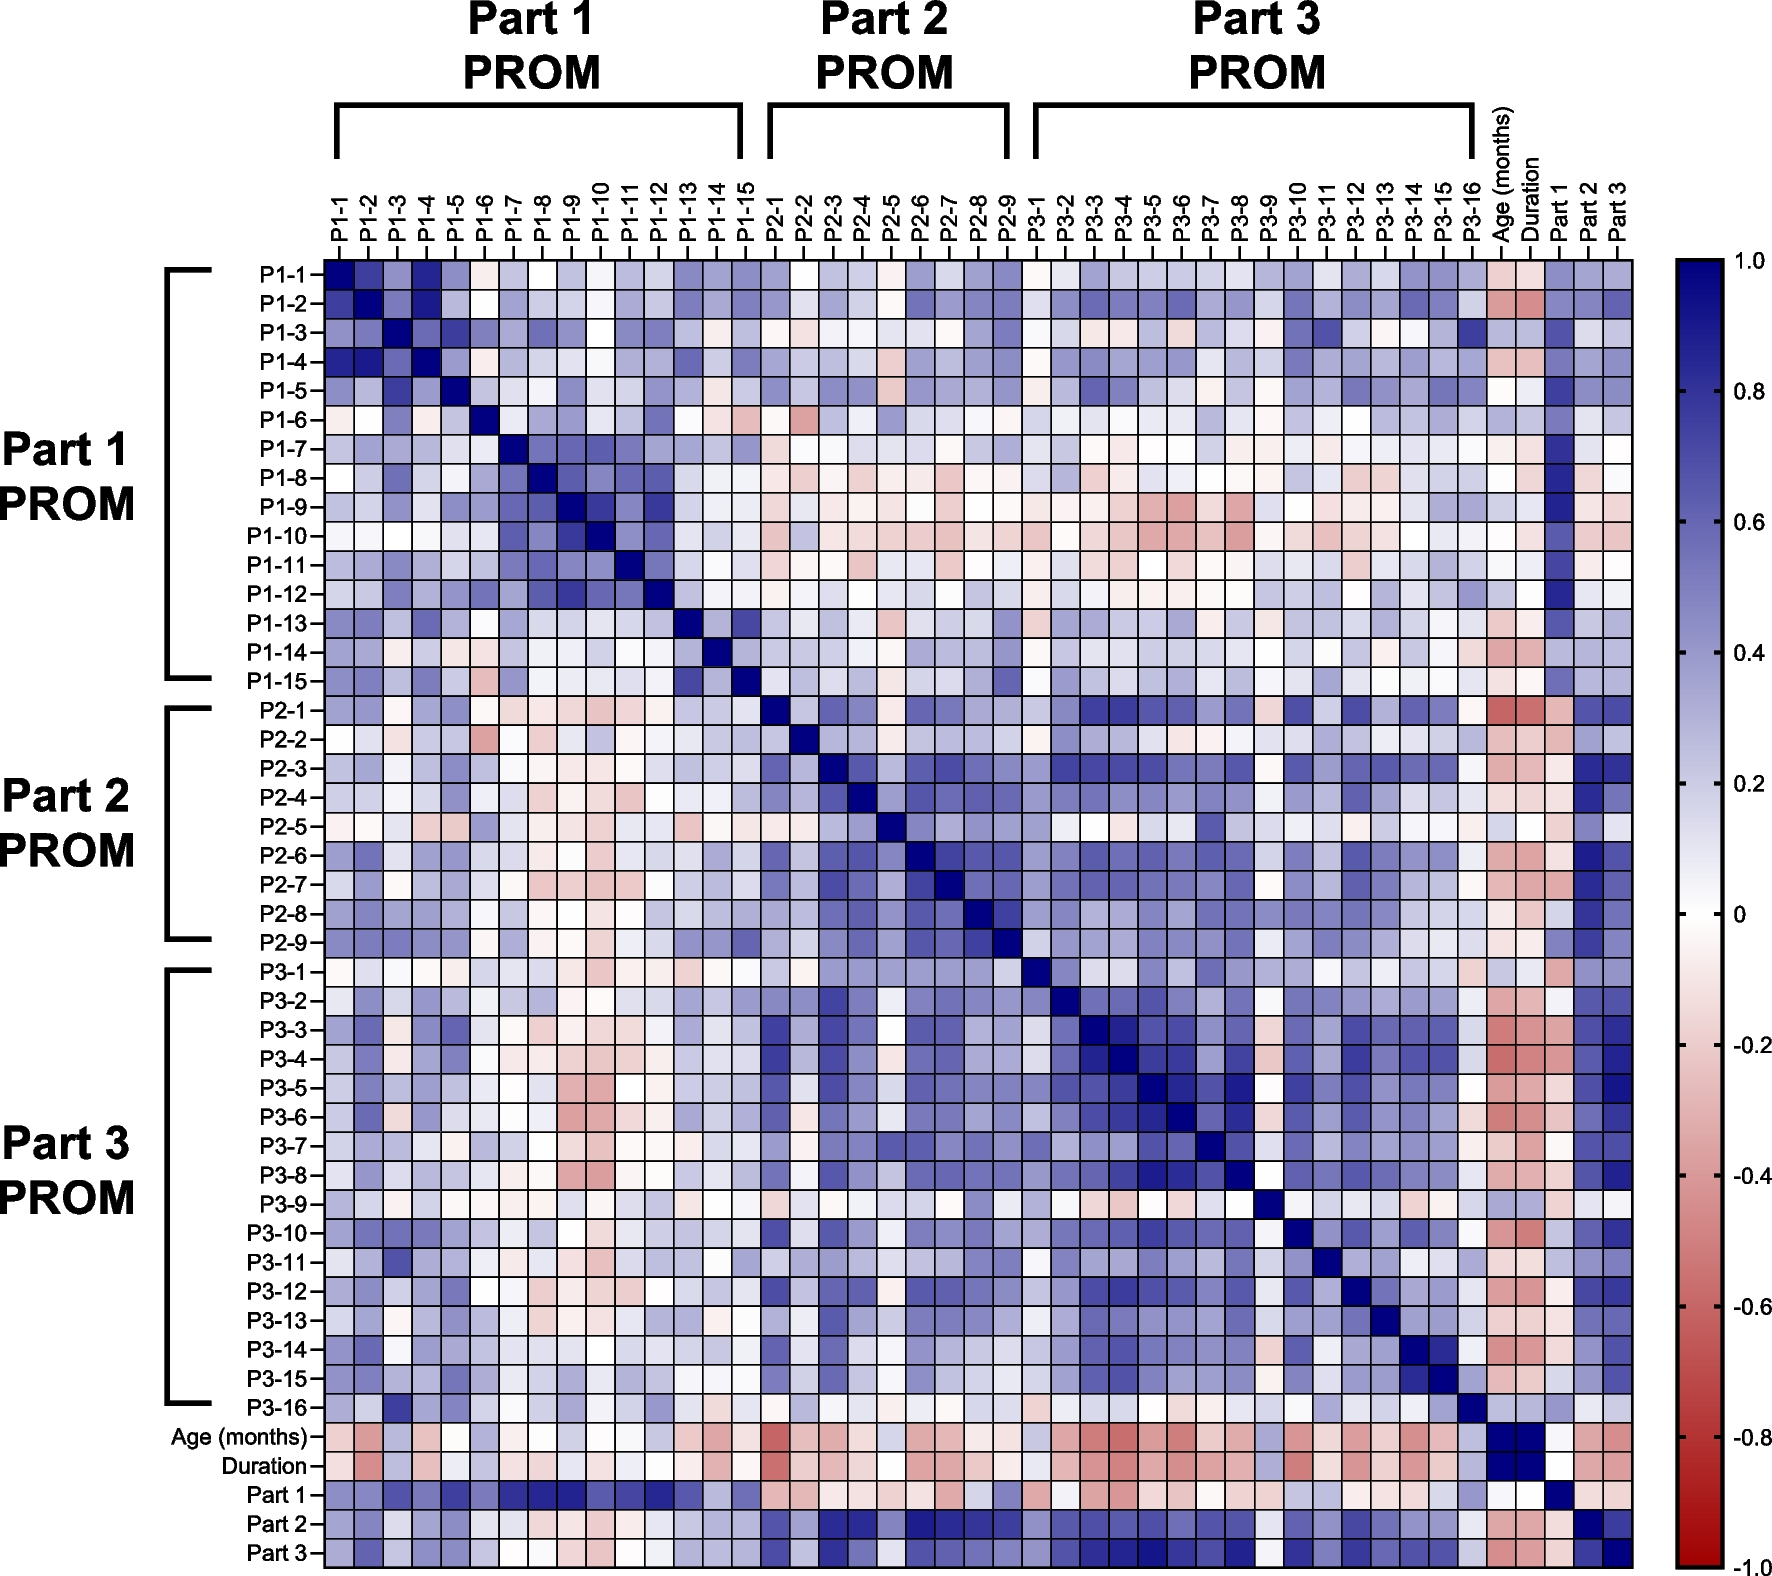
Table 3 Test–retest reliability (kappa coefficient) for main analysisInter-item correlationsIn the overall main survey population, Part 1 Items 8–12 (which cover concerns about risk of Parkinson’s disease, financial burden, effect of budget on therapy, access to expert physicians, and GD problems compared with non-GD health problems) tended to be negatively correlated with items in Parts 2 and 3 regarding specific symptoms (Fig. 1). Most items in Part 2 were positively correlated with items in Part 3. Most items in Parts 2 and 3 were negatively correlated with patient age and duration of disease, primarily in patients with GD2 (Fig. 3); the strongest negative correlation with age and disease duration was for P2-1, which asks about dependence on others. Specific correlation patterns were seen for the different GD types. In GD1, most Part 1 items were negatively correlated with P2-2 (abdomen swelling) and positively correlated with P3-16 (participation in GD patient support group) (Fig. 2). P2-4 (physical weakness) was strongly negatively correlated with P1-14 (all medical concerns were GD related) and P2-7 (GD-related worries), and P3-1 (difficulty hearing) was negatively correlated with P2-3 (fatigue). In GD2, Items P1-8 to P1-12 were negatively correlated with most Part 2 and 3 items, as seen for the overall survey population (Fig. 3). In GD3, Items P1-7 to P1-10 (concerns about risk of cancer, risk of Parkinson’s disease, financial burden, and how budget may affect therapy) were negatively correlated with most Part 3 items (except P3-14 [lack of understanding of GD by public service office] and P3-15 [lack of social support]) (Fig. 4). P1-3 (restricted intimate relationships) was positively correlated with most Part 3 items (except P3-12 [worried or nervous about going out]), and P3-7 (pain in the body) was strongly positively correlated with P2-5 (bone pain).
Fig. 1
Inter-item correlations in the main analysis of all patients with GD. The magnitude of the correlation coefficients is indicated by the color (as shown on the scale; blue indicates a positive correlation, red indicates a negative correlation). GD: Gaucher disease; P: Part; PROM: patient-reported outcome measure
Fig. 2
Inter-item correlations in the main analysis of patients with GD1. The magnitude of the correlation coefficients is indicated by the color (as shown on the scale; blue indicates a positive correlation, red indicates a negative correlation). An “X” indicates that there were insufficient data to determine a correlation coefficient. GD1: type 1 Gaucher disease; P: Part; PROM: patient-reported outcome measure
Fig. 3
Inter-item correlations in the main analysis of patients with GD2. The magnitude of the correlation coefficients is indicated by the color (as shown on the scale; blue indicates a positive correlation, red indicates a negative correlation). An “X” indicates that there were insufficient data to determine a correlation coefficient. GD2: type 2 Gaucher disease; P: Part; PROM: patient-reported outcome measure
Fig. 4
Inter-item correlations in the main analysis of patients with GD3. The magnitude of the correlation coefficients is indicated by the color (as shown on the scale; blue indicates a positive correlation, red indicates a negative correlation). An “X” indicates that there were insufficient data to determine a correlation coefficient. GD3: type 3 Gaucher disease; P: Part; PROM: patient-reported outcome measure
留言 (0)