Cloning, expression and purification of fluorescent proteins
StayGold and mStayGold were each cloned into pET-MCN vectors and transformed into BL21(DE3) Escherichia coli strain. In total, 2 l cultures at OD ~0.6 were induced overnight at 18 °C with 0.5 mM IPTG (isopropyl β-D-1-thiogalactopyranoside). Samples were purified with Ni-NTA (nickel-nitrilotriacetic acid) beads in wash buffer containing 50 mM phosphate buffer, 500 mM NaCl and 30 mM imidazole at pH 7.6. Proteins were eluted with 50 mM phosphate buffer, 500 mM NaCl and 500 mM imidazole at pH 7.6. Fluorescent proteins were then exchanged into a 20 mM HEPES (4-(2-hydroxyethyl)-1-piperazineethanesulfonic acid) pH 7.2 and 150 mM NaCl using a PD10 desalting column. sfGFP and its variants were produced similarly with mutations confirmed by sequencing.
Size-exclusion chromatography
Size-exclusion chromatography was performed using an ÄKTA Pure FPLC with a Superdex 75 Increase 10/300 GL column. Proteins were concentrated to ~2 mg ml−1 (76 μM) and loaded onto the column via a 100 μl loop. The flow rate was 0.8 ml min−1, and the buffer used was 150 mM NaCl and 20 mM HEPES (pH 7.2). Chromatograms were baseline-corrected using the mean absorbance value measured in the first 5 ml following injection. Monomer and dimer percentages were calculated after integrating the peaks corresponding to the monomer and dimer fractions. A higher concentration run using StayGold and mStayGold was performed using 4 mg ml−1 (154 μM) protein. Additional runs using a mixture of bovine serum albumin (66 kDa) and hen egg white lysozyme (14 kDa), sGFP (27 kDa) or BIORAD molecular weight standards (thyroglobulin, 670 kDa; ɣ-globulin, 158 kDa; ovalbumin, 44 kDa; myoglobin, 17 kDa and vitamin B12, 1.35 kDa) were used for estimation of apparent molecular weights.
Crystallization
StayGold was concentrated to 12 mg ml−1 in a buffer composed of 150 mM NaCl and 20 mM HEPES (pH 7.5) before setting up crystallization screens in MRC 2-drop plates using a Formulatrix NT8 robot. Crystallization used the sitting drop vapor diffusion method with 1 μl drops composed of either 2:1 or 1:2 ratios of protein solution and crystallization reagent. Crystals of StayGold grew in 1–2 d with many similar hits across the screens. The crystals used for structure determination were obtained using the SG1 HT96 Eco Screen (Molecular Dimensions) condition H4 (0.2 M sodium acetate, 25% PEG (Polyethylene glycol) 3350 and 0.1 M Bis–Tris (pH 6.5)). Crystals formed as long needles that could be broken apart for single crystal data collection.
Structure determination using x-ray crystallography
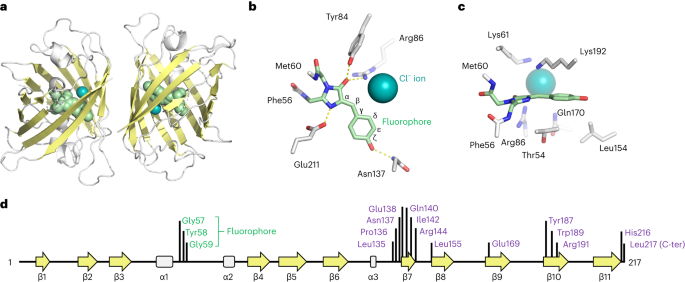
Drops containing StayGold crystals were supplemented with a solution of 70% crystallization reagent (taken from the reservoir of the plate) and 30% glycerol, collected in litholoops and flash-frozen in liquid nitrogen. X-ray diffraction experiments were conducted at the Diamond Synchrotron using remote collection at beamline I04. Diffraction images were integrated using Dials15 via Diamond’s auto-processing pipeline. Subsequent processing was performed using tools from the CCP4 suite16. Space group determination and scaling were conducted with Aimless17. Phases were calculated by molecular replacement using a monomer from 5WJ2 (ref. 18) as the search probe. The molecular replacement solution (containing two molecules per asymmetric unit) was found using Phaser19 software. After an initial round of refinement in Refmac20, a new map was calculated and density modification (including non-crystallographic symmetry averaging, solvent flattening and histogram matching) was performed with Parrot21. A new model was then built into the density-modified map using Buccaneer22, and the model was completed using iterative rounds of model building with Coot23 and refinement using Refmac20. As refinement neared completion, water was added and the model was completed by modeling in the fluorophore and chloride ion. Later rounds of model building and refinement integrated validation tools including COOT23, Procheck24 and Rampage25. Protein–protein contacts were analyzed using PISA6 and molecular images generated using PyMOL26. The StayGold structure has been deposited in the protein databank27 with accession code 8BXT. X-ray data and refinement statistics are given in Supplementary Table 1.
Fluorescence excitation and emission spectra
Fluorescence spectra were obtained using a Cary Eclipse fluorescence spectrophotometer using 5 nm excitation and emission slits. Datapoints were collected at 1 nm intervals using a scan rate of 600 nm min−1.
Microscopy and in vivo photostability
S. pombe strains were generated by chromosomal integration of the plasmids pDUAL-padh11-rlc1-GFP (pLK43), pDUAL-padh11-rlc1-40aa-StayGold (pLK114) and pDUAL-padh11-rlc1-40aa-StayGold (E138D, pLK126) at leu1-32 locus in MBY102. The plasmid, pLK43 was generated by Gibson cloning rlc1 and fluorescent protein fragments into the pDUAL plasmid28. The plasmid pLK114 was generated by swapping GFP with a 40 amino acid linker (LEGSGQGPGSGQGSGSPGSGQGSGPGQGSGPGQGSGPGQG) and StayGold fragment with the help of NEBuilder HiFi DNA Assembly Master Mix (NEB, E2621L). The rlc1-40aa-StayGold(E138) variant was generated using site-directed mutagenesis. The cells were grown at 30 °C in YES medium.
The mammalian cell line, RPE-1 cells were transfected with one of the following six expression plasmids: (1) mNeonGreen-Tropomyosin2 (pCMV-mNeonGreen-40aaLinker-TPM2.2)9, (2) Tropomyosin2 StayGold dimer (pCMV-StayGold-40aaLinker-TPM2.2), (3) Tropomyosin2 StayGold monomer (pCMV-StayGold (E138D)-40aaLinker-TPM2.2) or (4–6) the equivalent versions lacking the tropomyosin sequences (which would express the unfused fluorescent proteins). The Tropomyosin2 StayGold plasmids were constructed by swapping mNeonGreen for StayGold using the NEBuilder HiFi DNA Assembly Master Mix (NEB, E2621L). The Tropomyosin2-mStayGold variant was generated by incorporating the E138D mutation using site-directed mutagenesis.
Immortalized (hTERT, human telomerase reverse transcriptase) diploid human RPE-1 cells (ATCC, CRL-4000) were cultured in Dulbecco’s modified Eagle’s medium/Nutrient Mixture F-12 Ham with 15 mM HEPES and sodium bicarbonate (Sigma-Aldrich, D6421) supplemented with 6 mM l-glutamine (Gibco, 25030-081), 10% FBS (Sigma-Aldrich, F7524), 100 U ml−1 penicillin and 100 µg ml−1 streptomycin (Gibco, 15140-122) at 37 °C under 5% CO2.
For transfection, RPE-1 cells were grown on ibiTreat 2 Well µ-Sildes (Ibidi, 80286) to 50% confluency. Cells were then transfected using Lipofectamine 2000 (Invitrogen, 11668-019) and Opti-MEM reduced-serum media (Gibco, 31985-062) according to the manufacturer’s instructions. Transfected RPE-1 cells were fixed in 4% paraformaldehyde/PBS and sealed with Vectashield (Vector, H-1000) 20 h post-transfection for imaging.
For measurement of the practical brightness of free StayGold, mStayGold and mNeonGreen expressed in mammalian cells, the RPE-1 cells cultured on a µ-Slide 8 Well high (Ibidi, 80806) were imaged 30 h after transfection using a DeltaVision microscope system (Applied Precision) equipped with a CoolSNAP HQ2 camera (Photometrics). The images with the GFP filter set and 32% illumination were acquired by softWoRx software (v5.5.1) using a ×10 UPlanSApo lens (Olympus; numerical aperture (NA) 0.4, air) with 0.25 s exposure in a z-stack of 10 images with 1.5 µm spacing. Fluorescent cells were detected by a custom ImageJ/Fiji script using trainable Weka segmentation29. The mean fluorescence intensities of each cell above the background level were statistically analyzed by R version 4.3.1 (https://www.r-project.org/).
For comparison of photostability, images were acquired with a spinning disk confocal microscope (Andor Revolution XD imaging system, equipped with ×100 oil immersion 1.45 NA Nikon Plan Apo Lambda, and a confocal unit Yokogawa CSU-X1, Andor iXon Ultra 888 EMCCD camera and Andor IQ acquisition software). The cells were imaged with a 488 nm laser at 100% power (~7.4 W cm−2) at 0.5-s intervals. Fluorescence intensities were measured for the Rlc1 GFP, Rlc1 StayGold dimer and Rlc1 StayGold monomer at the cytokinetic ring (for S. pombe) and the entire cell (for RPE-1 cells) for each slice using the image processing software Fiji (https://imagej.net/software/fiji/). The datapoints were normalized to the first intensity measurement.
In vitro photostability
Photostability of pure proteins was measured using the method described in ref. 5. Photobleaching was quantified by embedding the fluorescent proteins into a polyacrylamide gel, which was polymerized between a 1.5 coverslip (Menzel, 12312128) and a glass slide. Other 1.5 coverslips were used as spacers. The final composition of the gel was 20% acrylamide (mono:bis 29:1), 150 mM NaCl and 20 mM Tris (pH 7.6). For laser illumination, the samples were observed using a CellR TIRFM system (Olympus) equipped with an iXon+ DU897 electron-multiplying CCD camera (Andor). The samples were illuminated with a 488 nm laser beam at a 0° angle of incidence. The power of light detected at a ×100 objective lens outlet was 2 mW, corresponding to illumination at 29 W cm−2 within a circular area with a radius of 46.5 µm. Similar experiments were performed under widefield illumination using a metal halide source.
Extinction coefficient determination
Absorbance was measured with a Cary 50 Conc UV Visible Spectrophotometer. Molar extinction coefficients (ε) were determined by standardizing the absorbance at the chromophore absorption maxima (488 nm for sfGFP or 496 nm for StayGold and its derivatives) either with the protein concentration5 or with the chromophore concentration1,30. For the protein concentration method, the theoretical molar extinction coefficient at 280 nm (ε280 theory) was calculated (https://web.expasy.org/protparam/) based on the protein sequence (minus one tyrosine). The molar extinction coefficient per protein (εprotein) was calculated by multiplying ε280 theory with the ratio of the measured absorbance values at 280 nm (A280) and the fluorophore absorption maxima (488 nm or 496 nm, Apeak).
The Apeak/A280 ratio was determined as the gradient of a Apeak versus A280 plot.
For the denatured-chromophore method, the absorbance at 447 nm after denaturation with 0.1 M NaOH (5 min for sfGFP and 1.5 min for StayGold and its derivatives, ANaOH) was measured as well as the absorbance at the absorption maxima under native conditions (488 nm for sfGFP or 496 nm for StayGold and its derivatives, Aneutral). The chromophore-based molar extinction coefficient (εchromophore) was then determined by multiplying the ratio of these measurements to the extinction coefficient of the isolated chromophore at 447 nm (εisolated chromophore = 44,000 M−1 cm−1) as described previously1.
$$_}}=_}}}\times _}}/_}}$$
Quantum yield measurements
The quantum yield of each fluorescent protein was determined by comparing the ratio between the absorbance at the peak excitation and the integrated fluorescence emission, with that of fluorescein in 0.1 M NaOH (ref. 5). We used a quantum yield of 0.79 for fluorescein31,32. The fluorescence/absorbance ratios were each determined using the gradient from a plot of integrated fluorescence versus absorbance with at least 4 points with an absorbance below 0.1.
Measurement of the pH sensitivity and apparent pK
a
Absorption measurements were made at the peak absorbance wavelength after diluting purified proteins into preprepared buffers containing either 150 mM NaCl, 50 mM NaH2PO4 and 50 mM citrate (pH 2.5–7.5) or 150 mM NaCl, 50 mM Tris, 50 mM glycine (pH 8–11). Absorption measurements were normalized to the value at pH 7, and the apparent pKa was estimated from the plot of normalized absorption versus pH.
Chromophore maturation
Oxidative maturation of the chromophore of StayGold was assessed by preparing the cell lysate containing StayGold expressed under a hypoxic condition and monitoring the increase of the absorbance at 496 nm by the matured chromophore under an aerobic condition18,33. The BL21(DE3) cells transformed with a pET-based vector encoding StayGold or a nonfluorescent protein as a control were cultured in 25 ml LB (Lysogeny Broth) with kanamycin to the log phase (A600 ~0.5) and induced for the recombinant protein expression with 0.2 mM IPTG for 4 h at 22 °C with good aeration (this improves expression under hypoxia in the following step). The cells were collected by centrifugation and resuspended with 12 ml of degassed LB with IPTG and kanamycin. The aliquots were transferred to cryotubes (~2.5 ml; Greiner). The tubes were filled to the brim, capped expelling the air and incubated at 22 °C with rotation at 200 r.p.m. for 16–30 h. Cells from a cryotube were lysed with 400 µl BugBuster Protein Extraction Reagent (Millipore) and centrifuged at 20,817g for 5 min. The 200 µl supernatant was incubated at room temperature (24 °C) in a disposal cuvette (UVette, Eppendorf) and the absorbance spectra were acquired in a time course. The gradual increase of the turbidity was observed independently of fluorescent protein, due to the increasing scattering, which is inversely proportional to the fourth power of wavelength (the Rayleigh scattering). The fraction due to scattering in the absorbance at the peak wavelength (496 nm) was estimated by extrapolating the absorbance from 525 nm to 575 nm, where the absorbance by the chromophore is minimum, and subtracted from the raw read at the peak. The peak absorbance after the correction for scattering, f(t), was plotted against time, t, and fitted with f(t) = β0 − β1 exp(−kt) to determine the rate of maturation, k, by nonlinear least squares fitting using the nls() function in R version 4.3.1 (https://www.r-project.org/).
OSER assays
OSER assays were performed as per the method discussed in ref. 12. Hela cells were transfected with one of the following four plasmids: CytERM-dTomato (Addgene, 98834), CytERM-mTurquoise2 (Addgene, 98833), pcDNA3-CytERM-StayGold or pcDNA3-CytERM-StayGold(E138D). The two StayGold plasmids were constructed by cloning G-blocks (Integrated DNA Technologies) into pcDNA3 using NEBuilder HiFi DNA Assembly Master Mix. For imaging, 20 h post-transfection, cell media was replaced with Leibovitz’s L-15 Medium (No Phenol Red). Images were acquired using Andor IQ3 software at either 69 nm per pixel with a Nikon Apo ×60/1.40 oil immersion objective lens or at 80 nm per pixel with a Nikon Plan Fluor ×40/1.30 oil immersion objective lens. The fluorophores were excited by laser lines at a wavelength of 405 nm (mTurquoise2), 488 nm (StayGold) or 561 nm (dTomato) as appropriate. Fixed cell images were acquired at room temperature, while live cell images were acquired at 37 °C. Z-stacks were obtained for each cell, followed by Z-projection in Fiji, and manual quantification was performed to count the number of cells with and without whorls.
Reporting summary
Further information on research design is available in the Nature Portfolio Reporting Summary linked to this article.


留言 (0)