
記住我


The UK Biobank is a prospective cohort study of over 500,000 participants aged 40–73 years recruited between 2006 and 2010 in 22 assessment centers throughout the UK. At baseline, participants completed a range of information via questionnaires and interviews and provided blood, urine and saliva samples for future analysis. The UK Biobank received ethics approval from the North West Multicenter Research Ethics Committee (reference no. 16/NW/0274). All participants provided written informed consent at recruitment. This research was conducted using the UK Biobank resource under application number 79302.
NAFLD at baseline is identified by the fatty liver index (FLI), which was first proposed in an Italian population and underwent external validation [17, 18]. FLI has an accuracy of 0.84 in detecting fatty liver, and FLI > 60 (positive likelihood ratio = 4.3) indicates the presence of fatty liver. The algorithm is expressed as follows:
$$FLI=\frac(Triglycerides)+0.139\times BMI+0.718\times \mathit\left( Gamma\ glutamyltransferase\right)+0.053\times Waist\ circumference-15.745}}^(Triglycerides)+0.139\times BMI+0.718\times \mathit\left( Gamma\ glutamyltransferase\right)+0.053\times Waist\ circumference-15.745}}\times 100$$
Assessment of exposureAs an enhancement to the baseline touchscreen brief FFQ, the Oxford WebQ, a web-based 24-h recall questionnaire, was added to the assessment centers from April 2009 to September 2010 [19]. Moreover, participants who provided a valid email address were invited via e-mail once every 3–4 months to complete the Oxford WebQ between February 2011 and June 2012 (online cycle 1, February 2011 to April 2011; online cycle 2, June 2011 to September 2011; online cycle 3, October 2011 to December 2011; online cycle 4, April 2012 to June 2012). Participants were asked about up to 206 types of foods and 32 types of drinks consumed during the previous 24 hours. Nutrient intakes in this study were calculated using the UK Nutrient Databank (UKNDB) Food Composition Table (2013) [20]. Fiber intake was estimated using the Englyst method [21]. The primary exposure variables were the percentages of total energy intake derived from the three components of carbohydrate [non-free sugars, free sugars, and starch]. Among them, non-free sugars intake was obtained by subtracting free sugars from total sugar. In addition, dietary fiber was displayed as the intake weight (gram). The definition of each component of carbohydrate is shown in Supplementary Table S1. Participants could in fill out the Oxford WebQ on up to five occasions, and we calculated mean values of intake from the available data. All estimated food nutrient data are displayed on the UK Biobank website (Category 100,117).
Ascertainment of outcomesThe outcomes in this study were incident ESLD and all-cause mortality. The date and cause of hospital admissions were identified through record linkage to Health Episode Statistics for participants from England and Wales and the Scottish Morbidity Records for participants from Scotland. Incident ESLD was defined as a hospital admission or death with ICD-10 (International Classification of Diseases, 10th revision) codes K74.6, K76.6, K76.7, I85.0, I85.9, I86.4, I98.2, I98.3, R18, Z94.4, and C22.0 (Supplementary Table S2). Another outcome of the current study was all-cause mortality. The date of death was obtained from death certificates held within the National Health Service Information Centre (England and Wales) and the National Health Service Central Register (Scotland). At the time of analysis, the updating dates of linkages to hospital inpatient admission and death registries were 30 September 2021 and 31 October 2021, respectively. Follow-up time in person-years was calculated from the beginning of follow-up (the date completed the last Oxford WebQ) until the date of ESLD diagnosis or death, whichever occurred earlier.
CovariatesParticipants completed several touchscreen computer-based questionnaires and then had a face-to-face interview with a trained researcher to provide information on demographic factors (age, sex, ethnicity, education level, and household income) and lifestyle factors (smoking), see Supplementary Table S3. The Townsend deprivation index is an integrated neighborhood-level measure of unemployment, non-car ownership, non-home ownership, and household overcrowding across the UK and was categorized into quintiles from the sample population, with the least deprived (quintile 1) to the most deprived (quintile 5). Sedentary behavior was defined as sedentary time > 4 hours (sum of self-reported hours spent watching TV and using the computer on a typical day). Hypertension was defined as systolic pressure ≥ 140 mmHg, diastolic pressure ≥ 90 mmHg, use of medications for blood pressure or self-reported or diagnosed by a doctor. Diabetes was defined as blood glucose ≥11.1 mmol/L, glycated hemoglobin (HbA1c) ≥48 mmol/mol, use of insulin or self-reported or diagnosed by a doctor. Alanine aminotransferase, triglycerides, and cholesterol levels were measured on a Beckman Coulter AU5800 chemistry analyzer by the UK Biobank. Total energy intake was estimated using the UK Nutrient Databank (UKNDB) Food Composition Table (described above).
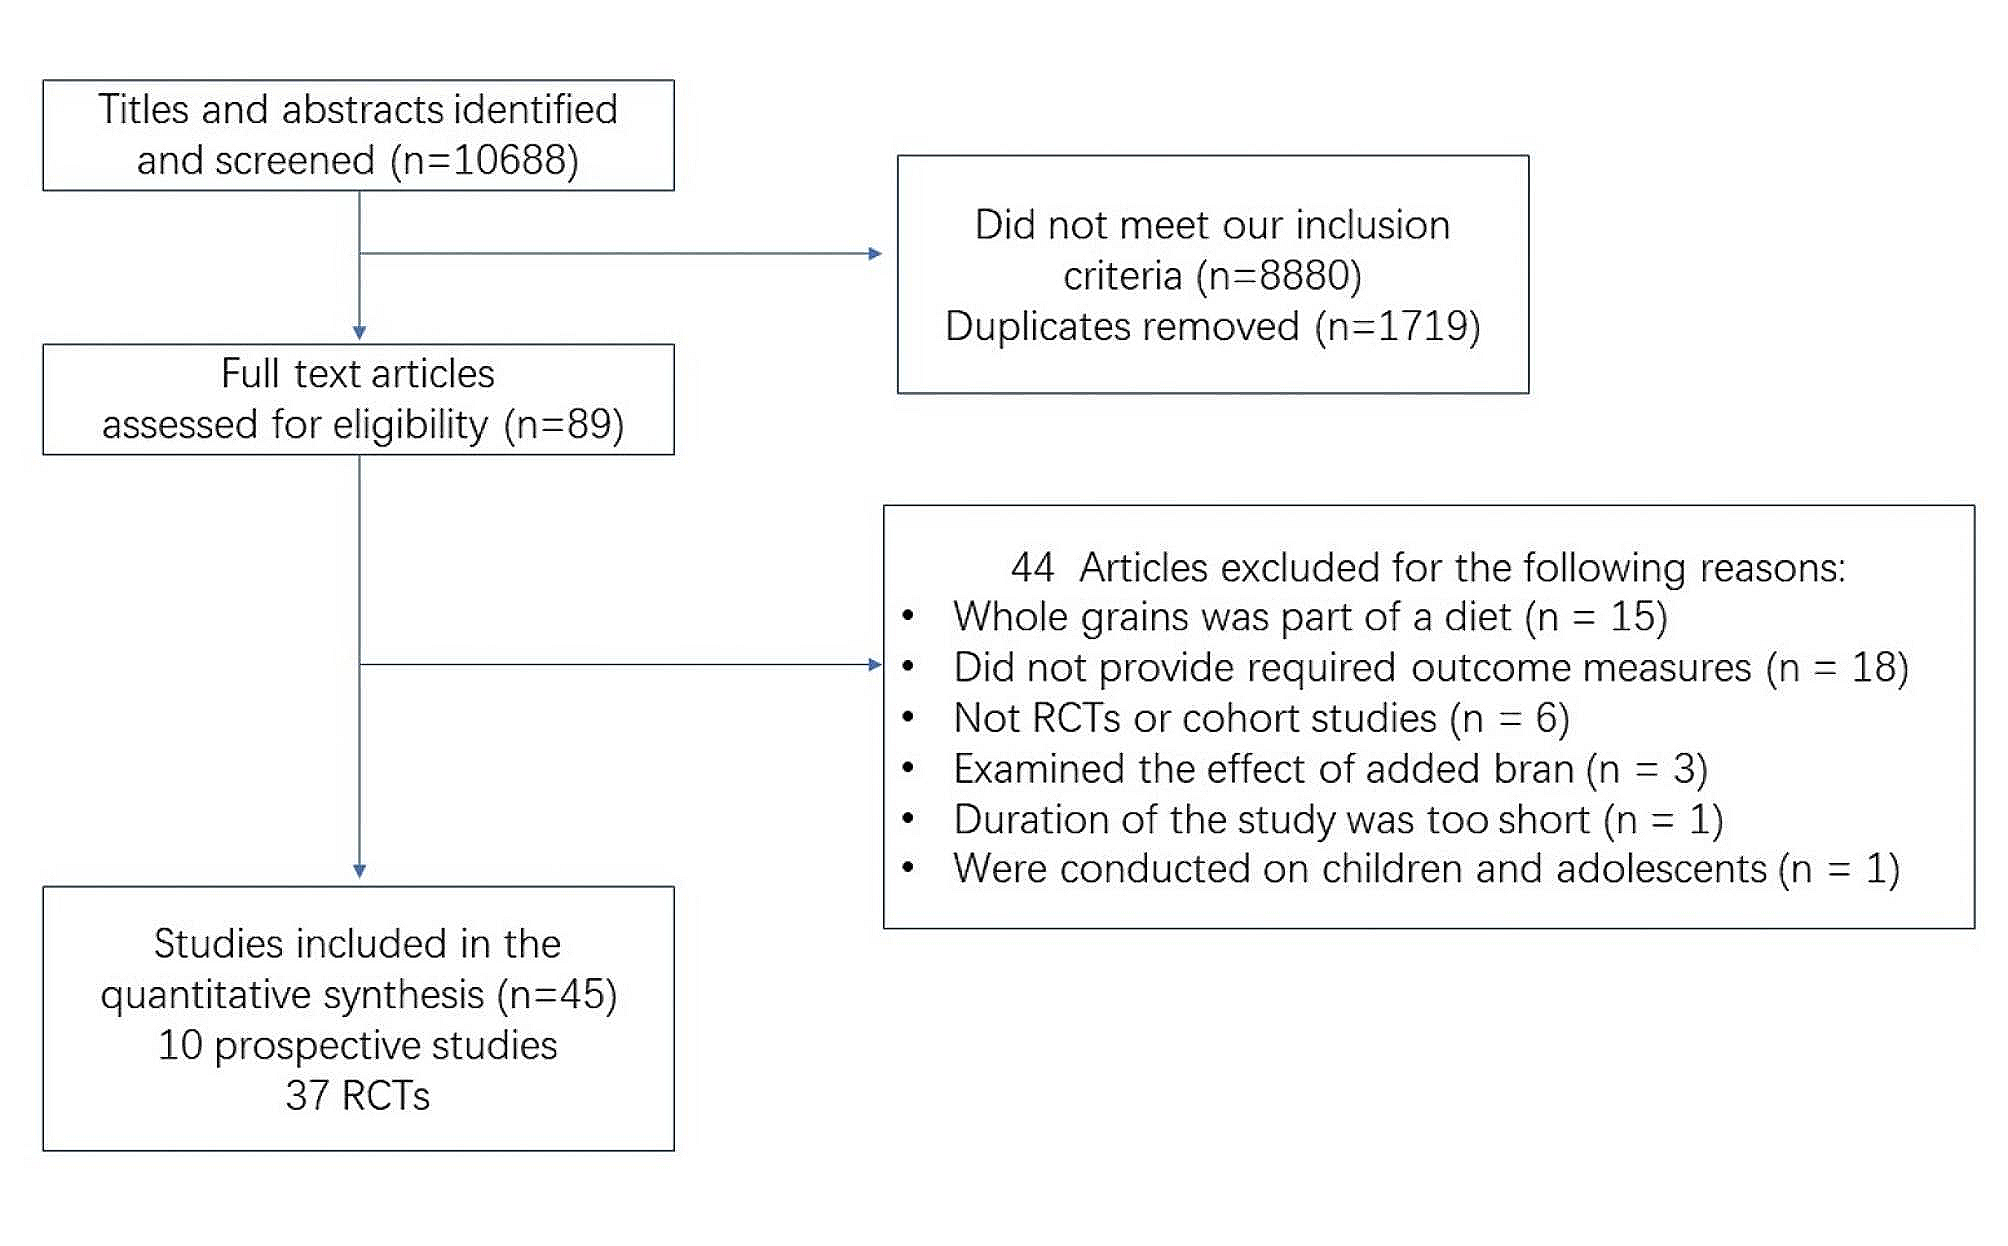
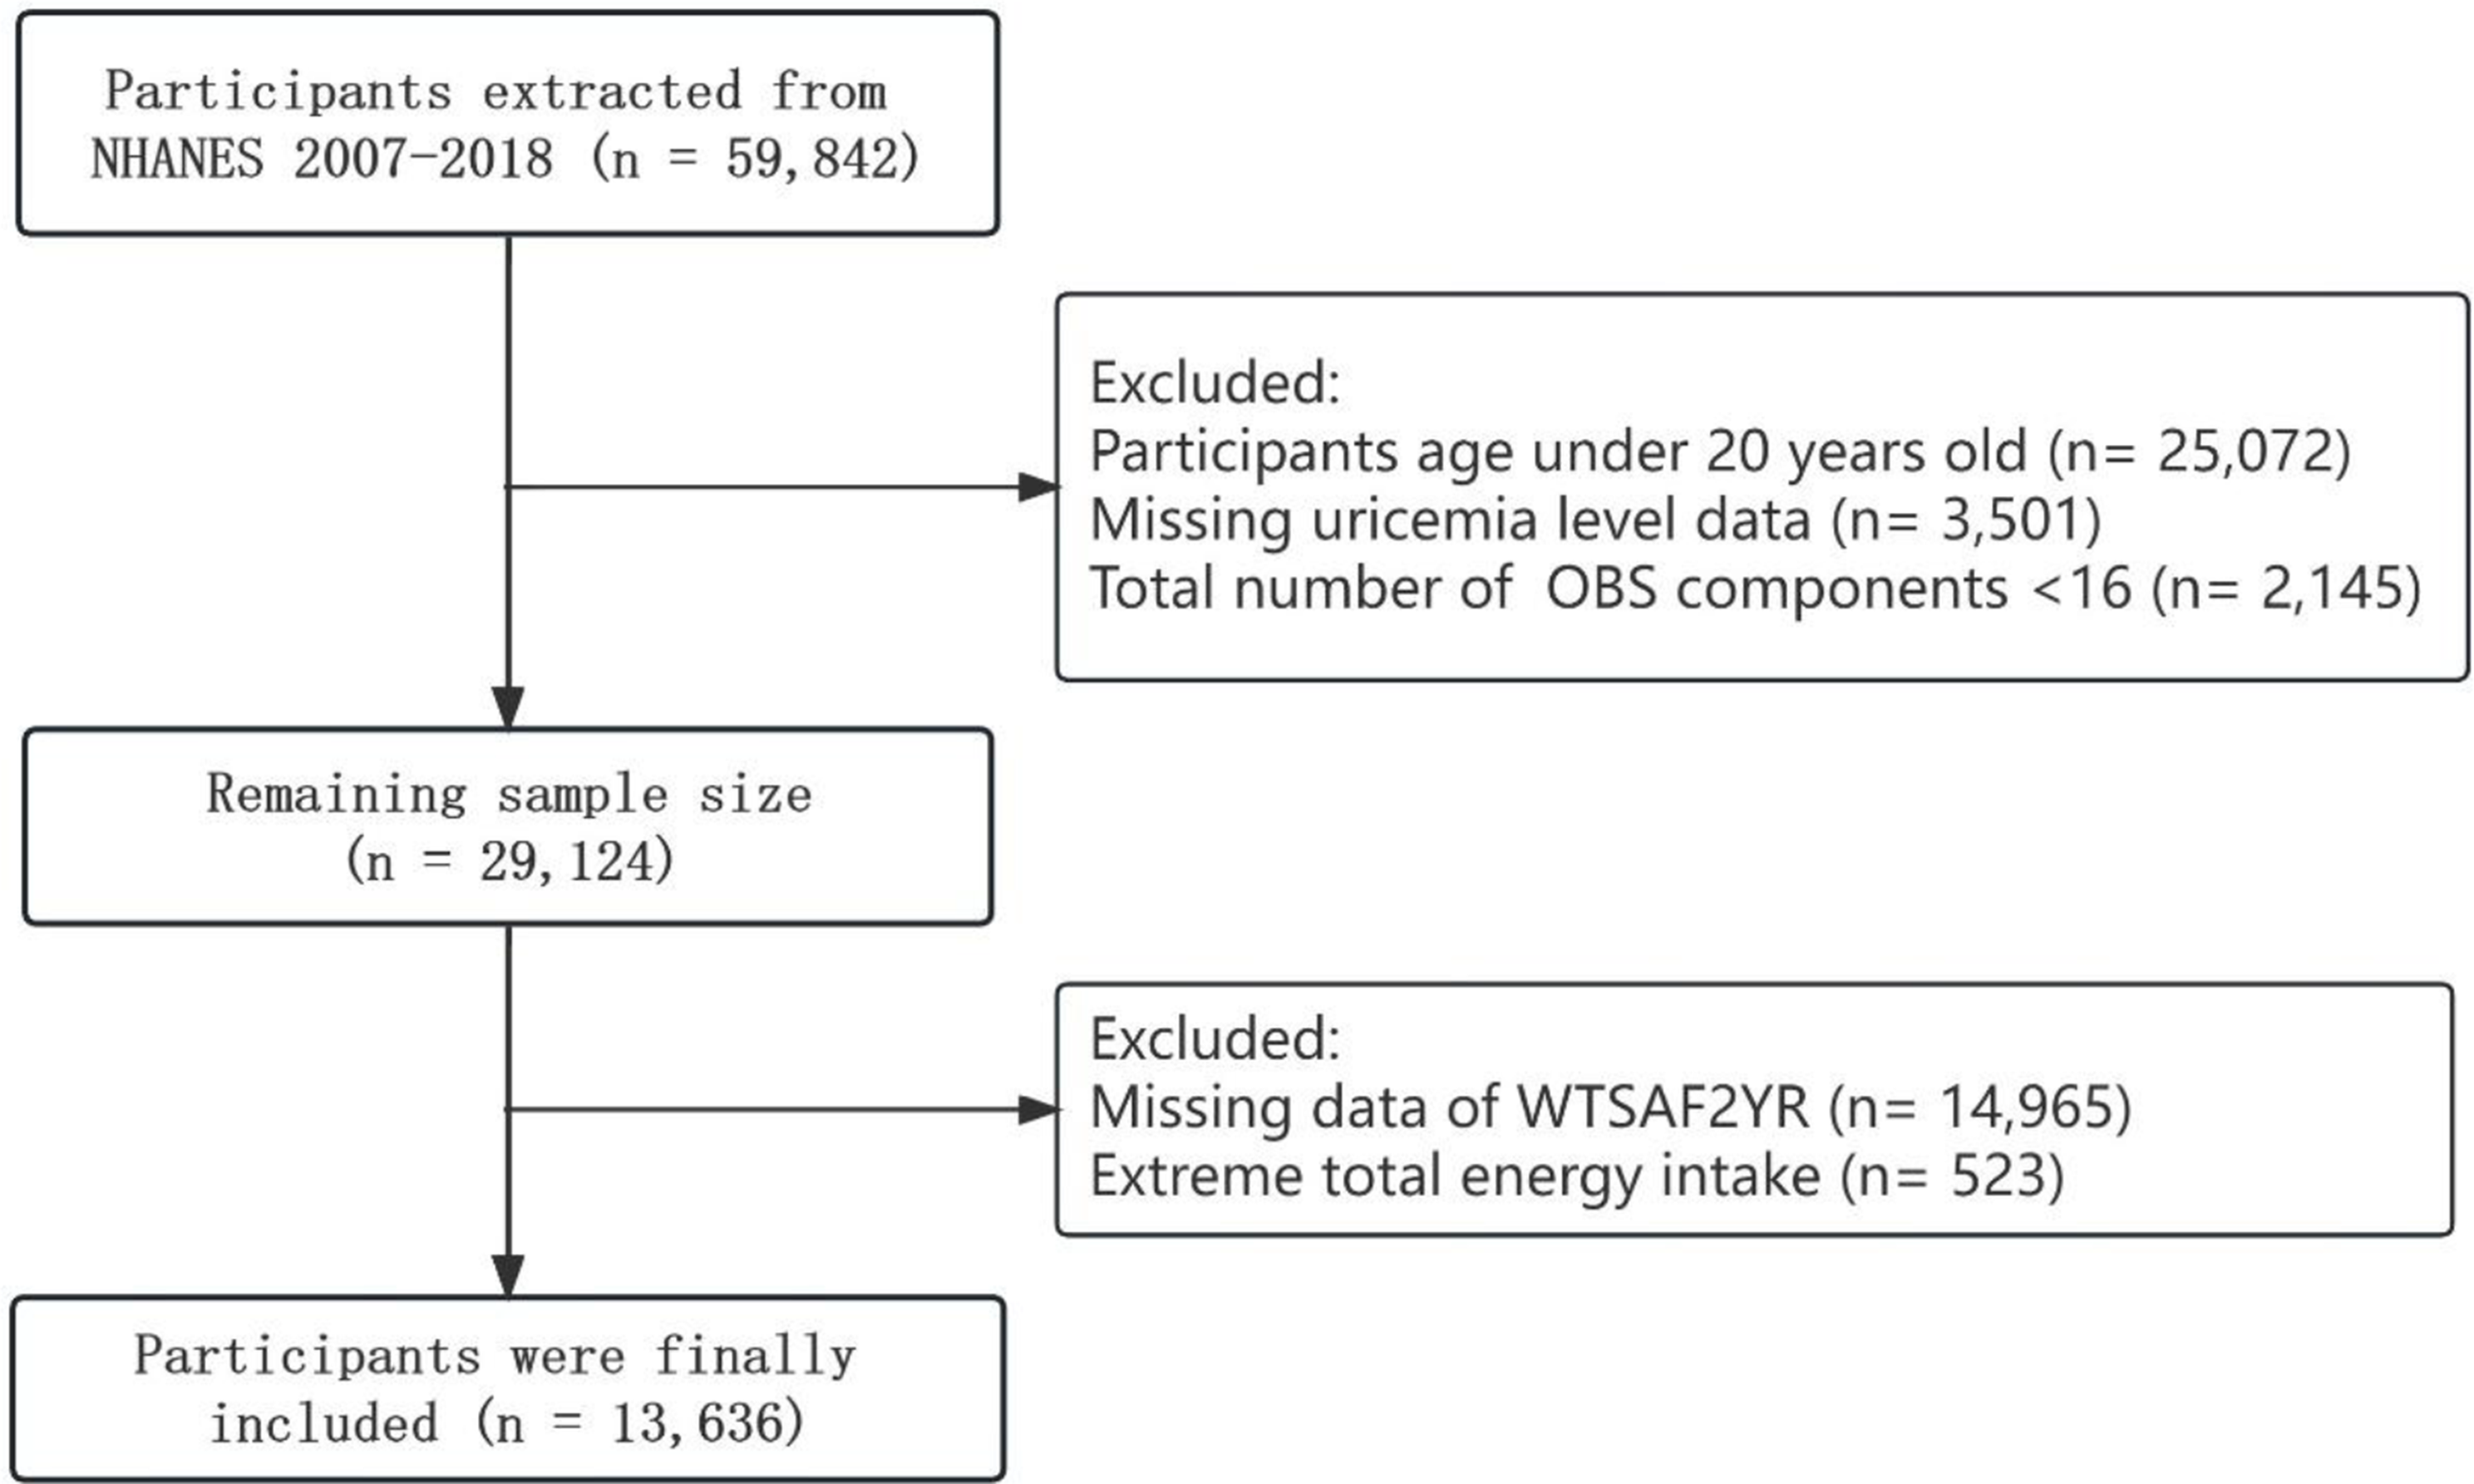
Statistical analysisThere were 210,967 participants who had information on diet. We then excluded patients with excessive alcohol consumption [22] (alcohol consumption ≥ 30 g/d for men and ≥ 20 g/d for women) and those with other liver diseases (viral hepatitis, Wilson’s disease, hemochromatosis, and autoimmune hepatitis); the remaining 48,513 participants (FLI > 60) were diagnosed with NAFLD. Furthermore, due to measurement error and the day-to-day variation, we only included those who completed at least two Oxford WebQ questionnaires (n = 26,729, Fig. 1), which had acceptable reproducibility.
Fig. 1
Flow chart of the study design and analytical strategy
Participants were equally divided into four categories according to the consumption of each component of carbohydrates. Categorical variables were displayed as percentages and tested by chi-squared tests. Continuous variables were displayed as the means with standard deviations (SDs) and tested by one-way ANOVA. In the analyses of incident ESLD, we used Fine and Gray competing risk models, with non-liver related mortality as the competing risk. The associations of individual components of carbohydrates with all-cause mortality were investigated using Cox proportional hazard models. Hazard ratios (HRs) and 95% confidence intervals (CIs) for each quartile of exposure were calculated, with the lowest quartile as the reference. Model 1 was adjusted for age, sex, ethnicity, Townsend deprivation index (quintiles), education level (university/college degree or others), household income (less than £18,000, £18,000 to £30,999, £31,000 to £51,999, £52,000 to £100,000, greater than £100,000, or do not know/prefer not to answer), self-reported smoking status (never, former or current smoker), sedentary behavior, body mass index, baseline diabetes, and baseline hypertension. Model 2 was adjusted for model 1 plus serum alanine aminotransferase, triglycerides, cholesterol levels, total carbohydrate intake and total energy intake. Estimates for linear trends were performed by assigning median values to corresponding categories of intake and modeling the values as continuous variables.
In order to estimate the effects of hypothetical substitution of 3% energy of free sugars with the equivalent amounts non-free sugars or starch, we built an isocaloric model by simultaneously including specific component intake (non-free sugars or starch, β1) and total intake (non-free sugars plus free sugars or starch plus free sugars, β2) in the same model, which also contained other covariates. In this model, the regression coefficient of non-free sugars or starch (β1) is interpreted as the theoretical effect of substituting free sugars with equivalent amounts of non-free sugars or starch because their sum (β2) is fixed [23]. Since dietary fiber does not provide energy, we explored the equivalent mass of free sugars with incident ESLD and all-cause mortality per substitution of 3 g fiber.
We further investigated whether these associations differed by age, sex, and other factors by performing subgroup analysis. P for interaction was tested by introducing a product term of the two variables examined in the regression models. In sensitivity analyses, we further excluded individuals with incident ESLD or who died within 2 years after baseline to avoid reverse causality. Furthermore, to test the robustness of the model, we also excluded those who had extreme BMIs (BMI < 15 or > 40 kg/m2), those who reported their previous day’s diet as not being typical and those who had extreme total energy intake (< 800 kcal or > 4500 kcal for men or < 500 kcal or > 3500 kcal for women). SAS 9.4 was used for all analyses. Two-sided P values below 0.05 were considered to be statistically significant.
留言 (0)