
Remember me
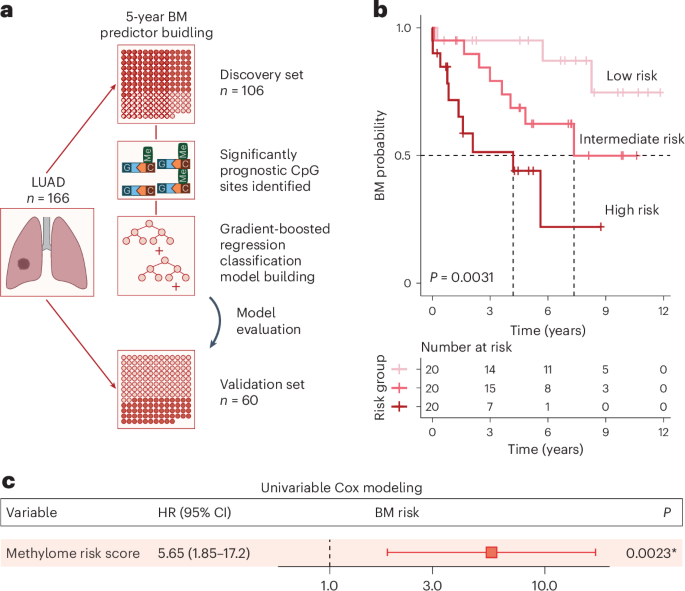

Samples of the cerebral cortex from eight patients with sporadic supratentorial CCM (cerebral cavernous malformation) (Supplementary Table 1), undergoing surgical resection of nonneoplastic cortical tissue adjacent to the single hemorrhagic CCM lesion within the temporal (Fig. 1a) or frontal (Fig. 1b) lobes were acquired by the shortest possible trajectory from the brain surface to the CCM lesion, as indicated in the preoperative magnetic resonance imaging (MRI) in Fig. 1b. The intraoperative imaging allowed real-time delineation of pathology-affected tissue (into regions 2–4) well demarcated from the surrounding normal tissue (region 1) by a zone of gliosis or a rim of hemosiderin owing to the hemorrhagic CCM activity (Fig. 1c).
Fig. 1: Progression of reactive gliosis with proximity to the CCM lesion.
a,b, Representative MR T2-weighted axial (a, left panel in b) and T1-weighted sagittal (right panel in b) images obtained in patients with a solitary CCM lesion (yellow arrows) in the temporal (a) or frontal lobe (b). Preoperative images (at higher magnification a′) show typical ‘popcorn’ appearance of single CCM. Postoperative follow-up MRI (a′ at higher magnification) without evidence of residual CCM confirms complete excision. White arrows (1–4 in b) point to the trajectory via which specimens were obtained. c, Intraoperative real-time image sequence showing the microscopic views of specimens sourced at corresponding position (1–4 in b). d, Representative images of GFAP immunoreactivity in regions 1–4. e,f, Note the manifestation of morphological changes in GFAP+ astrocytes (e) and IBA1+ microglia (f) with distance to the CCM core (as indicated by 1–4). Scale bars: 100 µm (d) and 20 µm (e and f).
In each case, resected specimens contained the regions of cerebral cortex gray matter (GM) and white matter (WM) (Extended Data Fig. 1). The histopathological tissue status in regions 1–4 differed with distance from the CCM core, visible by changes in astrocyte morphology and intensity of GFAP immunoreactivity, reflecting a gradual increase in astrocyte reactivity closer to the CCM (Fig. 1d,e). The superficial GM tissue (region 1 in Fig. 1b,c) contained protoplasmic astrocytes with a characteristic bushy morphology and highly branched fine processes without any sign of cellular hypertrophy (Fig. 1e, position 1). In the deeper (but still superficial) GM parenchyma (region 2, where no abnormalities of signal-intensity were observed by T2-weighted MRI, Fig. 1b) few clusters of hypertrophic astrocytes were detectable (Fig. 1e, position 2). Astrocytes within the affected cortical areas (regions 3 and 4) with a pronounced T2W-hypointensity surrounding the ‘reticulated’ CCM core displayed hypertrophic morphology with processes in a dense meshwork reflecting a progressive increase from moderate (Fig. 1e, position 3) to severe astrogliosis (Fig. 1e, position 4) with increasing proximity to the CCM. Also, the density of astrocytes was highest in areas abutting the lesion core. Similarly, microglia showed a gradually more activated amoeboid or rod-like morphology closer to the lesion (Fig. 1f). As this was observed in all specimens, they were trichotomized into areas of mild, moderate and severe gliosis based on the morphology of astrocytes and microglia, while the samples without any sign of glial hypertrophy were deemed as intact, nonaffected.
Cerebral cavernoma induces astrocyte proliferationTo examine the reactive astrocyte proliferation, GFAP-immunostaining was combined with the MIB1 antibody detecting the cell-cycle-associated protein Ki67 (ref. 16). In agreement with previous reports17, MIB1+ cells were virtually absent in the healthy cortical GM, and only very few were found in the intact WM (Fig. 2a). None of these sparse MIB1+ cells was GFAP+ (Fig. 2a), consistent with a quiescent state of astroglia in the intact human cerebral parenchyma. In contrast, the interindividual best-matched gliotic regions harbored a significantly higher number of parenchymal MIB1+ cells (0.7 ± 0.3 versus 12.8 ± 1.0 MIB1+ cells in the intact versus gliotic parenchyma, respectively; two-tailed P = 0.0056 from unpaired t test with Welch’s correction; n = 4 patients) (Fig. 2b–d). Many MIB1+ cells in the gliotic tissue were inside or surrounding blood vessels (BVs) (Fig. 2e), where proliferating endothelial cells, perivascular macrophages and/or inflammatory monocytes reside in context with the neurovascular abnormality in the CCM18. Among the parenchymal MIB1+ cells, GFAP+ cells reached more than a quarter of all proliferating cells in the moderate gliotic parenchyma (Fig. 2f), comprising 3% of astrocytes (Extended Data Fig. 2a,b). Notably, few MIB1+ reactive astrocytes were found at the border of the ruptured caverns, that is, in the severe gliotic region (Fig. 2d,f), where the entire MIB1+ cell population was substantially lower. Cyclin D1 (CCND1), that regulates progression through the restriction point at early G1 phase19, showed sparse expression in the intact cerebral parenchyma (Fig. 2g) but increasingly more immunostaining from mild (Fig. 2h) to severe gliosis (Fig. 2i–k) with particularly intensely labeled astrocytes in the moderate and severe gliotic parenchyma (Fig. 2i–k). There most CCND1+ hypertrophic astrocytes were GALECTIN3 (GAL3)+ (Fig. 2j,k), an inducer of CCND1 expression20. Thus, reactive astrocytes were MIB1+ and CCND1+ in the CCM affected regions, but close to the CCM core most cells were only CCND1+.
Fig. 2: CCM rupture induces the astrocyte proliferation depending on the distance to the lesion site.
a–e, Maximum intensity (a–e) and single optical projections (c′, d′ and d′′) show representative examples of MIB1+ (yellow arrowheads) and MIB1+GFAP+ (white arrowheads) cells in the intact cerebral parenchyma (a) and in the regions of mild (b), moderate (c) and severe (d) gliosis. Note the accumulation of MIB1+ cells in the perivascular space or inside BV (dashed white lines) within mild gliotic parenchyma (e). f, Pie charts shown the mean proportion of GFAP+MIB1+ cells among the total MIB1+ population in the intact and gliotic regions of cerebral cortex (n = 4 patients). Appearance of CCND1+GFAP− (yellow arrowheads) and CCND1+GFAP+ cells and processes (white arrowheads) within the upper cortical layers (g) and in regions of mild (h), moderate (i), moderate/severe (j) and severe (k) gliosis. Note that most CCND1+ astrocytes in moderate/severe gliotic area (j and k) are GAL3+ (white arrowheads). Orthogonal projections of the immunolabeled cells in c, d and k are shown in c′, d′ and d′′, and k′ and k′′, respectively. Scale bars: 50 µm (a–e and g–j), 25 µm (h′ and k).
GALECTIN3 marks proliferating astrocytes in cerebral cavernomaAs both GAL1 and GAL3 regulate astrocyte proliferation in rodents21,22, we immunostained samples for these Galectins. The intact cortex showed little staining (Fig. 3a), and the few GAL1+ and/or GAL3+ cells were located along BVs. Except for a few juxtavascular astrocytes in the GM and rare astrocytes in the WM (Fig. 3a,b), astrocytes were GAL3 negative. GAL1+ cells exclusively located in the mild or moderate gliotic regions (Fig. 3c–e), while GAL3+ cells covered all regions of gliotic tissue (Fig. 3c–e). Reactive astrocytes became increasingly stronger GAL3+ closer to the CCM bleeding (Fig. 3c′,d′). As in the injured murine GM21, GAL3 (but not GAL1) was co-localized with GFAP (Fig. 3c–e), including double-positive astrocytes forming pairs (Fig. 3f1) (0–1 GFAP+GAL3+ pairs mm−2), reminiscent of proliferating astrocytes in the post-traumatic murine21,23 or human cerebral cortex (Extended Data Fig. 2) that stay closely together after cell division. Thus, in both murine and human cerebral cortex, GAL3 can be used as a new marker of proliferative reactive astrogliosis.
Fig. 3: CCM induced astrocyte proliferation is accompanied by upregulation of GAL1/GAL3 and correlated with acquisition of NSC potential in vitro.
a–e, Representative images of GFAP, GAL1 and GAL3 immunolabeling of intact GM (a, a′), WM (b) and CCM-induced mild (c, c′), moderate (d, d′) and severe (e, e′) gliosis. Yellow arrowheads indicate examples of GAL1+ cells; white arrowheads indicate examples of GAL3+GFAP+ cells. f, Representative image showing GAL3 immunostaining in GFAP+ dividing astrocyte (1), perivascular cells and at BV surface (2–4) within the gliotic parenchyma. Yellow arrowheads indicate Gal3+, GFAP-negative cells and outline BV; white arrowheads indicate of GAL3+GFAP+ cells. g,h, Examples of neurospheres derived from the intact or gliotic tissue samples (g) and the quantification of primary (1°), secondary (2°) and tertiary (3°) neurospheres generated after 14 d.i.v. (h). Data are presented as median and interquartile range. Each dot represents one patient. Two-sided P values from Mann–Whitney test. i, Representative image of βIII tubulin, GFAP and O4 immunostaining of differentiated neurosphere. j,k, The frequency of neurosphere-forming cells in the intact, mild or moderate gliotic GM (j) and WM (k). Data are shown as median with interquartile range (n = 5 patients per data group). Adjusted P values from one-way ANOVA followed by Tukey’s multiple comparison test. l,m, Disease-dependent CSF effects on sphere-forming capacity in human cortical cells obtained from CCM patients (l) and quantitative evaluation of these effects on the percent of neurospheres formed from 10,000 cortical cells from patients with CCM or ICM (m). Data in m are presented as median with interquartile range. Each dot represents one patient. Adjusted P values from one-way ANOVA followed by Tukey’s multiple comparison test. n, Neurospheres generated in the presence of CSF-CCM exhibit an increased neurogenic capacity. The frequency of neurogenic/gliogenic versus only gliogenic neurospeheres (n = 4 patients per data group per diagnosis). Scale bars: 130 µm (c–e), 100 µm (a and b), 50 µm (g, i and l) and 25 µm (a′, c′–e′ and f).
Acquisition of NSC potential in cerebral cavernomaKi67 is high in fast-proliferating cells, while stem cells usually divide slowly and have undetectable Ki67 levels24. Probing which of these gliotic regions may contain cells with NSC potential, we cultured cells in neurosphere-forming conditions11,12. After 14 days in vitro (d.i.v.), cells from gliotic regions formed more than 10× higher number of neurospheres, while hardly any were detected in the cell cultures from intact cortical tissue (Fig. 3g,h). Neurosphere-forming cells were able to self-renew (Fig. 3h), reaching the same rate (35/10,000) as from the endogenous murine NSC niche12. They generated neurons, astrocytes and oligodendrocytes, when differentiated (Fig. 3i), thus fulfilling the NSC hallmark of multipotency. As neurosphere-formation of cells derived from the human WM had been previously reported25, we separated GM and WM in specimens from five patients before tissue dissociation and cultured cells derived from the GM and WM separately. After 14 d.i.v., the GM cells from regions of mild or moderate gliosis formed self-renewing neurospheres (Fig. 3j) in comparable numbers to WM-derived cells from analogous areas (Fig. 3k). In contrast, cells prepared from the nongliotic GM or WM tissue generated very few neurospheres, which did not expand in number after three passages (Fig. 3j,k). Taken together, CCM induces local NSC potential in the human brain parenchyma, with higher frequency of self-renewing neurosphere forming cells closer to the CCM core.
Intracranial meningioma elicits distinct astrocyte reactionGiven that noninvasive injuries fail to elicit astrocyte proliferation in mice12, we examined reactive astrogliosis in noninvasive benign intracranial meningioma (ICM). Tissue samples were obtained from four patients undergoing a total evacuation of the tumor mass directly attached to, but not infiltrated into the cerebral parenchyma. Similar to the CCM tissue samples, specimens obtained from patients with ICM contained fragments of nongliotic cerebral tissue as well as parenchyma with varying degree of gliosis due to the compression of adjacent tumor mass (Extended Data Fig. 3a,b). Despite profound gliosis in the tumor vicinity, there were very few MIB1+ and CCND1+ cells (Extended Data Fig. 3a–c). Consistent with previous observations26, GAL3 immunolabeling was restricted to leptomeningial cells surrounding the tumor mass (Extended Data Fig. 3d). Thus, ICM is not sufficient to elicit a proliferative response in astrocytes, as observed at the time of resection. Notably, cells dissociated from intact and gliotic cortical tissue from patients with ICM lacked neurosphere-forming capacity (Extended Data Fig. 3e,f). Thus, ICM stimulates neither the proliferation nor the dedifferentiation of reactive astrocytes, demonstrating the injury dependence of this phenotype.
Pathology-dependent effects of CSF on neurosphere formationBrain injury conditions affect the cerebrospinal fluid (CSF), and the CSF contains mitogenic signals12,15 that are necessary and sufficient to elicit reactive astrocyte proliferation and dedifferentiation in preclinical models12. Therefore, we collected subarachnoid CSF from patients with CCM (CSF-CCM) or ICM (CSF-ICM) to probe for effects on neurosphere formation. Intriguingly, the addition of CSF-CCM (100 μl ml−1) to neurosphere medium significantly increased neurosphere numbers and multipotency from either CCM-affected and unaffected areas of the same patients (Fig. 3l–n). Most strikingly, CSF-CCM, but not CSF-ICM, elicited significantly increased neurosphere formation also from cells of tissue samples resected during ICM evacuation (Fig. 3m). Moreover, the presence of CSF-CCM, but not CSF-ICM, further increased the proportion of multipotent neurospheres (typically generating 1–5% neurons), which was already higher in the cultures derived from the CCM-affected gliotic parenchyma than in those from patients with ICM (Fig. 3n). Together, these data suggested that the CSF of patients with CCM, but not patients with ICM, contains signaling molecules stimulating a NSC response.
Proteome analysis of CSF from patients with CCM or ICMTo identify similarities and differences in the proteomes of CSF-CCM and CSF-ICM, we used samples from five patients with CCM and three patients with ICM for quantitative label-free liquid chromatography–tandem mass spectrometry analysis identifying 860 proteins with ≥2 unique peptides and false discovery rate (FDR) <0.01 (Supplementary Table 2). Notably, the list of identified proteins closely aligns with existing human proteomics datasets of neural tissue from different regions of the central nervous system (CNS) and the ‘pooled footprint’ of CSF, but not peripheral blood (Extended Data Fig. 4). Moreover, ∼90% of proteins in our CSF samples overlap with published CSF datasets from healthy individuals27,28 (Extended Data Fig. 5a). The total number of detected proteins was similar within and between the two groups of CSF samples (coefficient of interindividual variation: CVCCM1.19%, CVICM4.50%, CVCCM-ICM4.27%) (Extended Data Fig. 5b,c). About half of the identified proteins (56%; 483/860) were present at comparable levels in all CSF samples (Fig. 4a and Supplementary Table 3). This common CSF proteome showed Gene Ontology (GO) terms related to maintenance of various homeostatic functions (Extended Data Fig. 5d–g). Conversely, 377 proteins were significantly (fold change (FC) ≥2, P ≤ 0.05) different between CSF-CCM and CSF-ICM (Fig. 4a) with most (315) enriched in CSF-CCM (Supplementary Table 4) and only 62 enriched in CSF-ICM (Supplementary Table 5). Several differentially expressed proteins were diagnosis-confirming or reflecting the disease manifestation, for example, proteins associated with bleeding in the brain29 (CPVL, ISLR2, NXPH, FAM20, MASP1 and C1QTNF; Fig. 4b), predicted biomarkers of symptomatic CCM hemorrhage30 (for example, MMP2, CD14, PLXDC2, SPARC and IL6ST) or astroglial proteins (for example, S100B, GFAP, CD44, ALDOC and APOE) known for fast release into circulation after the BBB rupture1,15 detected exclusively enriched in CSF-CCM (Fig. 4c and Supplementary Table 4). Conversely, around 30% of proteins enriched in CSF-ICM were implicated in meningioma development or progression31, including the most common disease-monitoring markers in patients with meningioma APOA1, APOB, A1BG, HP, APCS and PDGFRB (Fig. 4d and Supplementary Table 5). As these data provide confidence in the CSF proteome composition, we next explored protein signatures that may contribute to eliciting astrocyte proliferation and NSC potential.
Fig. 4: Disease-specific proteome profiles of subarachnoid CSF from patients with CCM or ICM.
a, Volcano plot showing mean log2FC and the corresponding −log10P values for 860 identified CSF proteins (n = 5 CSF-CCM, n = 3 CSF-ICM). Threshold of |−log10P| ≥1.3 and |log2FC| ≥1 was set to plot the statistically significant regulated proteins. Statistical significance from Bonferroni-corrected Welch t test of log transformed data. Proteins increased in CSF-CCM are highlighted in orange and those decreased in blue. b, Heatmap showing 28 proteins detected exclusively in CSF-CCM. c, NPE of astroglial markers in CSF-CCM and CSF-ICM. d, Levels of enrichment of 24 proteins implicated in meningioma development/progress. e,f, The top ten GO terms associated with significantly regulated proteins. g, NPE of significantly enriched CSF-CCM proteins regulating cell proliferation. h, Condensed interaction network of the top 45 most abundant significantly enriched (P ≤ 0.05, FC ≥ 3) proteins defining CSF-CCM signature (inner circle) with associated proteins (outer circles). LGALS3BP node in orange, LGALS3BP interactors in orange-delineated nodes. Colored lines denote the interaction type (Extended Data Fig. 6b–e and Source Data). i, NPE of LGALS3BP and its highly abundant interactors in CSF-CCM. j, PPI network of confirmed LGALS3BP interactions in Homo sapiens (STRING). Significantly upregulated CSF-CCM proteins in orange. k, NPE of in j highlighted LGALS3BP interactors. Data in c, g, i and k are presented as median ± 95% confidence intervals. Each dot represents one patient CSF sample (n = 3 patients with ICM and n = 5 patients with CCM). P values from unpaired t-test with Welch correction (FDR 1.00%). ECM, extracellular matrix; NPE, normalized protein expression.
Proliferation and stemness proteins only in the CSF-CCMInterestingly, GO term analysis revealed ‘developmental process’, ‘nervous system development’ or ‘neurogenesis’ as significantly overrepresented processes in the proteins enriched in CSF-CCM (Fig. 4e,f and Supplementary Table 6), including regulators of the FGF-dependent NSC proliferation32 (FGFR1, HSPG2, PTPRZ1, TNR, NCAM1, NCAM2, CDH2 and L1CAM) with up to two orders of magnitude higher expression levels in CSF-CCM than in CSF-ICM (Fig. 4g and Supplementary Table 4) or modulators of IGFs (IGFBP2, IGFBP6 and IGFBP7) regulating NSCs33 significantly enriched in CSF-CCM (Supplementary Table 4). Protein–protein interaction (PPI) revealed proteins involved in the regulation of cell proliferation central in a STRING network of the 158 most enriched CSF-CCM proteins with two major hubs driven by IGF signaling or FGF2 pathway proteins (Extended Data Fig. 6a).
Conversely, 62 proteins enriched in CSF-ICM were associated with regulation of immune response, inflammation and complement activation (Fig. 4e,f), reflecting the ‘immunity block’ in preoperative patients with ICM34 that is represented by neutrophil inflammation, changes of platelet-lymphocyte ratio (Supplementary Table 7), the specific upregulation of the alternative complement cascade components31 (C5, C8A, C8B, C8G, C6 and C9; Fig. 4d) and the PPI network CSF-ICM-enriched proteins (Extended Data Fig. 5h) demonstrating a ‘pro-inflammatory’ CSF-ICM profile. These data provide the first evidence for the CCM-induced enrichment of CSF proteins involved in neurodevelopmental processes distinguishing its proteomic signature from the one of CSF-ICM.
LGALS3BP as a novel biomarker of CCM in CSFNext, we examined the most abundant and significantly upregulated proteins (FC ≥3, P < 0.05) in all CSF-CCM samples. Most of the 45 proteins that met these criteria (Supplementary Table 9) were related to ‘extracellular space’ or ‘integral components of plasma membrane’ (Supplementary Table 10) and implicated in various diseases or pathological processes within and outside the nervous system (Gene Set to Diseases, GS2D) (Supplementary Table 11). Notably, most of these proteins have not been previously identified in CCM profiling studies, and hence represent potentially novel CSF markers of this disease. The 45 proteins defining the CSF-CCM signature form a molecular network (Fig. 4h and Extended Data Fig. 6b–e) related to nervous system development, neurogenesis, axogenesis and cell–cell adhesion according to the GeneMANIA Human Database (see top five network functions in Fig. 4h). Among proteins enriched for interactions regulating these processes and associated with known CCM markers, we found LGALS3BP (Lectin galactoside-binding soluble 3 binding protein), an important clinical tumor biomarker35. LGALS3BP-interacting proteins, for example, ROBO1, were thousand-fold enriched in CSF-CCM compared with CSF-ICM (Fig. 4i). Interestingly, LGALS3BP appears functionally associated with the known CCM markers across multiple genotypes and species30, for example, PLXDC2, CD14 and SPARC (Fig. 4h and Extended Data Fig. 6), which were also significantly enriched in CSF-CCM (Fig. 4i–k). SPARC is expressed in human reactive astrocytes and modulates growth factor signaling and proliferation36, suggesting LGALS3BP as promising candidate to exert the functional effects of CSF-CCM. In further support, a STRING network of experimentally validated LGALS3BP interactions (Fig. 4j) highlighted a central role of this protein in translating multiple extracellular signals (including integrin/laminin binding that is profoundly dysregulated in the CCM37) into intracellular mechanisms driving mitotic activity (see annotations in Fig. 4j) of which several were indeed highly enriched in CSF-CCM (Fig. 4k).
LGALS3BP in CSF-CCM promotes proliferation of human iPS cell-derived astrocytesTo examine LGALS3BP function, human induced pluripotent stem (hiPS) cells were differentiated in human induced astrocytes (hiAstros) for 60 days (Fig. 5a). hiAstros displayed many characteristics of astrocytes, including FGFR3 immunostaining (Fig. 5b), and most (∼90%) were quiescent, not incorporating 5′-ethynyl-2′-deoxyuridine (EdU) added for 7 days at day 60 of differentiation (Fig. 5a,c,d). In the presence of CSF-CCM, but not CSF-ICM, hiAstros EdU incorporation doubled (Fig. 5c,d). Of note, EdU+ hiAstros were also GAL3+ (Fig. 5e,f), and the frequency of GAL3+ hiAstros significantly increased by CSF-CCM (23 ± 1.7% versus 34 ± 3% in control versus CSF-CCM cultures; two-tailed P = 0.0083 from unpaired t test; n = 3). As this assay provided a readout for CSF-CCM on human astrocyte proliferation, we probed the functional role of LGALS3BP by adding MDP1959, a humanized version of anti-LGALS3BP antibody (from MediaPharma)38 that also detects LGALS3BP in reactive astrocytes of the hemorrhage-affected human cerebral parenchyma (Extended Data Fig. 7a–e) and in hiAstros (Extended Data Fig. 7f,g). Indeed, this antibody could block the effect of CSF-CCM on hiAstros proliferation (Fig. 5d,g).
Fig. 5: CSF-CCM promotes proliferation and NSC response in hiPS cell-derived astrocytes by LGALS3BP.
a, Schematic timeline of experimental paradigm. b, Representative micrographs showing immunostainings for the astrocyte marker S100B and FGFR3 in hiAstros. c, Disease-specific CSF effects on EdU-incorporation in hiAstros cell cultures. White arrowheads indicate examples of EdU+ hiAstros. d, The percentage of EdU+ hiAstros in different culture conditions. e,f, Representative images of immunostaining for EdU, GFAP/S100B and GAL3 of hiAstros in control (e) or CSF-containing cultures (f). Filled white arrowheads indicate GAL3+EdU+ cells; empty white arrowheads depict Gal3+EdU− astrocytes. g, Representative micrographs showing reduced hiAstros proliferation after exposure either to LGALS3BP-function blocking antibody MDP1959 alone or in combination with CSF-CCM. h,i, Phase-contrast images of primary neurospheres generated from hiAstros in control or CSF-containing cultures (h), and the percent of neurospheres formed from 10,000 hiAstros in these culture conditions (i). j, Self-renewal of neurospheres shown as number of neurospheres formed after passages (2° and 3°, secondary and tertiary neurospheres). k,l, The effects of rhLGALS3BP or MDP1959 treatment on neurosphere-forming capacity of hiAstros with example pictures (k) and quantification (l). Data in d, i, j and l are presented as median and interquartile range. Each dot represents one biological replicate per iPS cell line. Symbol indicates iPS cell line: #1 (empty), HMGU12 line (gray) and UKERi82a-R1-002 (black). Adjusted P value from Kruskal–Wallis test with Dunn’s for multiple comparisons test (in d and i), an ordinary one-way ANOVA followed by Holm–Šídák’s multiple comparisons test (in j), Brown–Forsythe ANOVA with Tukey’s multiple comparisons test (in l). hiGP, human induced glial progenitor. Scale bars: 50 µm (h and k), 25 µm (c, e, f and g) and 15 µm (b).
LGALS3BP in CSF-CCM promotes neurosphere formationNext, we used the neurosphere formation of hiAstros as a readout. CSF-CCM, but not CSF-ICM, significantly increased formation of self-renewing neurospheres (Fig.
Comments (0)