

Remember me


The continuous advancement in detection technology has resulted in an ongoing rise in the rate of thyroid carcinoma (THCA) detection. Compared to other types of endocrine malignancies, THCA holds the highest prevalence, experiencing an annual increase in its incidence (1). Surgical resection is the primary treatment modality for THCA. Post-surgery, the decision to perform neck lymph node dissection or radioactive iodine therapy should be based on the patient’s condition and pathological type. Additional treatment modalities include radioisotope therapy, endocrine inhibition therapy, and external beam radiation therapy (mainly used for anaplastic thyroid cancer), among others. Despite typically displaying an indolent nature and promising overall prognosis, THCA has a significant potential to exhibit an invasive phenotype and in some cases may metastasize (2). Recent reports indicate an approximate 38.5%~58.8% rate of lymph node metastasis (LNM) in THCA (3). Moreover, cervical LNM may occur at the early stages of disease progression (4). The presence of LNM serves as a key indicator for prognosis and treatment options in individuals afflicted with THCA (5). In cases where LNM is detected, a comprehensive approach incorporating radical surgery with lymph node dissection is deemed necessary (6). Furthermore, the implementation of iodine-131 treatment may also be considered based on specific indications (7). LNM constitutes an important prognostic determinant, exhibiting a close association with both tumor recurrence and unfavorable prognostic outcomes among individuals afflicted with THCA (8). Additionally, performing neck lymph node dissection due to suspected cervical lymph node metastasis can potentially lead to damage to glands and nerves, such as the internal jugular vein, submandibular gland, brachial plexus, and accessory nerve. This can also result in adverse postoperative outcomes for the patients (9). Hence, gaining clarity regarding the occurrence or inclination towards lymph node metastasis in instances of THCA would facilitate the development of a more scientifically-informed treatment plan, enable regular assessment of patient prognosis, prompt timely treatment adjustments, and ultimately enhance patient prognosis.
In the case of THCA, several known risk factors have been linked to LNM, such as patient age, sex, multifocality, calcification, and extrathyroidal extension (ETE) (5, 10–12). In addition to established clinical factors, there has been a burgeoning interest in exploring genetic variations associated with LNM in recent years (13, 14). For example, experimental evidence from both in vitro and in vivo studies has demonstrated that the upregulation of lnc-MPEG1-1:1 in papillary thyroid cancer (PTC) cell lines can elevate cell proliferation and migration (15). Moreover, this long non-coding RNA (lncRNA) is observed to be overexpressed in the cytoplasm of PTC cells and has been shown to exert its function by acting as a competitive endogenous RNA (ceRNA), competitively sequestering the shared binding sequences of miR-766-5p (15). In addition, researchers have reported that primary patients with positive lymph node status tend to exhibit relatively advanced TI-RADS levels and higher prevalence of the RET genetic alteration (16). Therefore, a comprehensive understanding and analysis of genomic alterations in THCA with LNM are necessary to advance the current knowledge of the underlying pathophysiology involved in the development and predisposition to LNM. Such enhanced understanding could potentially pave the way for the development of improved resources and novel strategies for the prevention and treatment of LNM (17, 18).
Endocrine-disrupting chemicals (EDCs) are exogenous compounds found in the environment that can emulate or impair the functioning of endogenous hormones (19, 20). EDCs have the ability to interfere with reproductive, neuroendocrine, cardiovascular, and metabolic function, resulting in compromised health outcomes (20). The extensive impact of EDCs on the progression and metastasis of tumors of endocrine organs has been widely documented. According to a recent study report, bisphenol A (BPA), a kind of EDCs, has a promotional effect on breast ductal carcinoma in situ (DCIS) cell proliferation and migration, as well as macrophage migration (21). When exposed to an orally-administered, environmentally human-relevant low dose of 2.5 μg/l BPA for 70 days through drinking water in a DCIS xenograft model, primary tumor growth rate was promoted approximately 2-fold and lymph node metastasis was significantly increased, along with a notable enhancement of CD206+ M2 macrophage polarization, indicating a protumorigenic response. These findings reveal the role of BPA as an accelerator in advancing DCIS progression into invasive breast cancer by influencing DCIS cellular activity and macrophage polarization toward a cancer-supporting phenotype (21). Moreover, Tamoxifen, being an EDC, is widely used as a hormone therapy in postmenopausal women with breast cancer who are ER+ and is regarded as one of the most effective adjuvant breast cancer treatments available (22). Its effectiveness in controlling breast cancer recurrence and metastasis has been extensively reported. Previous studies have revealed the potential role of EDCs in THCA. Existing literature has revealed that exposure to certain congeners of flame retardants, polychlorinated biphenyls (PCBs), phthalates, and specific isomers of pesticides can lead to an increased risk of thyroid cancer (23). Exposure to Bisphenol A (BPA) has been associated with an increased risk of thyroid nodules in Chinese women (24). Additionally, animal experiments have demonstrated a correlation between BPA exposure and the risk of thyroid cancer (25). Despite THCA being the most frequent type of endocrine tumor, there has not been widespread research into the impact of EDCs on the LNM of THCA. Therefore, utilizing bioinformatics to investigate EDCs relevant to LNM in THCA is advantageous for further screening of potential therapeutic drugs and improving patient prognosis.
In light of the recent progress in high-throughput sequencing technology, the integration of multiple omics analysis has gained widespread utilization in tumor research (26–28). The high-throughput sequencing technology is capable of exploring tumor biomarkers, evaluating therapeutic responsiveness, and providing convenience for the development of clinical management plans among tumor patients (29–32). Therefore, the aim of this study is to comprehensively investigate the key genetic variations and EDCs relevant to LNM in THCA using multiple bioinformatics techniques. Additionally, we aim to screen for potential therapeutic drugs and corresponding treatment targets capable of inhibiting the incidence of LNM in THCA.
Materials and methodsData acquisitionThe clinical data, RNA-seq data, 450K methylation data, and copy number variation (CNV) data pertaining to the THCA (THCA) cohort were extracted from the GDC database (https://portal.gdc.cancer.gov/projects/TCGA-THCA) (33). A total of 510 THCA specimens, along with 58 normal specimens, were identified in the TCGA-THCA cohort. After obtaining the RNA-seq FPKM dataset, we proceeded to transform the expression profile into transcripts per kilobase million (TPM). The GSE60542 cohort, comprising 33 primary thyroid tumor samples, 23 metastatic lymph nodes, 30 normal thyroid samples, and 4 normal lymph node samples, was extracted from the Gene Expression Omnibus (GEO) database (http://www.ncbi.nlm.nih.gov/geo/), and it served as the validation cohort (34).
Gene Expression Profiling Interactive Analysis (GEPIA) database was used to obtain the differentially expressed genes (DEGs) between THCA and normal tissues (35). The criterion for screening DEGs is that the |Log2FC|>1 and q-value<0.05. The DEGs were also plotted as chromosomal distribution via GEPIA database.
Identification of the potential for tumors to undergo lymph node metastasisOur study introduces a novel concept called ‘LNM potential. ‘ In cases where a thyroid cancer patient experiences LNM with a small primary tumor volume, they are considered to have a high LNM potential. Conversely, if a thyroid cancer patient does not experience LNM despite having a larger primary tumor volume, they are considered to have a low LNM potential. In the TCGA-THCA cohort, patients with a tumor size exceeding the median but without LNM were classified as having low LNM potential (LNM Low), while patients with a tumor size below the median but with LNM were classified as having high LNM potential (LNM High).
Weighted correlation network analysisThe transcriptional profiles of the DEGs obtained from GEPIA database were used as the input file for the R package “WGCNA” to establish the co-expression networks (36). WGCNA was performed with the default-recommended parameters. To distinguish modules with different expression patterns, a soft threshold power obtained from “pickSoftThreshold” algorithm was used for creating co-expression networks. The minimum module size was set to 30, and the dissimilarity threshold for module merging was set to 0.25. Pearsons correlation analysis were carried out to estimate correlation between Module eigengenes (MEs) and clinical traits and then the module with the highest and lowest pearsons coefficient was identified as the module most relevant to clinical traits.
Identification of the hub genesThe online database STRING was employed to formulate the Protein-Protein Interaction (PPI) Network for all the genes in the module most relevant to clinical traits (37). Default setting was used in STRING database. The visual representation of the PPI network was accomplished through the Cytoscape tool (Version 3.7.2). The CytoNCA plugin, integrated with the Cytoscape tool, was utilized for determining the topological features and degree centralities of each node (protein) within the PPI network (38). Subsequently, the hub genes was singled out and delineated as the prominent node of the PPI network, crucial for mediating protein-protein interactions.
The hub gene-miRNA, Transcription factor (TF)-hub gene and TF-miRNA interactions was established using NetworkAnalyst online tool based on ENCODE database (http://www.encodeproject.org/ENCODE/), miRTarBase (v8.0; http://mirtarbase.mbc.nctu.edu/) and Regulatory Network Repository (https://regnetworkweb.org/) (39–42).
Pathway enrichment analysis and immune infiltration analysisConducting pathway and process enrichment analyses was accomplished through employment of the Metascape platform (43) (Metascape, http://metascape.org). By following the default settings, the Metascape tool facilitated hierarchical clustering to segregate enrichment terms into unique clusters, with the representative term being selected based on minimal p-value criteria.
In order to ascertain the relative enrichment of a gene set in the given sample population, gene set variance analysis (GSVA) was implemented (44). The higher scores indicate a relatively greater activation of the gene set in the given sample. In this study, 10 cancer-associated pathways’ activity scores were computed for 7876 samples collected from 32 cancer types using the Reverse Phase Protein Array (RPPA) data derived from the TCPA database and the TCGA database (45). The pathways examined in this study are TSC/mTOR, RTK (receptor tyrosine kinase), RAS/MAPK, PI3K/AKT, Hormone ER, Hormone AR, EMT (epithelial-mesenchymal transition), DNA Damage Response, Cell Cycle, and Apoptosis pathways, all of which are well-known pathways associated with cancer. RPPA is a high-throughput antibody-based technology that involves procedures analogous to those of Western blots (46). In this technique, the proteins are extracted from cancerous tissue or cultured cells, denatured with SDS, and then immobilized on nitrocellulose-coated slides. Next, an antibody probe is used for analysis. Utilizing the Gene Set Cancer Analysis (GSCA) tool, the aforementioned analytical process was carried out to compute a pathway activity score (PAS) that effectively represents activation levels of the respective signaling pathway (47).
Immune Cell Abundance Identifier (ImmuCellAI) database was utilized to evaluate immune cell infiltration in each sample of TCGA-THCA cohort (48). The aforementioned tool was developed to assess the abundance of 24 immune cells within a given gene expression dataset, including RNA-Seq and microarray data. The 24 immune cells encompass 18 T-cell subtypes, as well as an additional six immune cells, specifically, B cells, NK cells, monocytes, macrophages, neutrophils, and DC cells.
Recognition of molecular subtypesUnsupervised hierarchical clustering of the hub genes was established by R package “ConsensusClusterPlus” to identify the different molecular subtypes in TCGA-THCA cohort (49). ConsensusClusterPlus was executed with default settings for all parameters, with the maximum evaluated ‘k’ (max K) restricted to 10. The optimal number of clusters (‘k’) was determined using the Consensus Cumulative Distribution Function (CDF) Plot. Visualization of the expression patterns of hub genes across different molecular subtypes was performed using the R package ‘pheatmap,’ with a heatmap-type display.
Machine learning frameworkIn the TCGA-THCA cohort, a comprehensive analysis was conducted to identify key gene from the hub genes of PPI network utilizing the Least Absolute Shrinkage and Selection Operator (LASSO), Support Vector Machine (SVM), and the Random Forest (RF) algorithms available in the “glmnet”, “e1071”, and “randomForest” R packages, respectively (50–55). The application of these machine learning techniques enabled the effective screening of genes with potential diagnostic significance in the context of the studied cohort.
In order to perform LASSO algorithmic analysis, a set of specific parameters were established, including the family parameter, set to “binomial”, alpha parameter which was set to 1, type measure parameter defined as “deviance”, as well as the nfolds parameter set to 10 (31). For the construction of a forest of 500 trees, the “randomForest” package within R was effectively utilized through standard settings (29). Additionally, feature importance scores were calculated through the application of the “importance” function, which was performed through the utilization of the “randomForest” package in R. Following the implementation of randomForest algorithms, genes exhibiting an importance value exceeding the median were selected and subjected to downstream analysis. The SVM method ran using the default parameters. Through cross-referencing the results generated by the three methodologies, an intersectional subset was identified as the key gene set (30).
Comparative toxicogenomics databaseThe publicly accessible CTD database (http://ctdbase.org/) is a comprehensive repository of toxicogenomic data, offering reliable and meticulously scrutinized information regarding gene/protein interactions with chemicals across an extensive range of peer-reviewed scientific literature (56). This trustworthy and vigorous database serves as a valuable platform for researchers seeking to access critical toxicogenomic information. Against the backdrop of default parameters, the CTD database is utilized to explore the potency of EDCs, antineoplastic drugs, and environmental toxins in their ability to incite changes in key gene expression within all species. Dependable EDCs were sourced from previously published literature (19).
Discovery of potential drugs by computational methodsDrug sensitivity of anticancer drugs was estimated in each tumor specimen of TCGA-THCA by R package “oncoPredict” (57). Ridge regression was performed by “oncoPredict” algorithm and all above prediction was performed based on the Genomics of Drug Sensitivity in Cancer (GDSC) database (58).
Molecular docking procedureTo obtain the crystal structures of proteins encoded by the hub gene, the RCSB Protein Data Bank (PDB) (www.rcsb.org/pdb/home/home.do) was accessed, while the 3D structures of the drugs were downloaded from PubChem (https://www.ncbi.nlm.nih.gov/pccompound) (59, 60). The molecular docking process was conducted using mcule 1-click Docking server online (https://mcule.com/apps/1-click-docking/) (61). The best pose was selected based on the docking score and the rationality of the molecular conformation.
Exploration of protein expression level and subcellular localization of the key geneThe Human Protein Atlas (HPA) database (https://www.proteinatlas.org/), a comprehensive collection of human proteins in normal and tumor cells and tissues, integrates multiple cutting-edge omics technologies, including immunohistochemistry (IHC) and immunofluorescence (IF) (62). We employed the HPA online tool to investigate protein expression profiles of specific genes in both normal and tumor tissues, utilizing the immunohistochemistry data available in the HPA database.
Using the subcellular domain of the HPA database, we gained a high-resolution understanding of the spatiotemporal distribution and expression of proteins. Subcellular protein localization was investigated through immunofluorescence (ICC-IF) and confocal microscopy, involving up to three distinct cell lines. Based on image analysis, protein subcellular localization was systematically categorized into distinct organelles and intricately detailed subcellular structures.
Real time quantitative PCR and IHCTotal RNA extraction was performed utilizing TRIzol reagent (Ambion, USA), followed by conversion of the extracted mRNA to cDNA using PrimeScript™ RT Master Mix (Takara, Japan). The gene transcripts were quantified through RT-qPCR assay utilizing ChamQ SYBR qPCR Master Mix (Vazyme, China). The 2-ΔΔCT method was used to evaluate the relative expression levels of the genes, with GAPDH serving as the internal reference. To detect ERBB3 and GAPDH expression levels, the forward primer of ERBB3 was 5′-GCAGATCAGTGTGTAGCGTG-3′, and the reverse primer of ERBB3 was 5′-CGTGTGCAGTTGAAGTGACA-3′; while the forward primer of GAPDH was 5′-TGTTCGTCATGGGTGTGAAC-3′ and the reverse primer of GAPDH was 5′-ATGGCATGGACTGTGGTCAT-3′. The experiment was repeated thrice for establishing the average. Gene expression was detected utilizing the RT-qPCR method.
The tumors were fixed in 4% paraformaldehyde and embedded in paraffin. Subsequently, 4 μm sections were obtained from the paraffin-embedded samples and fixed on glass slides. Epitope retrieval of the sections was performed in 10 mmol/L citric acid buffer at pH7.2, heated in a microwave. Following epitope retrieval, the slides were incubated at 4°C overnight with the primary antibody (rabbit anti-ERBB3, dilution 1:100, K113334P, Solarbio; Beijing, CN), followed by HRP-conjugated secondary antibody for 1 h at room temperature. The detection of antibodies was done using the substrate diaminobenzidine (DAB, Beyotime), and slides were counterstained with hematoxylin (Beyotime). For statistical analysis, Average Optical Density (AOD) was used as a scoring method. AOD measurements were executed by professional pathologists using the ImageJ software, and at least three measurements were taken per IHC sample to establish the mean AOD values.
The study utilized samples from 9 THCA patients without LNM and 11 patients with LNM from The Third Affiliated Hospital of Anhui Medical University. The samples were employed for RT-qPCR and IHC analyses. All patients involved in the study provided informed consent prior to their inclusion in the study.
Statistical analysesFor statistical analysis, we employed R software (version 4.2.1). To compare continuous variables, the Wilcoxon/Kruskal-Wallis Test was utilized, whereas differences in proportion were assessed by the Chi-Square test. A p-value of less than 0.05 was regarded as statistically significant. For evaluation of diagnostic performance, the Receiver Operating Characteristic (ROC) curve was employed. Correlations were analyzed using Spearman’s correlation. T-Distribution Stochastic Neighbor Embedding (t-SNE), uniform manifold approximation and projection (UMAP), and principal component analysis (PCA) were employed for dimensionality reduction (63–65).
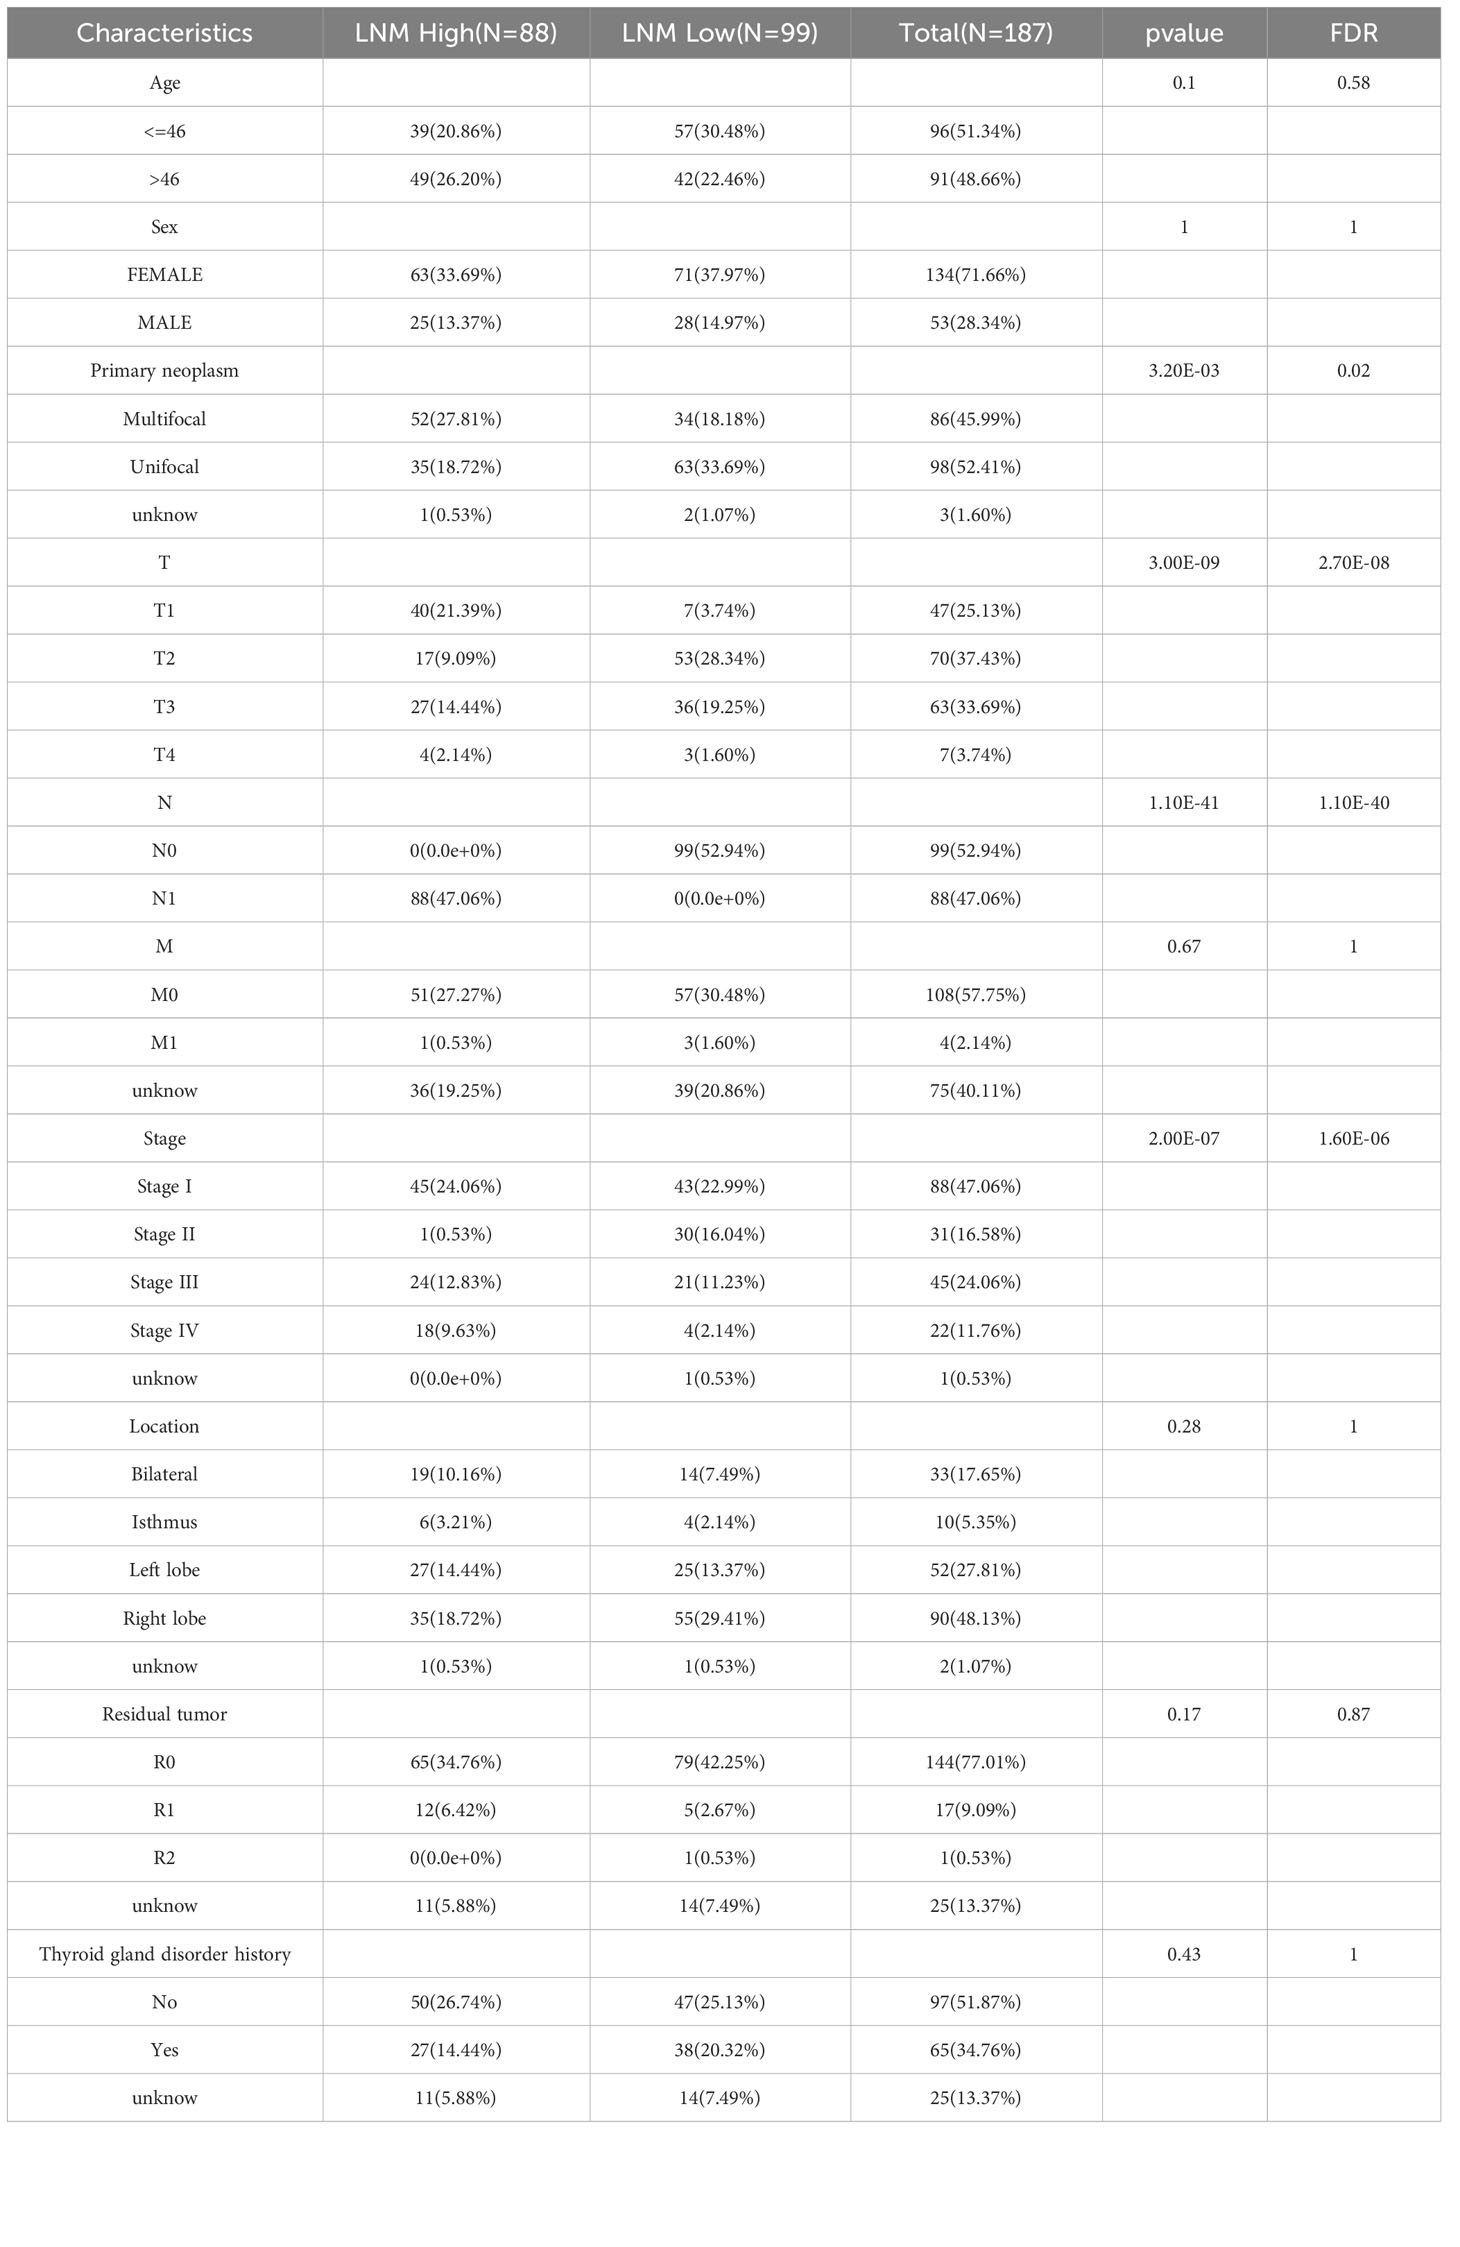
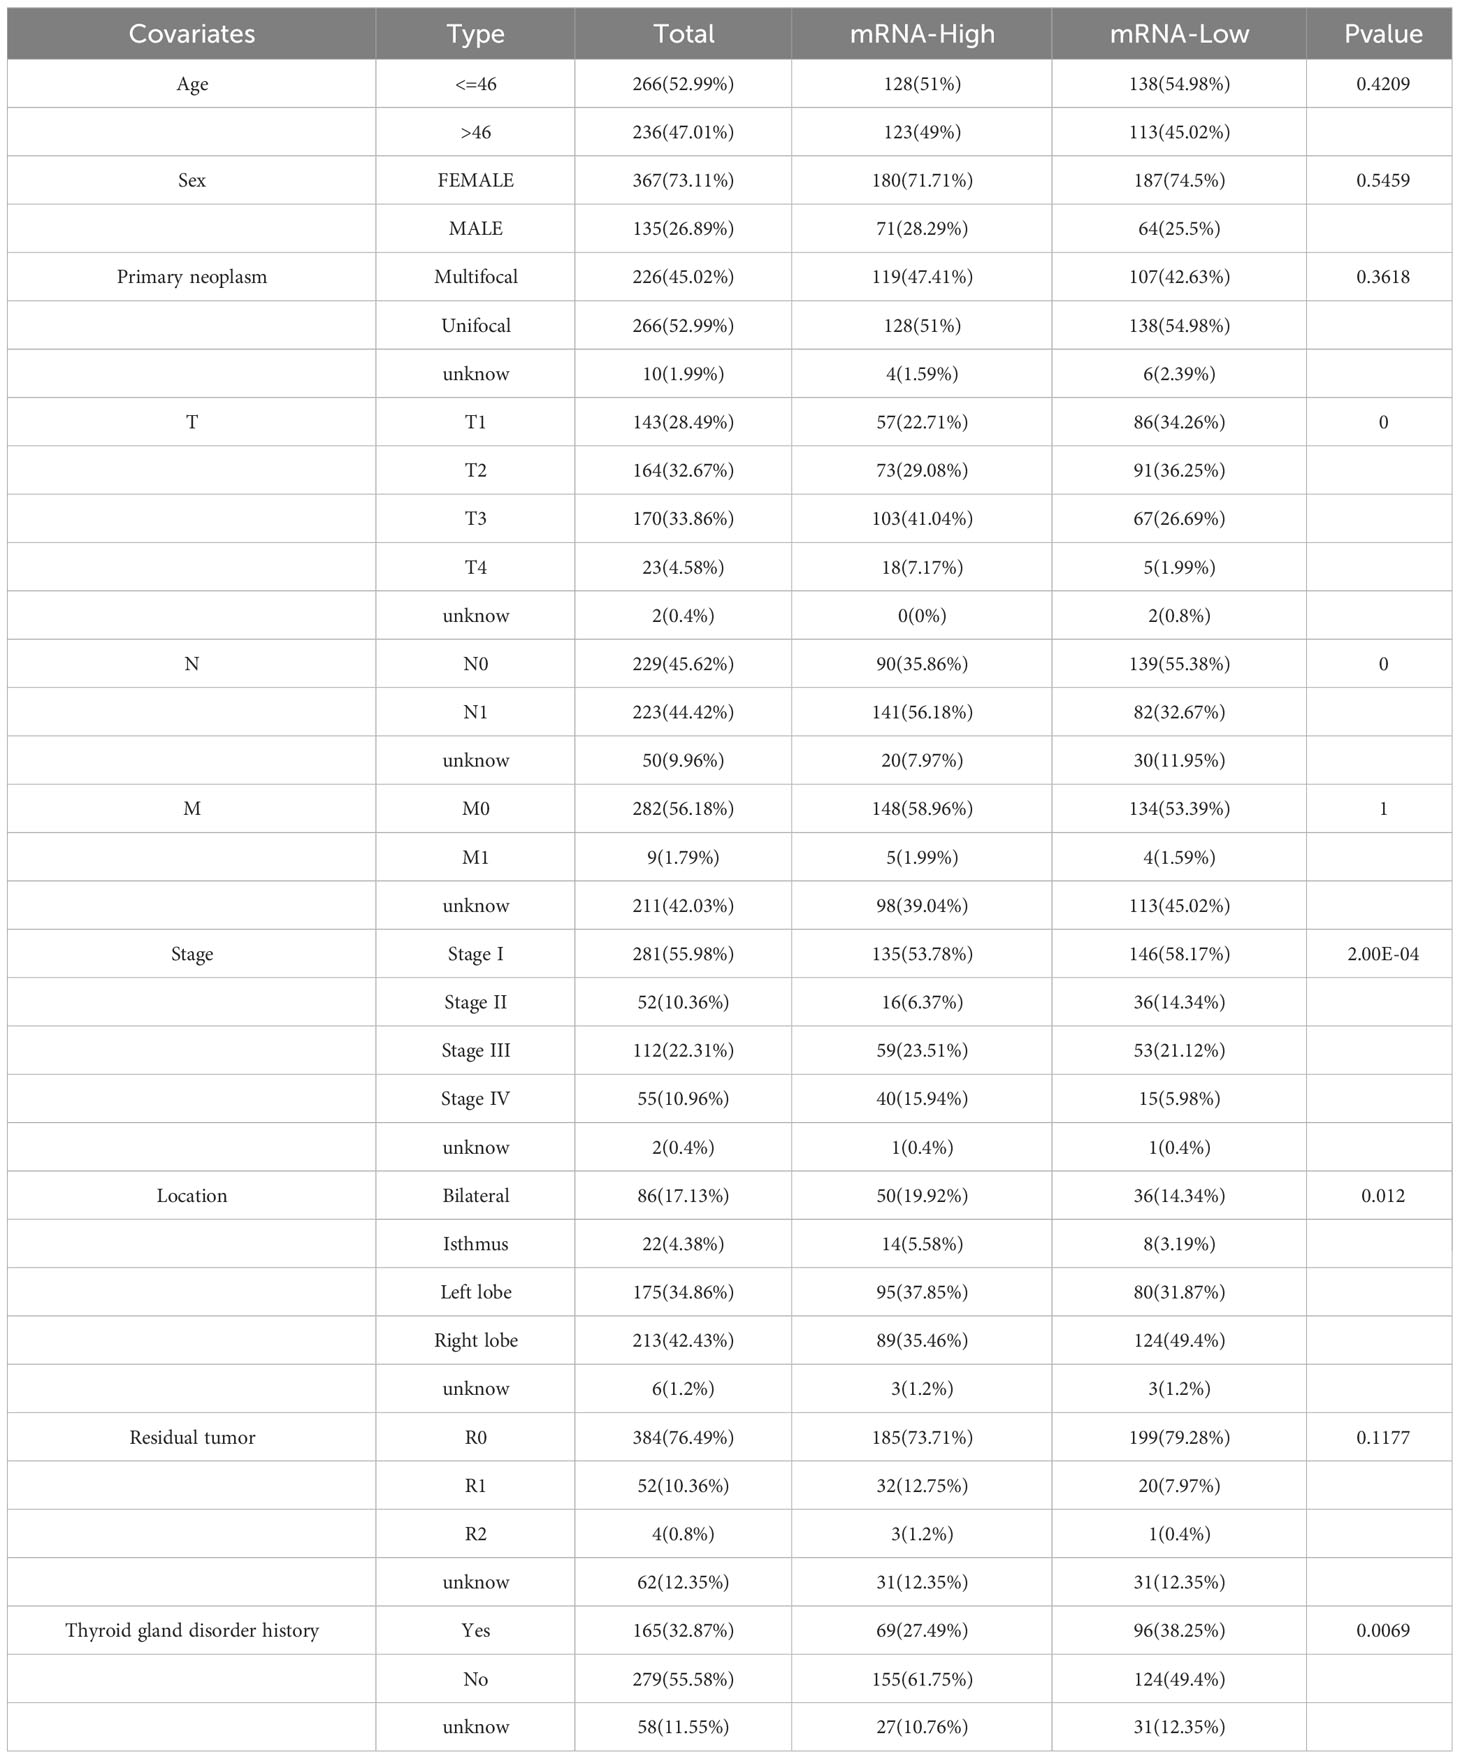
ResultsAlterations in biological processes and immune cell infiltration associated with LNM in thyroid cancerThe median tumor diameter in the TCGA-THCA cohort was 2.5cm. There were 99 cases of patients (LMN Low) with tumor diameter exceeding 2.5cm but no LNM, and 88 cases of patients (LMN High) with tumor diameter below 2.5cm but with LNM. The Table 1 presented patient clinical characteristics.
Table 1 The clinical data from enrolled patients into the study.
Differential gene analysis of the LMN High and LMN Low groups was performed using the limma R package, with a screening criterion of |Log2FC| > 1 and p-value < 0.05. A total of 1038 upregulated genes and 332 downregulated genes were identified in the LMN High group of patients (Supplementary Table 1). Pathway enrichment analysis was performed on upregulated and downregulated genes separately, revealing that the upregulated genes were mainly enriched in adaptive immune response, NABA MATRISOME ASSOCIATED, and positive regulation of immune response. Meanwhile, the downregulated genes were mainly enriched in positive regulation of CoA-transferase activity, Metallothioneins bind metals, and monoatomic ion transmembrane transport (Supplementary Figures 1A, B).
Moreover, there were significant differences in immune infiltration status between the LMN High and LMN Low groups (Supplementary Table 2). Specifically, nTreg, iTreg, Th1, and CD8T cells exhibited relatively higher infiltration levels in the LMN High group, while neutrophils exhibited relatively higher infiltration levels in the LMN Low group (Supplementary Figure 1C). Out of the 10 cancer-related pathways obtained using RPPA technology, only the PI3K/AKT, TSC/mTOR, and RTK pathways were found to have significantly lower activation levels in the LMN High group compared to the LMN Low group (Supplementary Figure 1D).
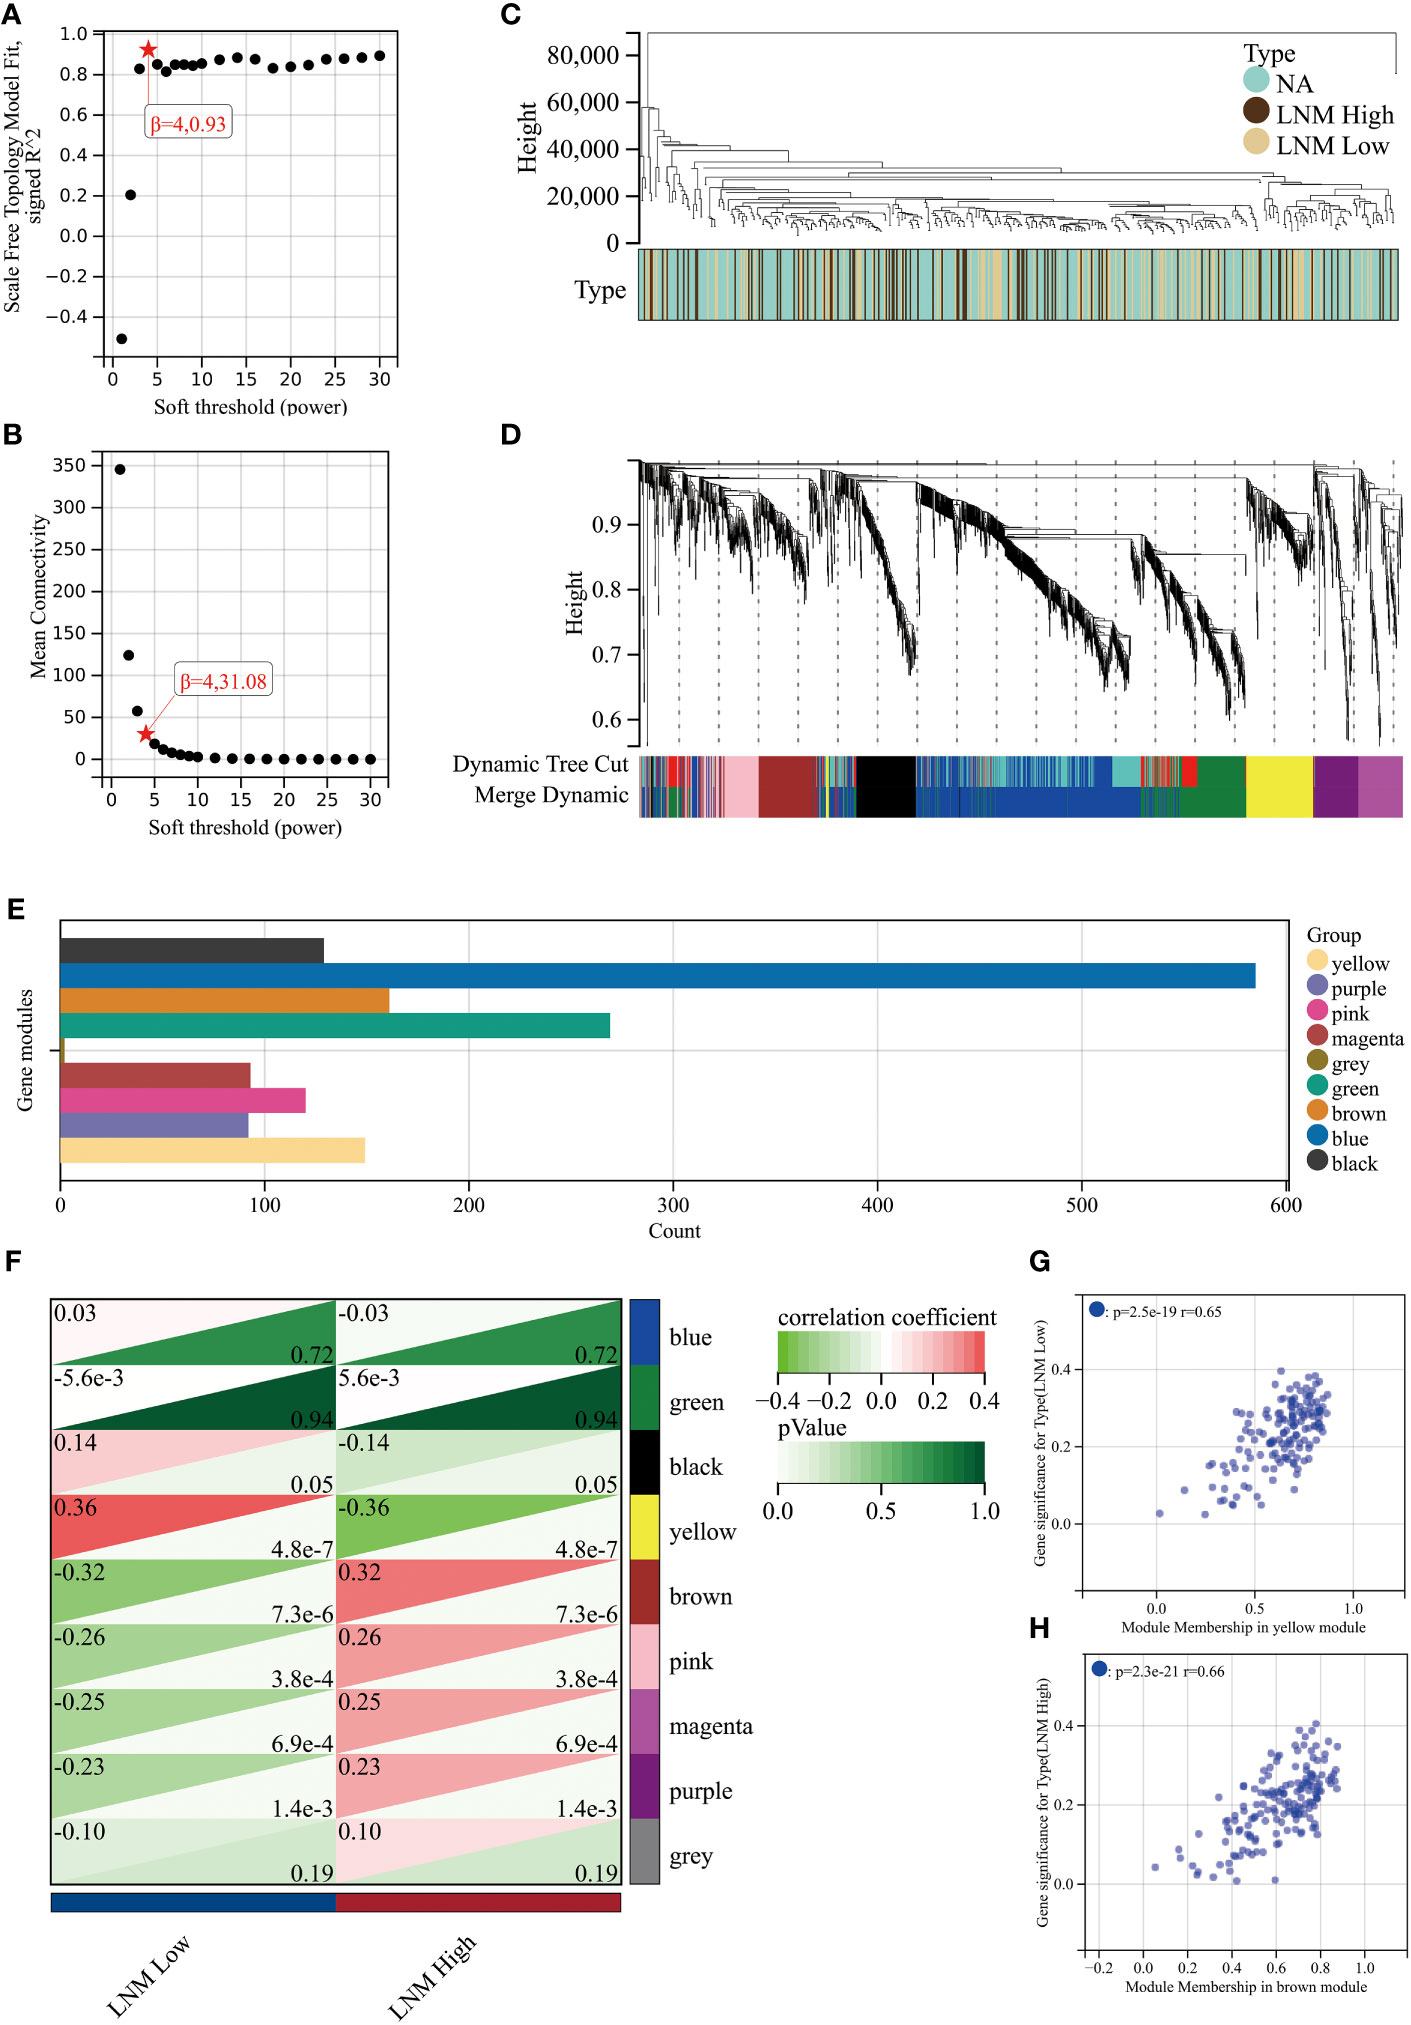
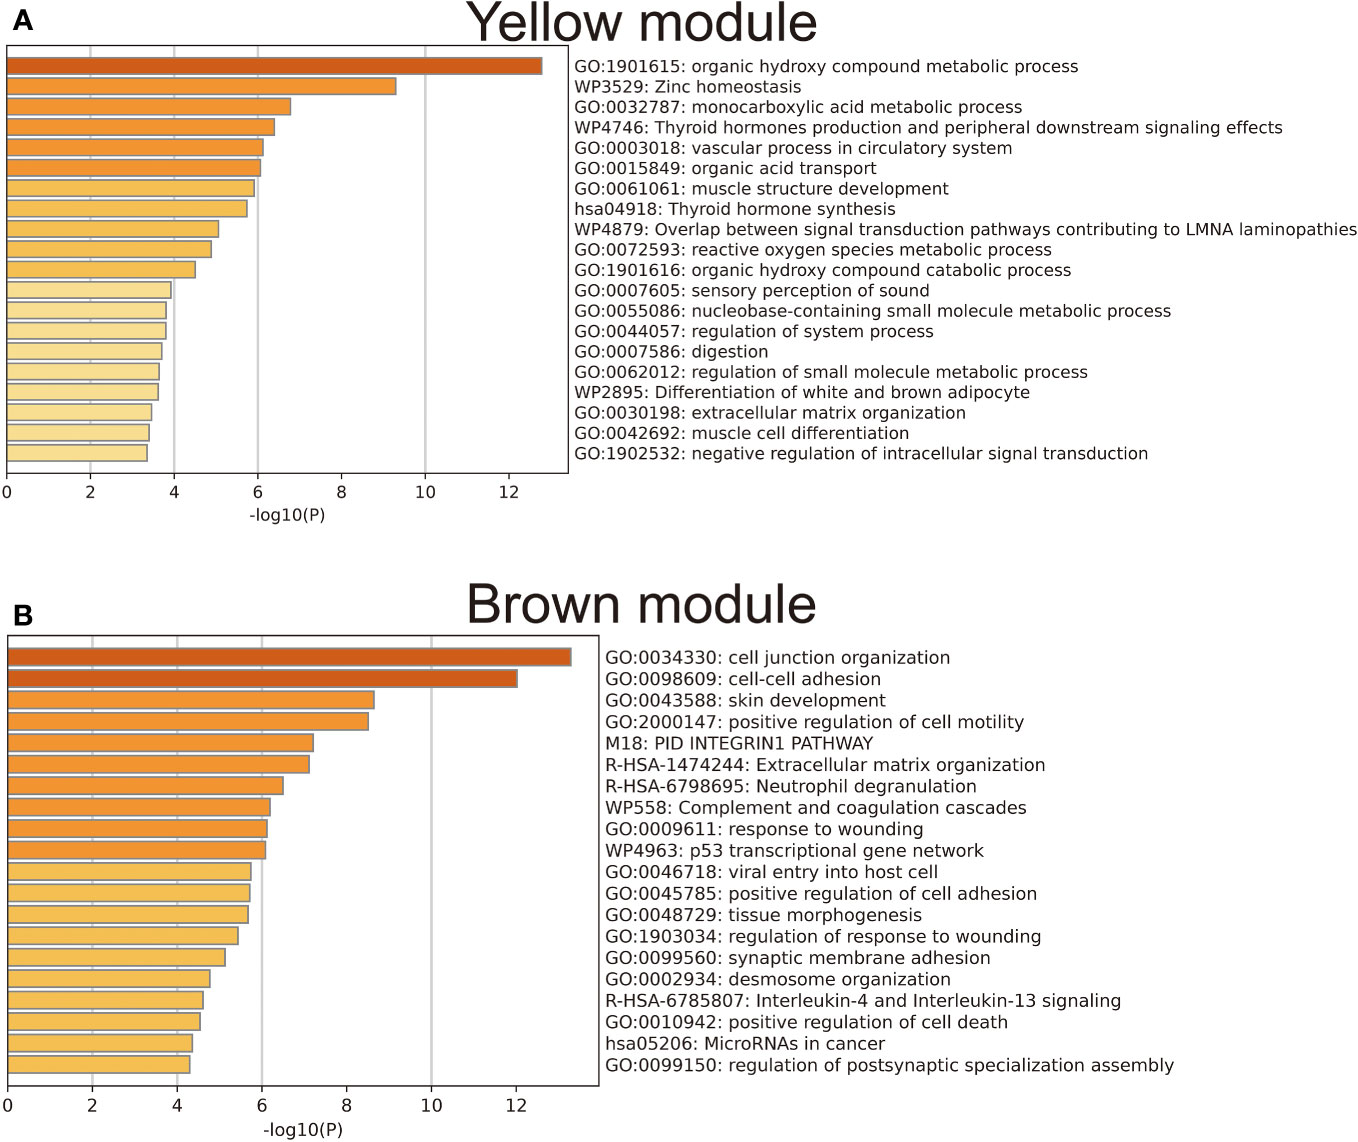
LNM potential-related gene module revealed by WGCNATo achieve a signed scale-free co-expression gene network, a power of β=4 and a scale-free R2 = 0.93 were chosen as the soft-threshold parameters (Figures 1A, B). Within the context of WGCNA analysis, sample clustering was conducted utilizing gene expression patterns in order to identify outliers (Figure 1C). Consequently, 9 gene modules were successfully delineated in the TCGA-THCA cohort (Figure 1D; Supplementary Table 3). The “grey” module was created to encompass genes that could not be sorted into any other discernible genetic module. The module with the greatest number of included genes was the “blue” module (n=585), while the “grey” module (n=2) contained the fewest number of included genes (Figure 1E). The calculation of correlation between module eigengenes (MEs) and clinical features was conducted using the Pearson’s correlation analysis. Through this analytical process, it was discovered that the “brown” module displayed the highest positive correlation with LMN High, while conversely, the “yellow” module showed the highest negative correlation with LMN High (Figure 1F). The significant correlation observed between GS and MM within both the “brown” and “yellow” modules suggests a strong association between these modules and the potential for LNM (Figures 1G, H). The biological processes primarily enriched by genes within the “yellow” module included organic hydroxy compound metabolic process, homeostasis, and monocarboxylic acid metabolic process, among others (Figure 2A). The “brown” module was primarily enriched in genes associated with biological processes such as cell junction organization, cell-cell adhesion, skin development, and positive regulation of cell motility (Figure 2B).
Figure 1 An investigation into the determination of soft-thresholding power used in WGCNA. (A) An examination of the scale-free fit index for different soft-thresholding powers (β). (B) Investigation into the mean connectivity for different soft-thresholding powers. (C) Illustration of the sample dendrogram and clustering dendrogram via WGCNA. (D) Hierarchical cluster tree depicting the co-expression modules discovered through WGCNA. (E) The number of genes in different gene modules. (F) The correlation between different gene modules and the LNM potential. The correlation between module membership (MM) and gene significance (GS) in the yellow (G) and brown (H) modules.
Figure 2 Results of gene enrichment analysis for the yellow (A) and brown (B) gene modules.
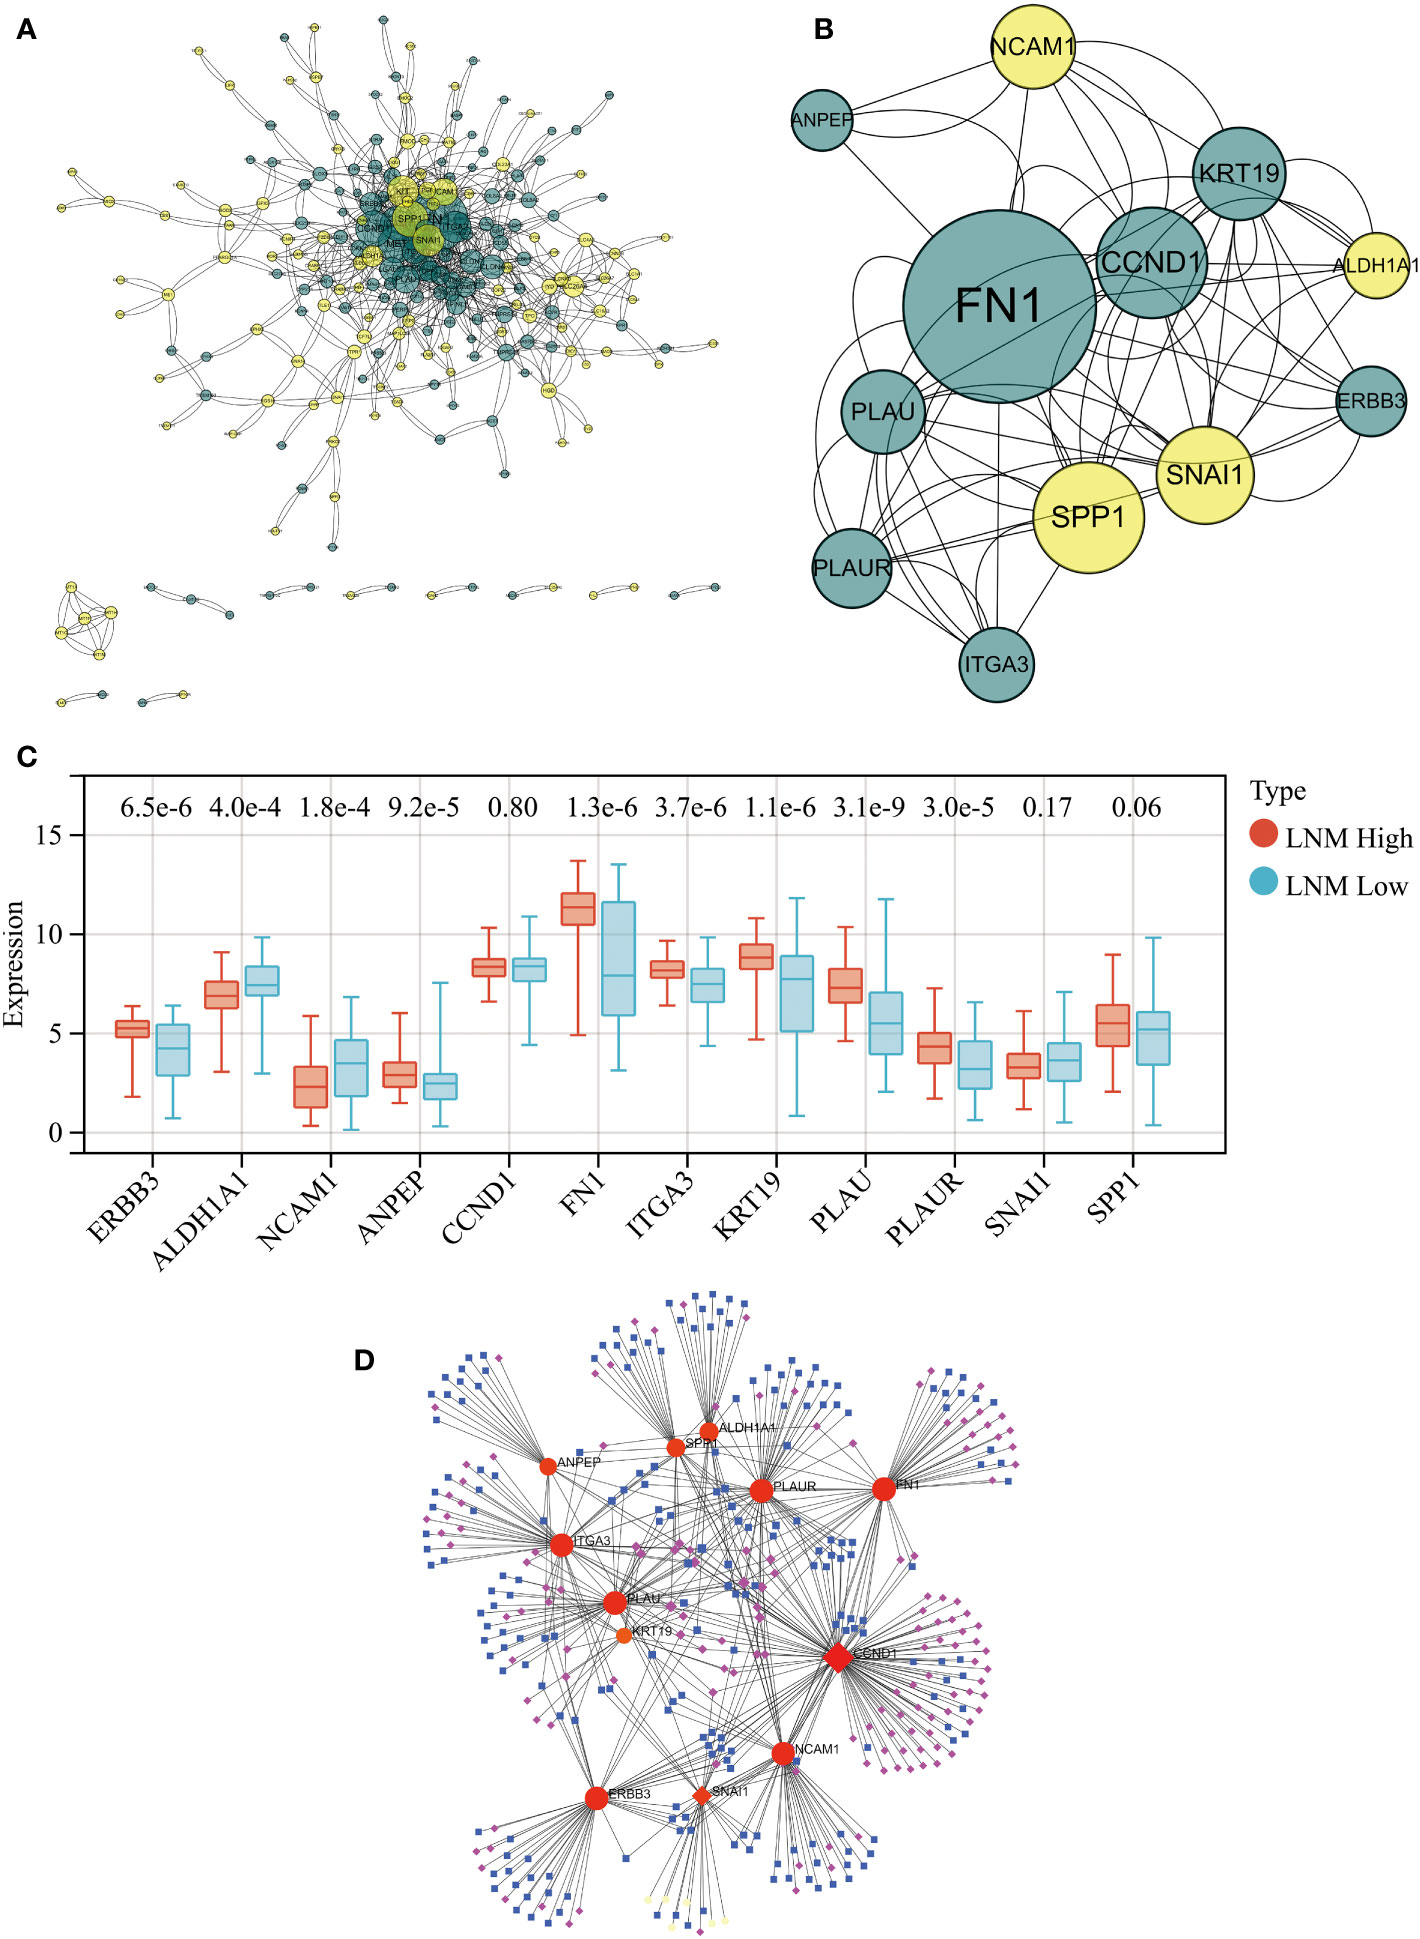
Identification of hub genes in the LNM potential-related gene modulesPPI network analysis of all genes within the ‘yellow’ and ‘brown’ modules was performed using the STRING tool (Figure 3A). A key cluster (Cluster 1) of the PPI network was extracted using the CytoNCA plugin within the Cytoscape software, and ERBB3 served as the seed of this cluster (Supplementary Table 4). The identified cluster consisted of 12 hub genes related to LNM potential, with 4 of them originating from the ‘yellow’ gene module and the rest from the ‘brown’ module (Figure 3B).
Figure 3 (A) PPI network for all genes within the yellow and brown gene modules. (B) The PPI network’s hub genes were screened through the use of CytoNCA, with the top 12 hub genes being further selected via CytoNCA. (C) Expression levels of these 12 hub genes in THCA patients with high and low LNM potential. (D) Gene-miRNA, TF-gene, and TF-miRNA interaction networks centered around these 12 hub genes.
Expression levels of ALDH1A1 and NCAM1 were observed to be upregulated in the LNM Low group, whereas PLAU, KRT19, FN1, ITGA3, ERBB3, PLAUR, and ANPEP were found to be overexpressed in the LNM High group (Figure 3C; Supplementary Table 5). Using the 12 hub genes as the central framework, we constructed gene-miRNA, TF-gene, and TF-miRNA interaction networks to investigate the key regulatory mechanisms underlying gene expression (Figure 3D; Supplementary Table 6).
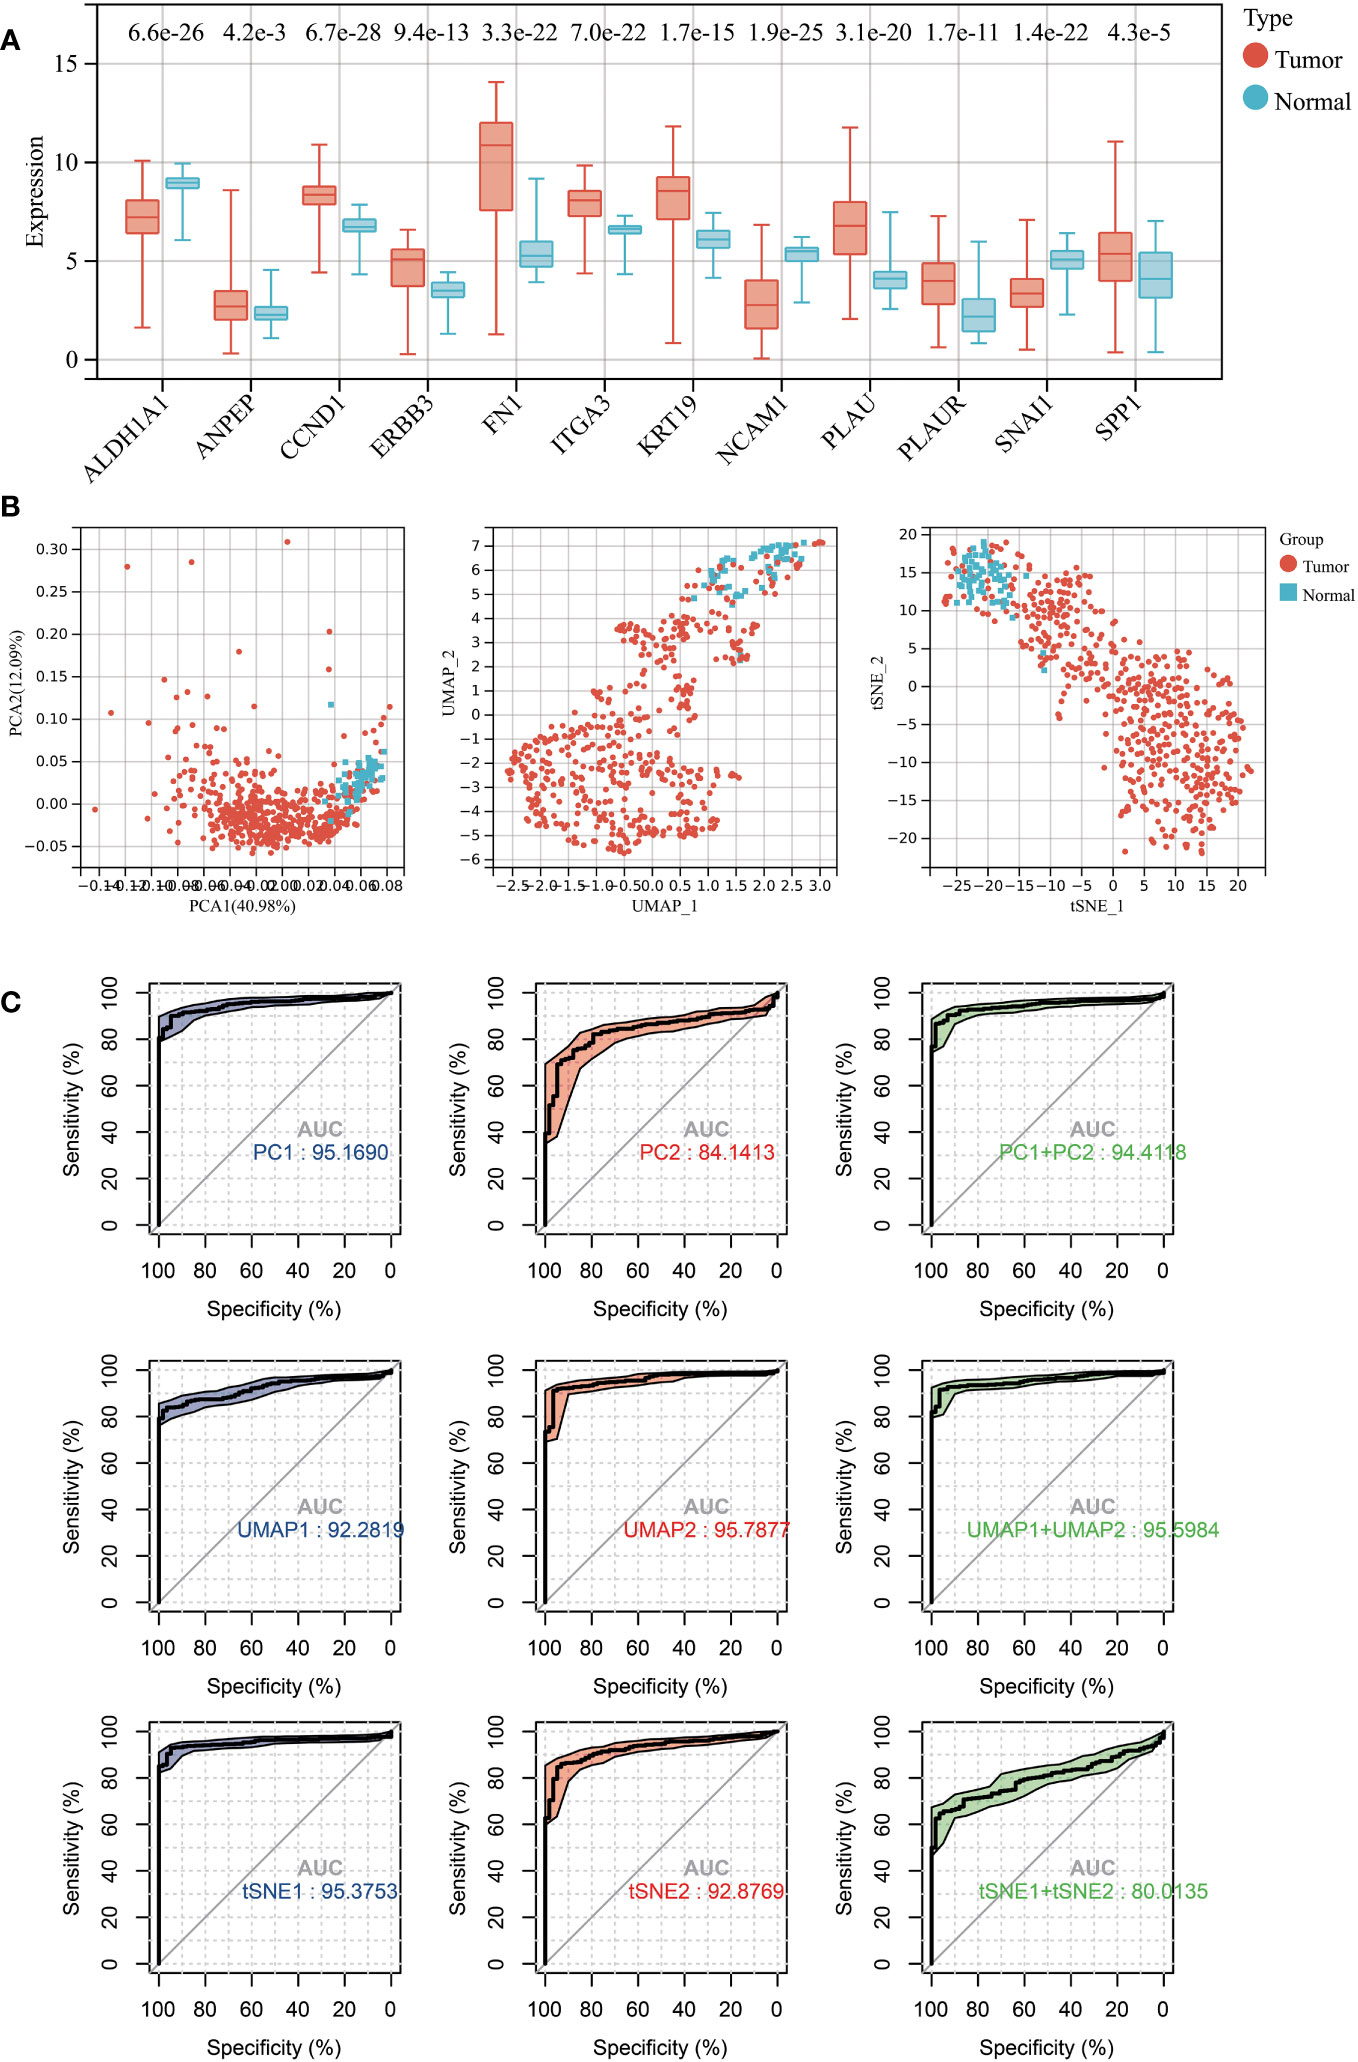
The diagnostic ability of hub genes in THCAAll 12 hub genes related to LNM potential exhibited significant differential expression between THCA and normal thyroid tissues (Figure 4A). Specifically, the gene expressions of ALDH1A1, NCAM1, and SNAI1 were downregulated in THCA, while the expressions of the remaining nine genes were upregulated.
Figure 4 (A) Expression levels of 12 LNM potential-related hub genes between THCA and normal thyroid tissue. (B) The PCA (left), UMAP (middle), and TSNE (right) dimensionality reduction algorithms were utilized to generate data visualization. (C) The diagnostic capability of various dimensionality reduction algorithms on THCA was evaluated via ROC plot, utilizing the first two principal components and the sum of the first and second principal components.
Subsequently, we conducted dimensional reduction analysis based on hub gene expression using PCA, UMAP, and t-SNE. These analyses effectively distinguished THCA from normal tissues (Figure 4B). ROC analysis demonstrated that PCA1/2, UMAP1/2, t-SNE1/2, and their combination can serve as outstanding diagnostic biomarkers for THCA (Figures 4B, C).
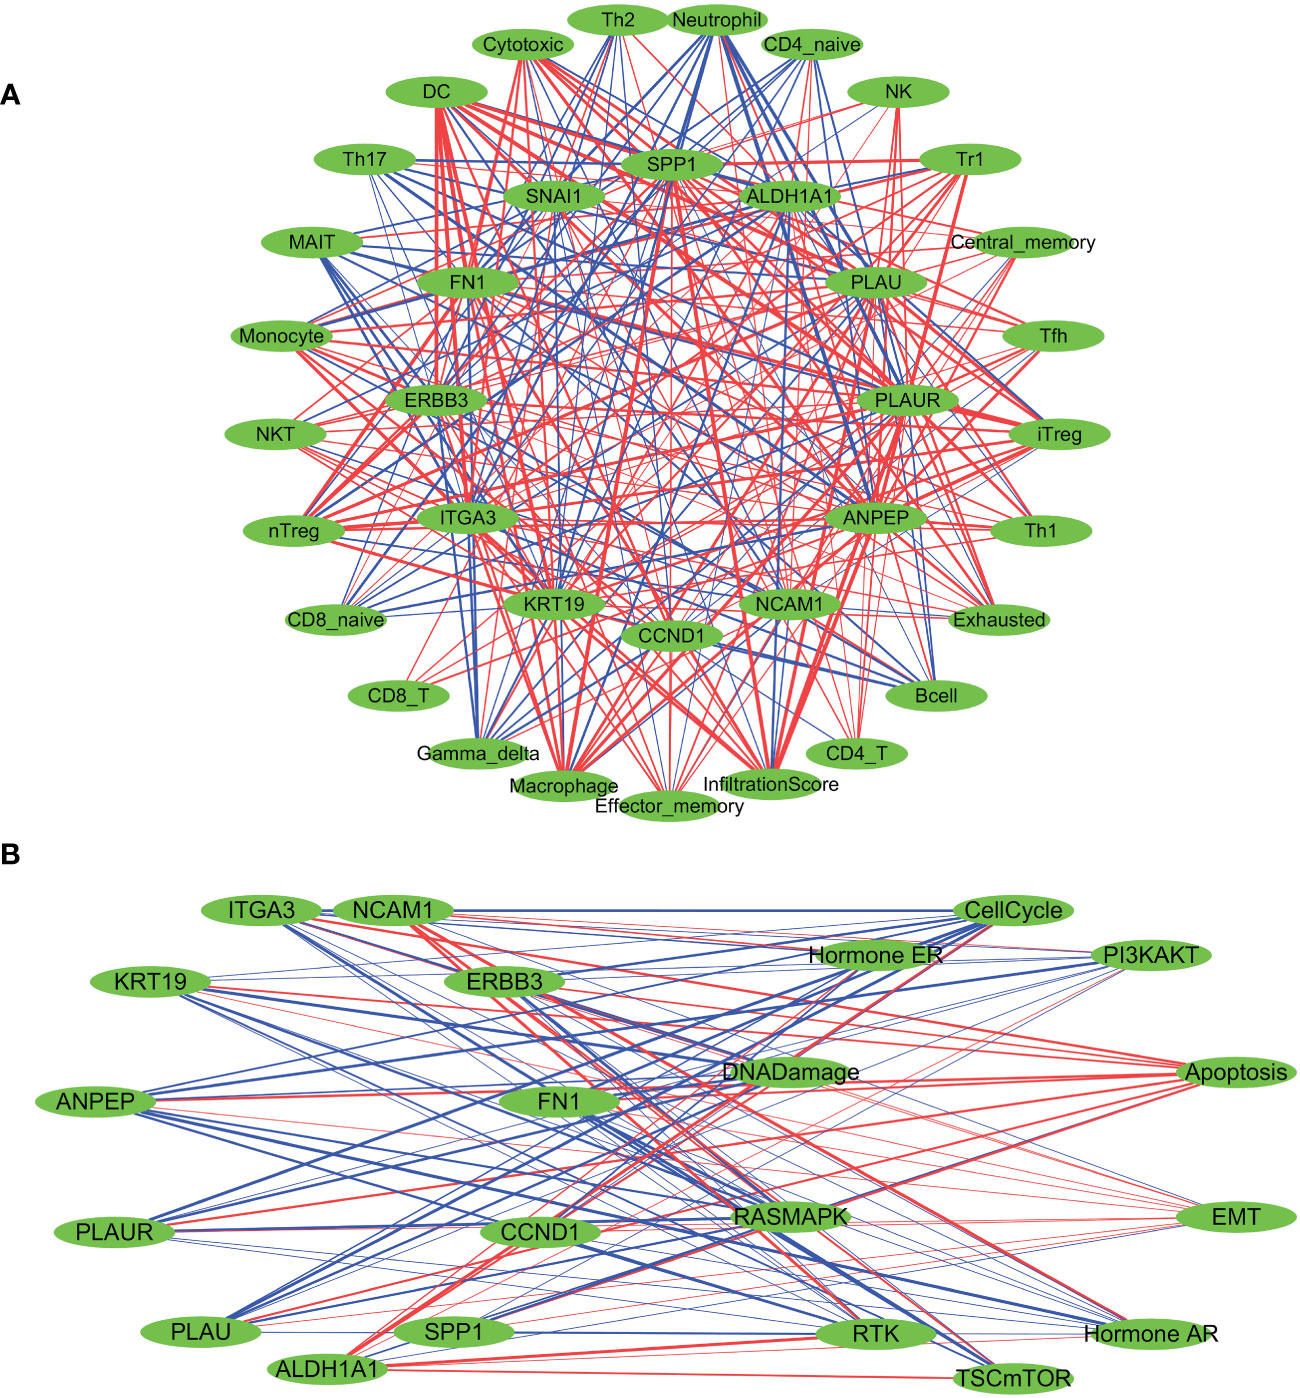
The variations in immune infiltration and pathway activation associated to LNM potential-related hub genesA Spearman correlation analysis was performed to investigate the correlation between the gene expression levels of all 12 LNM potential-related hub genes and the infiltration scores of different immune cells (Figure 5A; Supplementary Table 7). With the exceptions of SNAI1, NCAM1, and ALDH1A1, the infiltration levels of DC cells showed significant positive correlations with other hub genes, with R>0.5 and p<0.0001. Of particular note was the strongest positive correlation observed between the infiltration levels of DC cells and the gene expression levels of FN1 (R=0.77; p<0.001). Furthermore, there was a significant negative correlation between the gene expression levels of DC cells and ALDH1A1 (R=-0.58; p<0.0001). Neutrophil infiltration levels did not show a significant correlation with SNAI1 and CCND1. The correlation observed between Neutrophil infiltration levels and NCAM1 was weakly positive (R=0.17; p <0.0001). In addition, there were significant negative correlations observed between Neutrophil infiltration levels and the other nine identified hub genes, with ANPEP exhibiting the strongest negative correlation (R=-0.69; p <0.0001).
Figure 5 Spearman’s correlation analysis was performed to evaluate the correlation between the expression levels of LNM potential-related hub genes and tumor immune cell infiltration (A), as well as the ten cancer-related pathways (B). The red lines indicate positive correlation, the blue lines indicate negative correlation, and the thickness of the lines represents the correlation coefficient.
Subsequently, we investigated the influence of CNV and SNV status of hub genes on immune cell infiltration in tumors. A sample was classified as either CNV-Amplification (Amp), CNV-Deletion (Del), or SNV-Mutant based on the occurrence of a CNV or SNV alteration in at least one of the identified hub genes. Using a significance level of P<0.05 as a filtering criterion, it was observed that the occurrence of CNV Amplification in hub genes was associated with a relatively higher degree of variability in immune cell infiltration, compared to CNV Deletion and SNV-Mutant (Supplementary Figures 3A, B). Furthermore, we conducted an evaluation of the influence of the activation levels of identified hub genes (GSVA scores) on immune cell infiltration in various cancer types using pan-cancer analysis based on the GSVA algorithm. This analysis encompassed assessments across 33 cancer types (Supplementary Figure 3C; Supplementary Table 8). A positive correlation was observed between the activation levels of identified hub genes and the levels of DC and macrophage infiltration in the majority of the analyzed tumor types. In contrast, a negative correlation was noted between hub gene activation levels and the level of neutrophil infiltration.Similar results were observed in the TCGA-THCA cohort, where a strong positive correlation was found between the GSVA scores of identified hub genes and the level of DC infiltration. Simultaneously, a robust negative correlation was identified between hub gene GSVA scores and the level of neutrophil infiltration (Supplementary Figure 3D).
Based on the median gene expression of hub genes, the samples were segregated into two groups – High and Low. To determine the difference in PAS score between the groups, the student T test was performed and the p-value was adjusted by false discovery rate (FDR). We considered a gene to have an activating effect on a pathway if the FDR PAS (gene A Low expression) value suggested so (FDR<0.05), and conversely, we classified it as having an inhibitory effect. A similar methodology was employed by Y. Ye et al. (66). The results of the TCGA-THCA cohort highlighted a pronounced regulatory impact of hub genes on the EMT, PI3K-AKT, and RTK signaling pathways. The overexpression of NCAM1 and ALDH1A1 signifies a more inhibitory effect on the EMT pathway and an enhanced activation of the RTK and PI3K-AKT pathways. The activation of the EMT, RTK, and PI3K-AKT pathways are not significantly influenced by SNAI1, whereas CCND1 activates the EMT pathway while suppressing the RTK pathway. Elevated expression levels of the remaining hub genes indicate the activation of the EMT pathway and inhibition of the RTK and PI3K-AKT pathways (Figure 5B; Supplementary Table 9). Furthermore, a pancancer analysis was conducted to investigate the regulatory effects of different hub genes on cancer-associated pathways in various types of cancer, as demonstrated in Supplementary Figure 3E. The pancancer analysis revealed that these hub genes exhibit the highest advantage in activating the EMT pathway.
The establishment of a molecular classification schemeTo further integrate the features of the 12 identified hub genes for predicting LNM potential in THCA patients, we performed unsupervised clustering using “ConsensusClusterPlus”. Based on the consensus CDF and relative changes in the area beneath the CDF curve, it was determined that all patients could be effectively clustered into two distinct groups (cluster 1 and cluster 2; Figures 6A–D). The heatmap revealed distinct gene expression patterns across different patient clusters (Figure 6E). Subsequently, we conducted further investigations into the relationship between the molecular classification scheme and LNM in THCA patients. In the TCGA-THCA cohort, patients with low LNM potential were found to be predominantly composed of individuals within cluster 2 (65%; chi-square test, chi-square value= 14.92, p-value<0.001; Figure 6F), whereas those within cluster 1 demonstrated a higher incidence of LNM (64%; chi-square test, chi-square value= 41.03, p-value<0.0001, Figure 6G).
Figure 6 Constructing a novel molecular subtyping scheme using unsupervised clustering. (A) relative change in area under cumulative distribution function (CDF) curve. (B) Consensus clustering CDF for k=2-10. (C) Consensus matrix of THCA samples co-occurrence proportion for k = 2. (D) Cluster consensus values when K=1 to 10. (E) The expression levels of LNM potential-related hub genes between different clusters are shown in a heatmap. (F) The proportions ofpatients with high and low LNM potential in Cluster 1 and Cluster 2. (G) The proportions of patients with N0 and N1 staging in Cluster 1 and Cluster 2. ***: p<0.001.
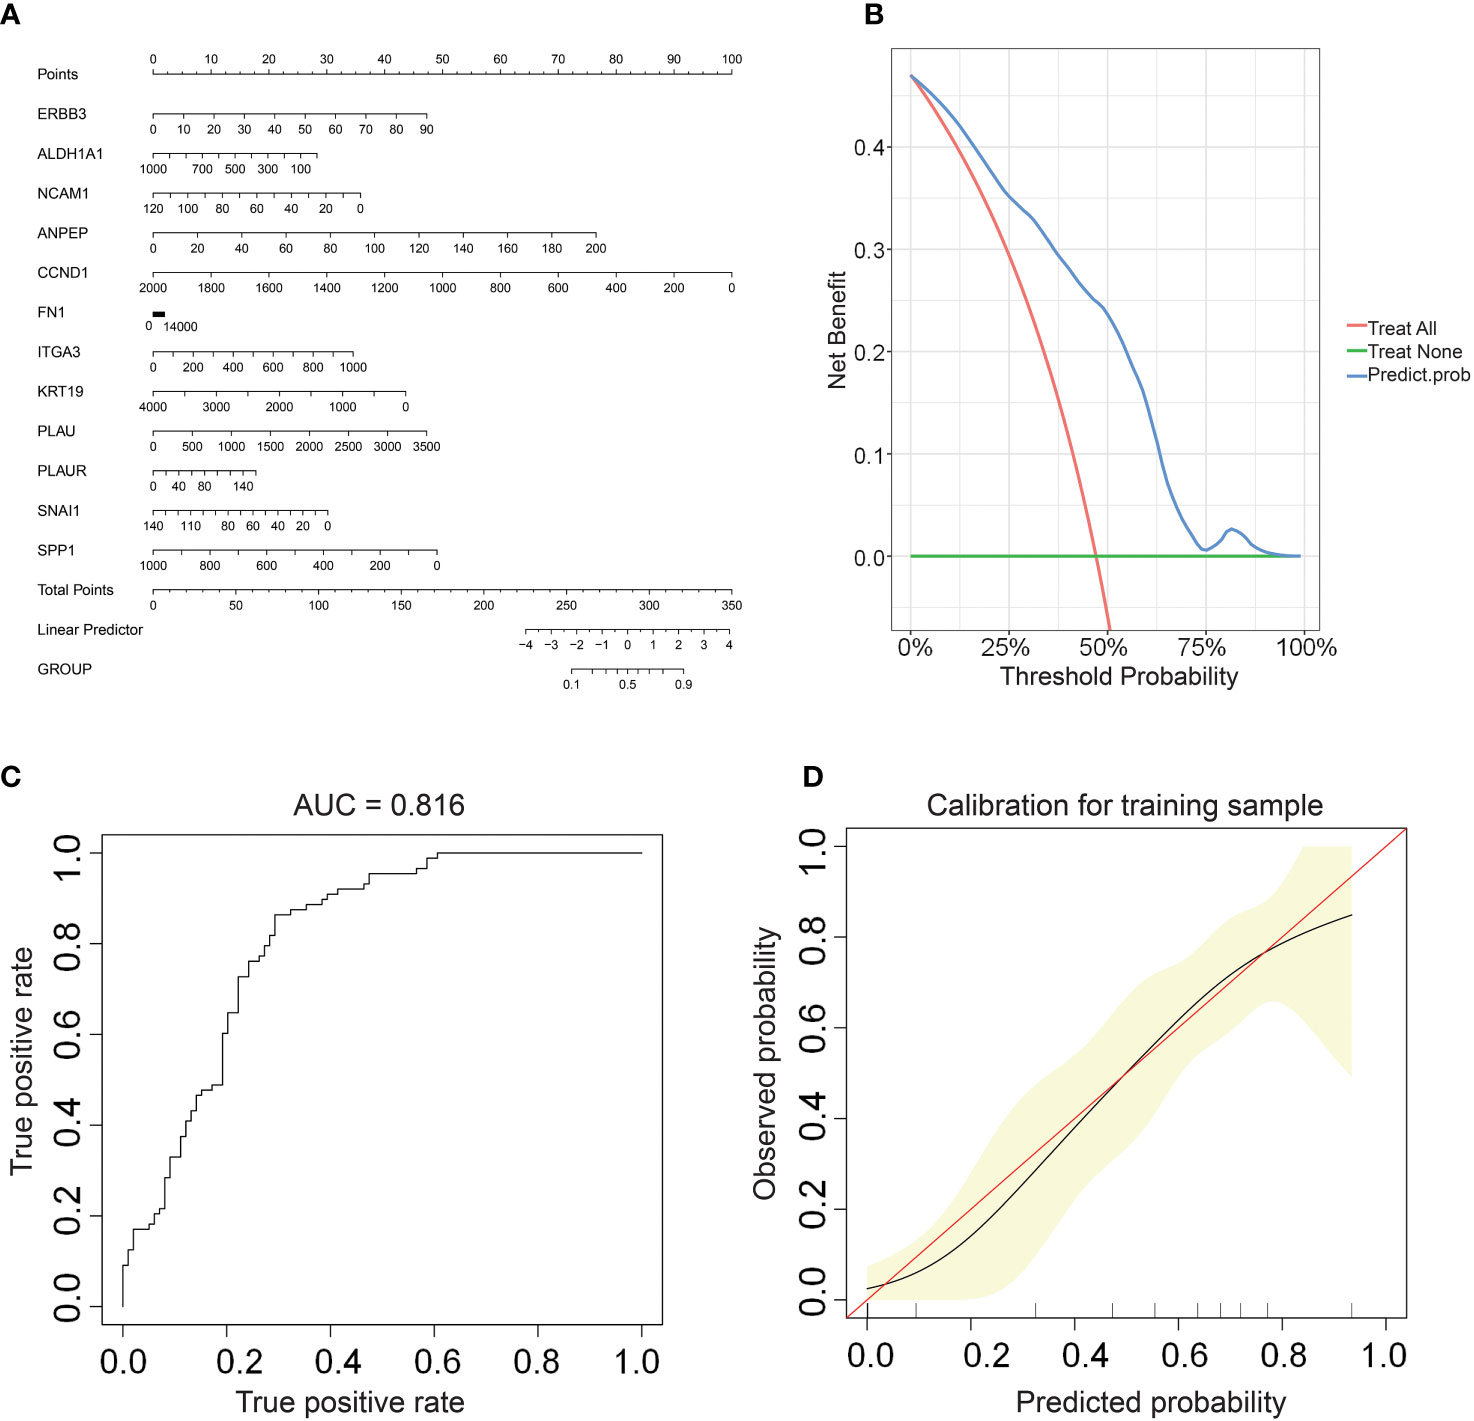
Establishment of an online nomogram tool for improved clinical decision makingWe constructed a nomogram based on the gene expression levels of 12 hub genes that serves to assess the LNM potential of THCA patients (Figure 7A). Establishment of the nomogram was executed using the rms R package. Performance assessment of the nomogram was conducted using decision curve analysis (DCA) (Figure 7B), receiver operating characteristic curve (ROC) (Figure 7C), and calibration curve (Figure 7D). Clinical utility of the nomogram was confirmed by DCA. Figure 7C demonstrated that the area under the ROC curve (AUC) of the nomogram incorporating all predictors for high-LNM potential patients was 0.816. The calibration curve’s proximity to the ideal diagonal line was indicative of the good predictive performance of the nomogram. Furthermore, in order to further promote the accessibility and clinical utilization of our nomogram, it is noteworthy that an online web tool named “LNM potential” has been devised. The web address for this online tool is located at http://www.empowerstats.net/pmodel/?m=17617_LNM. By means of this online tool, the application of our research findings to the clinical setting may be further actualized. This tool contributes to the identification of THCA patients with a high LNM potential, providing a foundation for the development of individualized clinical treatment regimens.
Figure 7 (A) A nomogram for predicting LNM potential in THCA. The DCA curve (B), ROC curve (C), and calibration curve (D) for the predictive nomogram.
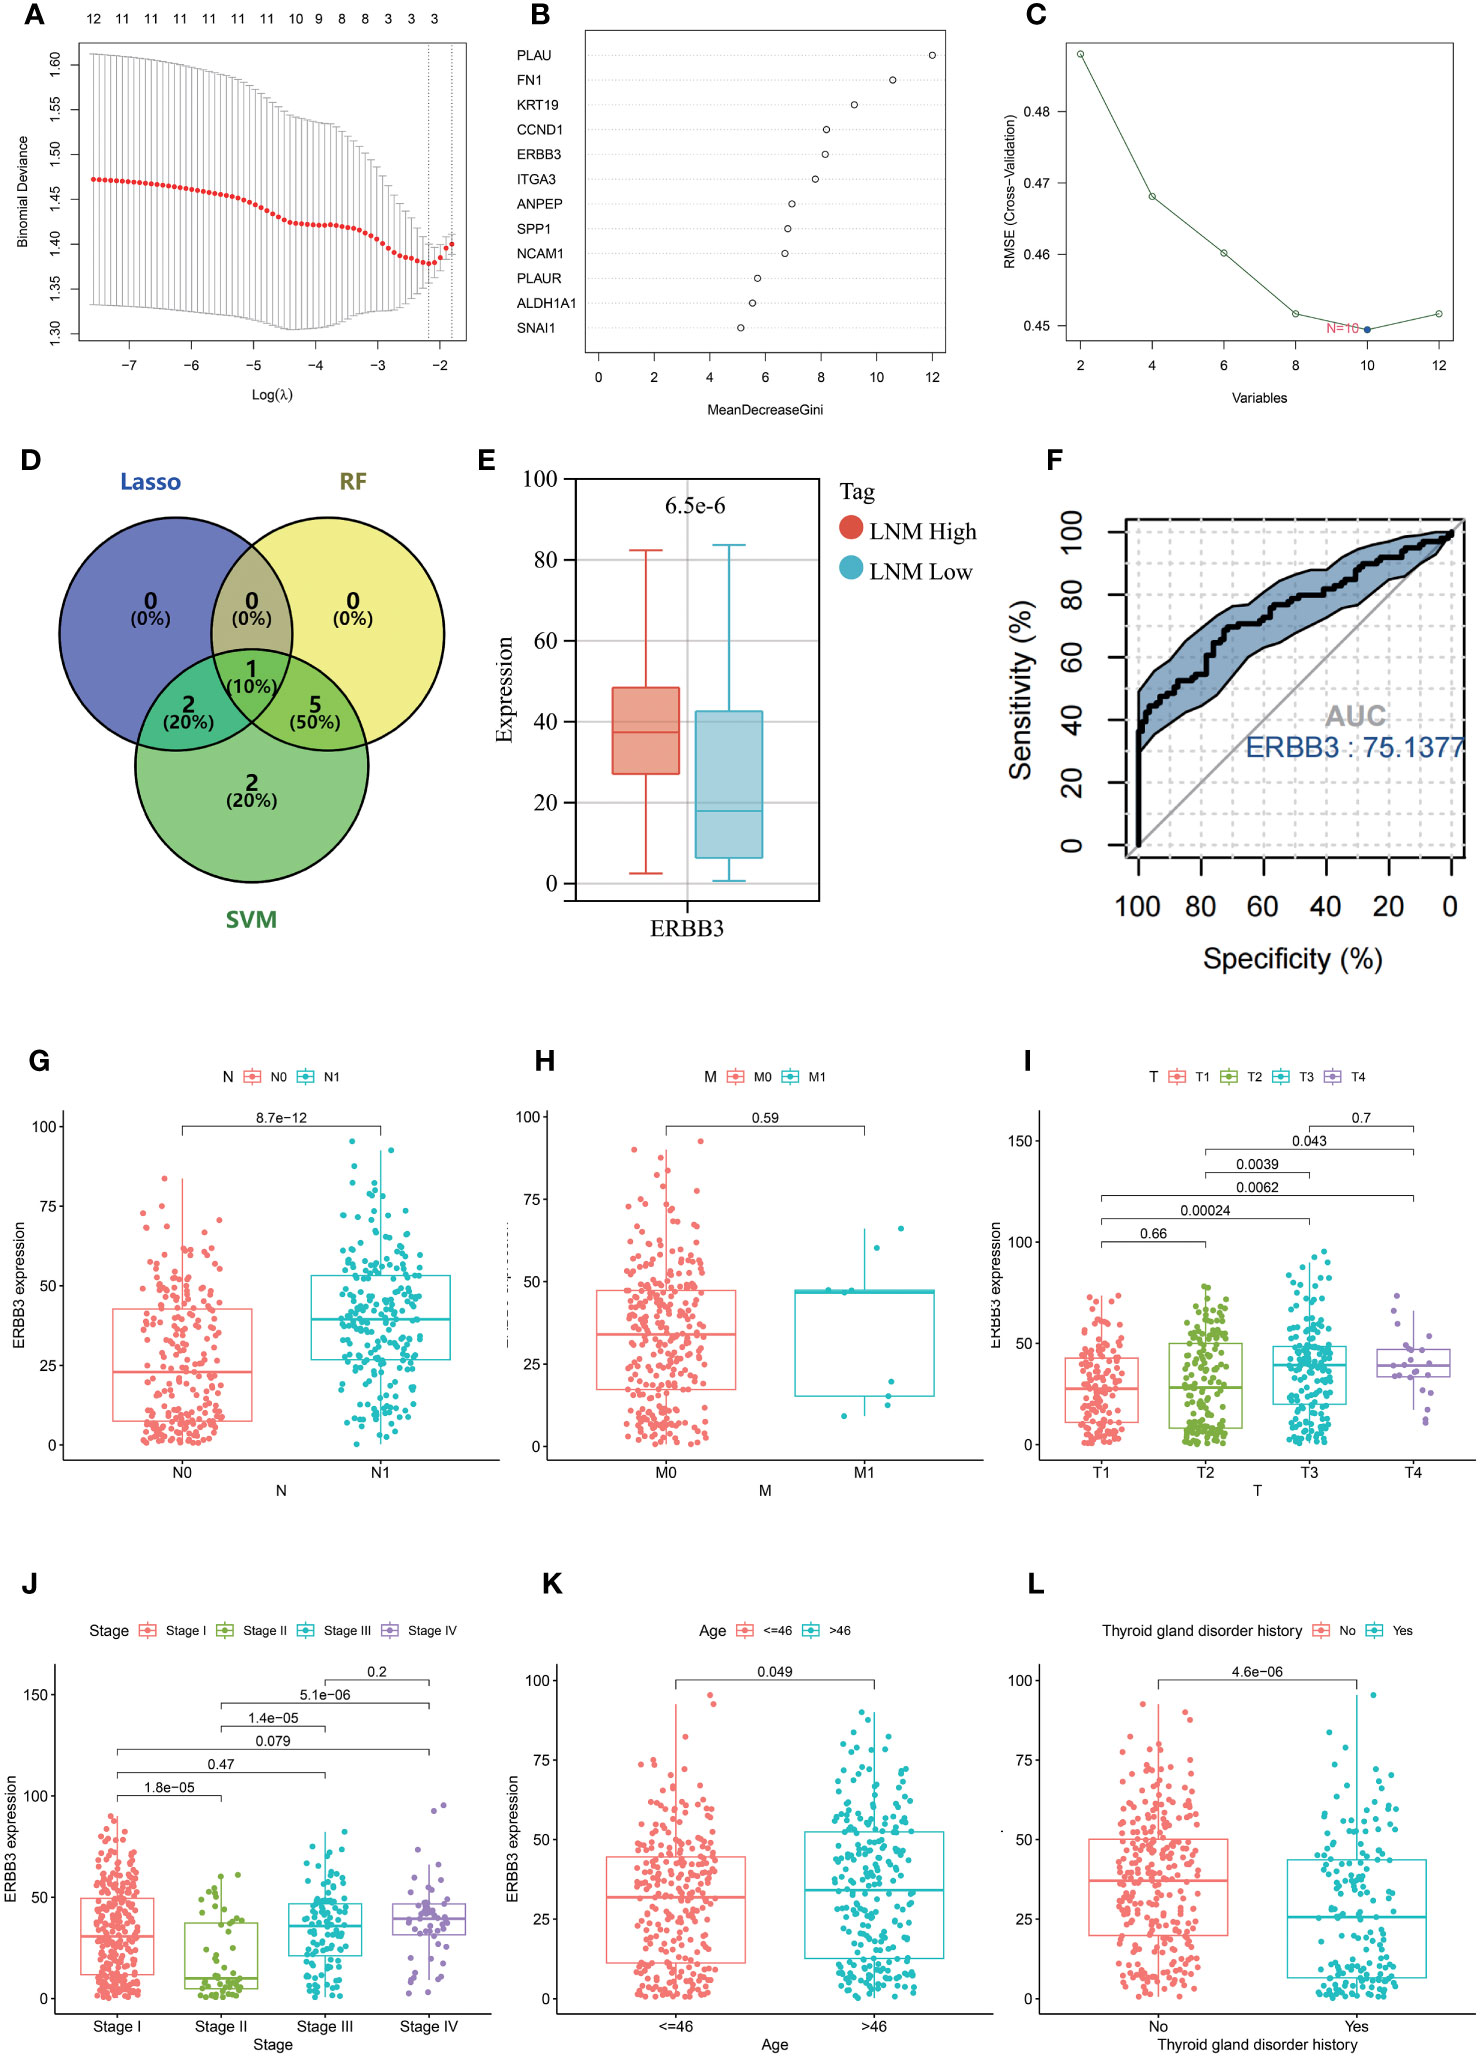
Further exploration based on machine learning to identify key genes associated with LNM potentialThree machine learning methods (Lasso, Random forest, SVM) were employed to further screen key genes that could influence the LNM potential in patients with THCA from 12 hub genes (Figures 8A–C). ERBB3 was identified as being important for LNM potential in all three machine learning algorithms (Figure 8D). ERBB3 expression was upregulated in patients with high lymph node metastatic potential (LNM High) and ROC analysis indicated ERBB3 as a promising diagnostic biomarker for LNM High patients (Figures 8E, F).
Figure 8 Results of selection by LASSO (A), random forest (B), and SVM (C). (D) Venn diagram depicting the overlapping genes selected by LASSO, random forest, and SVM models. (E) The expression level of ERBB3 in individuals with different LNM potentials of THCA. (F) ROC analysis for the ability of ERBB3 to diagnose individuals with high LNM potentials of THCA. The expression level of ERBB3 has been examined in relation to different N stages (G), M stages (H), T stages (I), tumor stages (J), and ages (K). (L) The gene expression levels of ERBB3 in patients with and without a history of Thyroid gland disorder.
The relationship between ERBB3 mRNA expression and DNA methylation levels with different clinical featuresFurther investigation was conducted to explore the association between ERBB3 and various clinical characteristics (Table 2). ERBB3 was significantly upregulated in THCA patients with lymph node metastasis as well as those with higher T stage, but there was no significant difference in ERBB3 expression between M0 and M1 patients (Figures 8G–I). Patients in Stage II had the lowest level of ERBB3 expression (Figure 8J). It is noteworthy that patients of older age or with a medical history of thyroid gland disorder exhibited a significant upregulation of ERBB3 mRNA levels (Figures 8K, L). In the TCGA-THCA cohort, the variables of Sex, primary neoplasm location, and number did not significantly perturb the expression level of ERBB3 (Supplementary Figures 4A–C). ERBB3 has no impact on the complete surgical resection rate of THCA (Supplementary Figure 4D).
Table 2 Clinical information of patients with high and low ERBB3 mRNA expression levels.
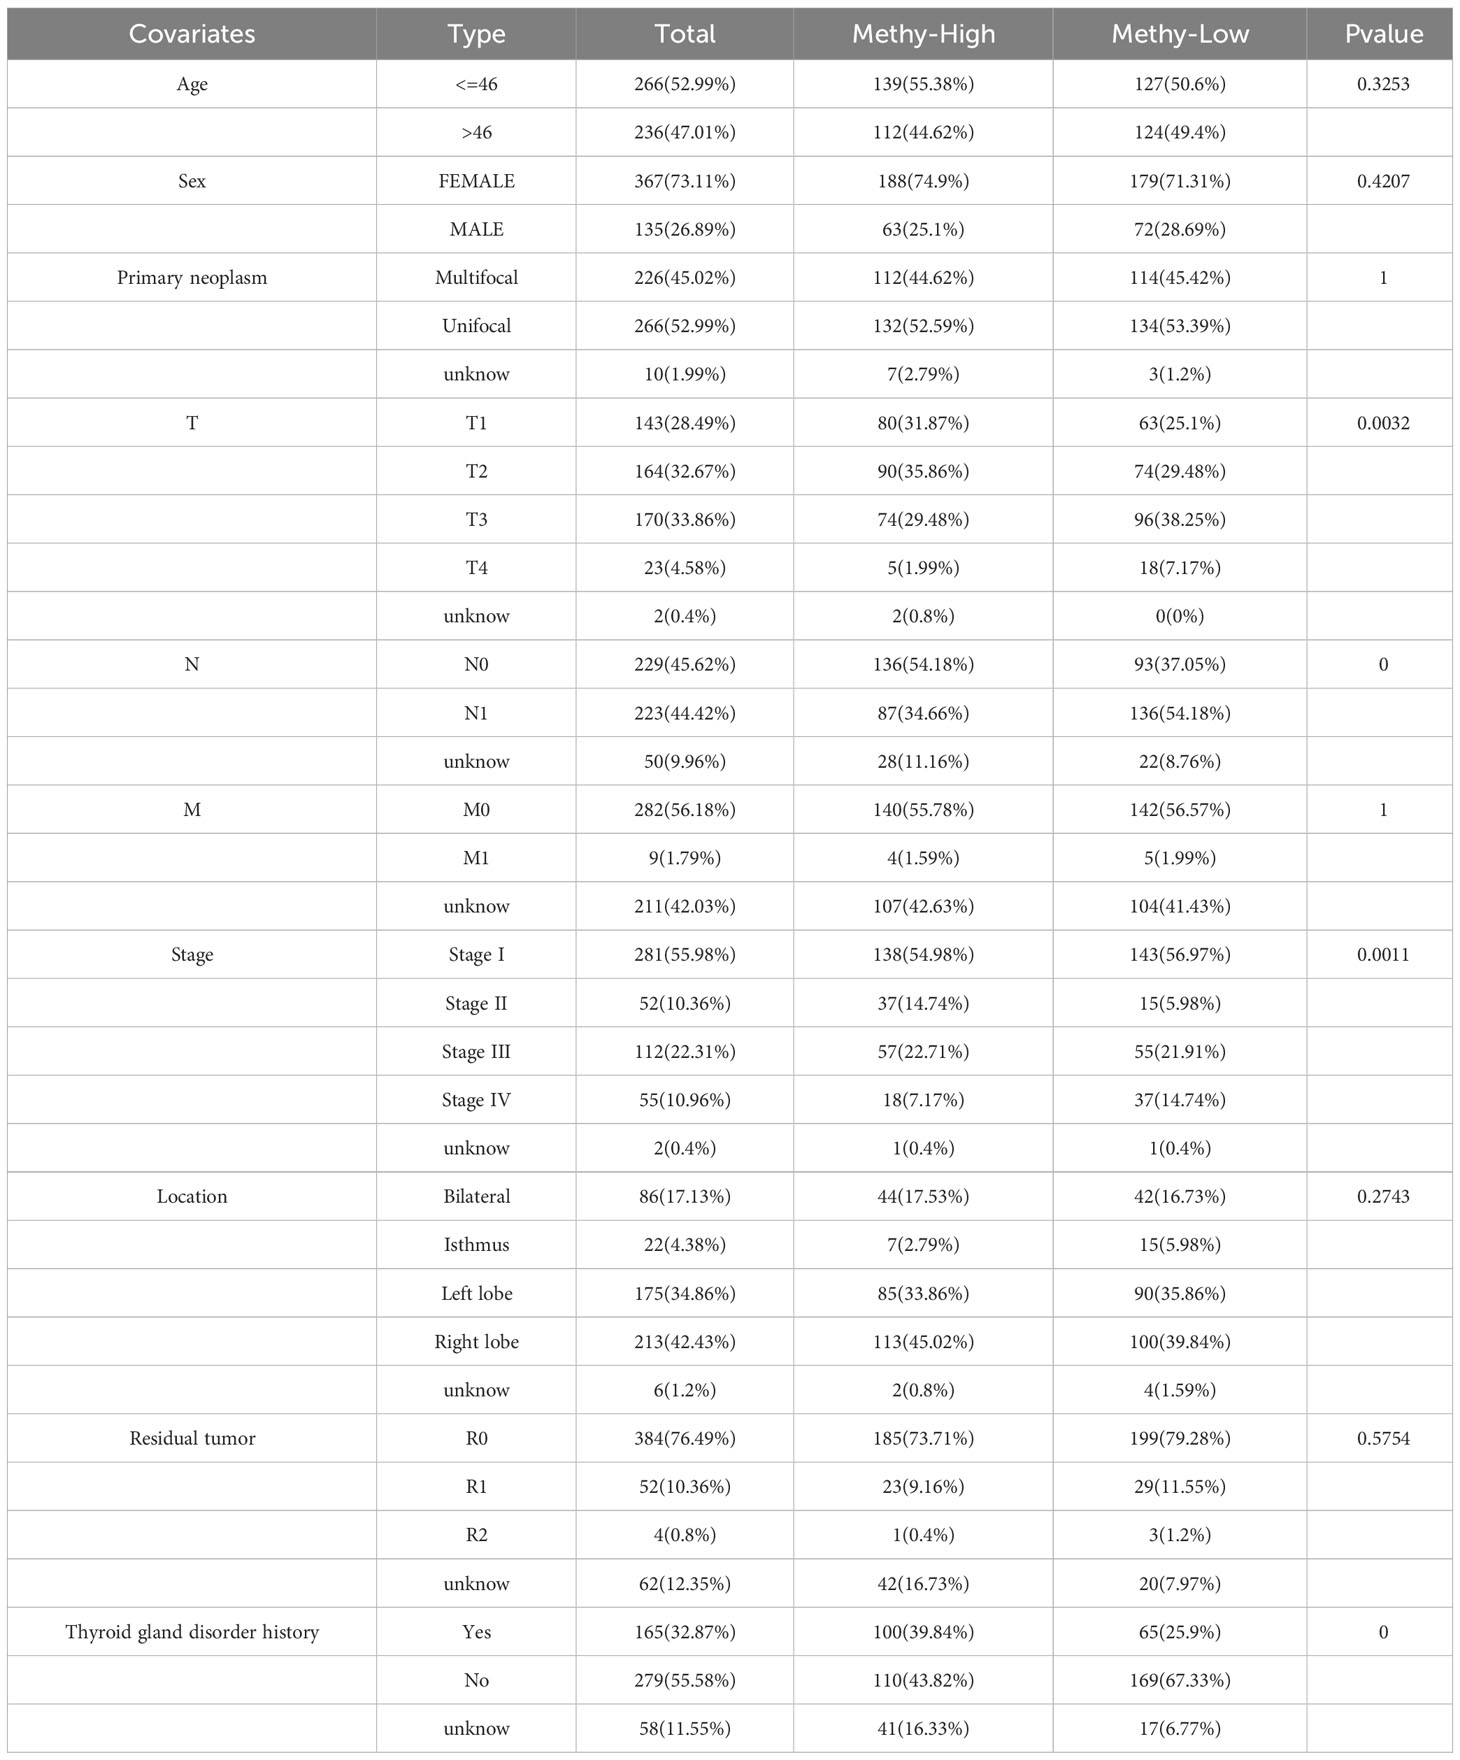
A pan-cancer analysis was conducted to investigate the DNA methylation levels of ERBB across various types of cancer (Supplementary Figure 5A). It was observed that the methylation levels of ERBB3 in the THCA samples were significantly lower than those in normal tissue, which partially explains the high expression of ERBB3 mRNA in THCA. The Shiny Methylation Analysis Resource Tool (SMART) was employed to annotate the methylation sites of ERBB3 (Supplementary Figures 5B, C). As anticipated, the methylation level of ERBB3 was notably higher in patients with low LNM potential, which could be a significant contributing factor impeding the expression level of ERBB3 mRNA in patients with low LNM potential (Supplementary Figure 5D; Table 3). Age and gender did not exhibit a significant effect on the degree of ERBB3 methylation (Supplementary Figure 5E). Patients who experienced LNM or were classified as T4 exhibited a diminished level of ERBB3 methylation, whereas stage II patients experienced an elevated amount of methylation. The occurrence of tumor metastasis, however, did not impact the degree of ERBB3 methylation (Supplementary Figures 5G–J). Furthermore, a tumor that develops in the isthmus or a patient with a history of thyroid gland disorder results in lower levels of ERBB3 methylation. The degree of ERBB3 methylation shows no significant correlation with the number of tumors or postoperative residual tumors (Supplementary Figures 5K–N).
Table 3 Clinical information of patients with high and low ERBB3 methylation levels.
Exploring EDCs, antineoplastic drugs, and environmental toxins that potentially influence the LNM potentialThe thyroid gland is regarded as one of the most crucial endocrine organs. The endocrine system has been demonstrated to impact the metastasis and prognosis of various endocrine organ tumors. Hence, we aspire to investigate whether certain EDCs can impact the LNM potential of THCA. Our analysis of the CTD database revealed a potential interaction between 14 types of EDCs and the key gene ERBB3 that can affect ERBB3 mRNA expression, implying their indirect impact on the LNM potential of THCA. The 14 types of EDCs identified consist of Benzo(a)pyrene, bisphenol A, Estradiol, Genistein, Progesterone, Copper, Tamoxifen, Ethinyl Estradiol, Arsenic, Diethylstilbestrol, Androgen Antagonists, Cadmium, Raloxifene Hydrochloride, and Androgens (Supplementary Table 10).
Moreover, we have identified several antineoplastic drugs that are already in clinical use that can disturb the gene expression level of ERBB3. These drugs include Capecitabine, Doxorubicin, Epirubicin, Erlotinib Hydrochloride, Etoposide, Fluorouracil, Lapatinib, Mitomycin, and Paclitaxel (Supplementary Table 10). Therefore, we can speculate that these anticancer drugs may have the potential to reduce the LNM potential of THCA and could represent a potential therapeutic option for patients with thyroid cancer who have already undergone LNM. These findings will be further validated in the next chapter of this study.
Additionally, there are other drugs and environmental toxins that have been found to interact with ERBB3. Therefore, our study suggests that it would be beneficial for patients with THCA to avoid exposure to these toxins or use these drugs with caution, thereby contributing to the refinement of clinical care protocols (Supplementary Table 10).
Validation of the diagnostic capability of ERBB3 for THCA and LNM potentialIn an independent validation set (GSE60542), we noted significant differential expression of 11 of the 12 previously identified hub genes, with the exception of ANPEP, between normal thyroid tissue and thyroid tumors (Supplementary Figure 6A). We noted a significant upregulation of ERBB3 expression in thyroid tumors in both the validation set and TCGA-THCA cohort. Furthermore, the immunohistochemical analysis revealed a significant elevation in protein expression levels of ERBB3 in thyroid tumors compared to normal thyroid tissue (Supplementary Figure 6B). In the GSE60542 cohort, our ROC analysis demonstrated that ERBB3 exhibits excellent discriminatory power for thyroid tumors (AUC=0.89; Supplementary Figure 6C). Notably, our results indicate a significant upregulation in ERBB3 expression levels in metastatic lymph nodes compared to normal lymphoid tissue (Supplementary Figure 6D). ERBB3 also exhibited excellent diagnostic efficacy for metastatic lymph nodes (Supplementary Figure 6E).
Exploration and validation of the therapeutic potential of ERBB3 in THCAThe subcellular localization of ERBB3 in tumor cells was investigated using ICC-IF and confocal microscopy techniques. ERBB3 was detected in the plasma membrane and actin filaments, and it is predicted to be secreted (Supplementary Figures 7A, B). The increased expression of ERBB3 in THCA, combined with its membrane localization, makes this protein an attractive target for cancer therapy.
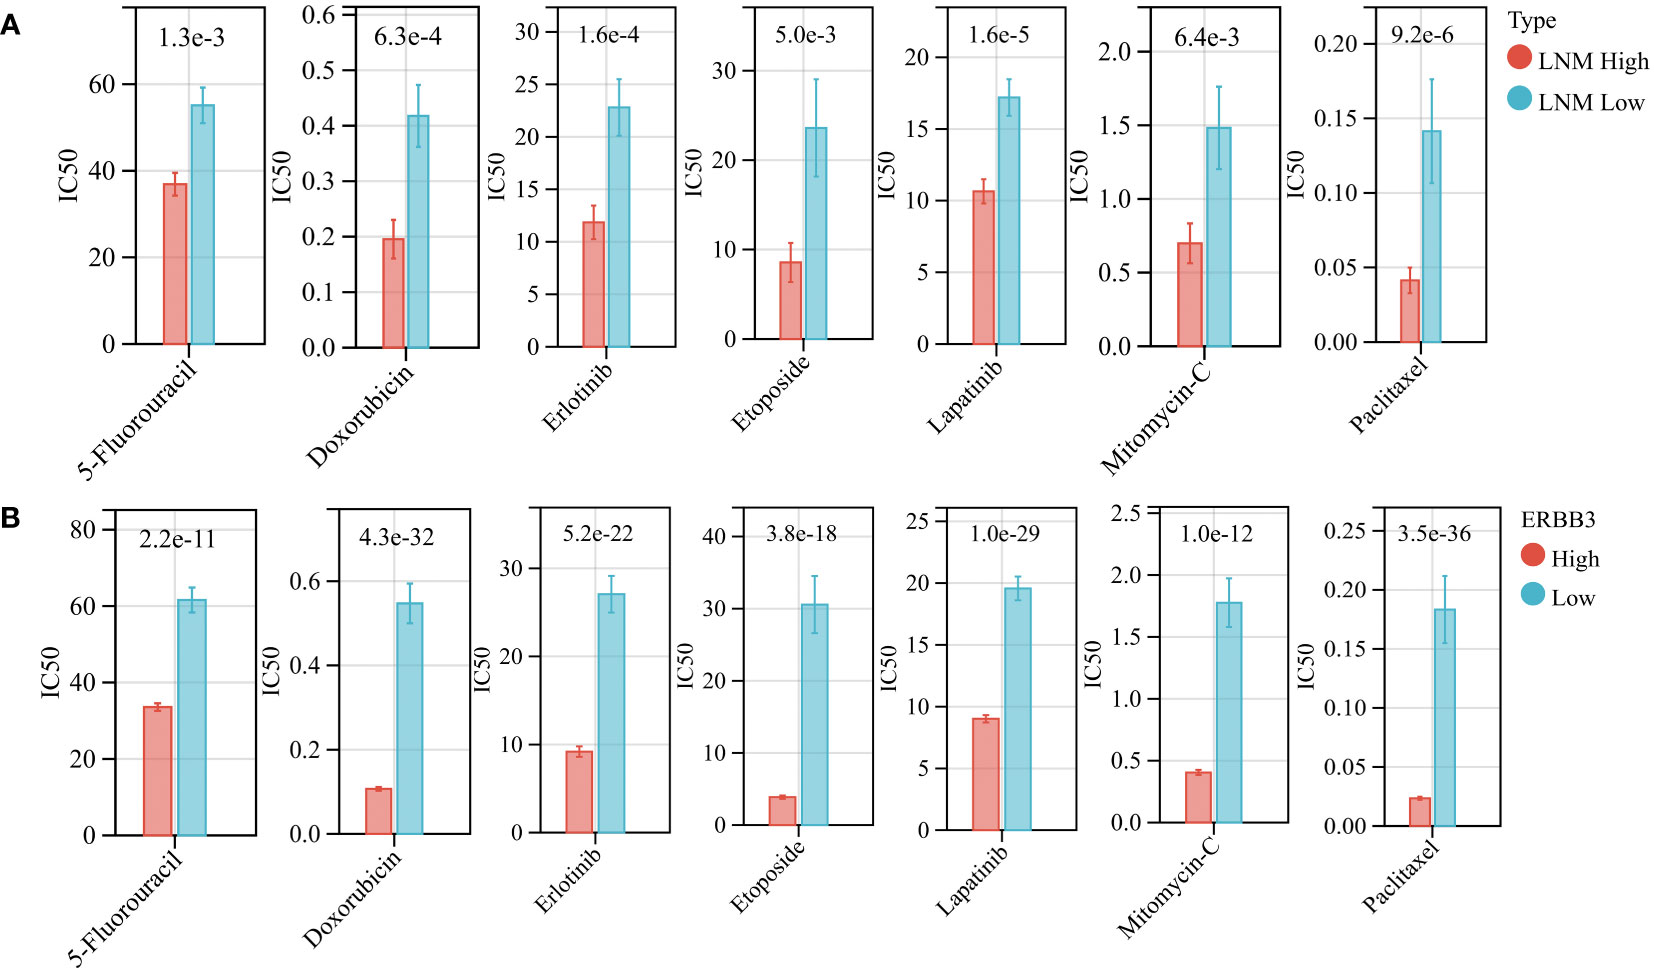
Using the “oncoPredict” algorithm and the GDSC database, we evaluated the sensitivity of all tumor samples in TCGA-THCA to the anti-tumor drugs identified as potentially impacting LNM potential. Patients with high LNM potential and high expression of ERBB3 have lower half-maximal inhibitory concentrations (IC50) for Capecitabine, Doxorubicin, Epirubicin, Erlotinib Hydrochloride, Etoposide, Fluorouracil, Lapatinib, Mitomycin, and Paclitaxel, indicating increased sensitivity (Figures 9A, B).
Figure 9 (A) The drug sensitivity of various anti-tumor drugs in patients with high and low LNM potential. (B) The drug sensitivity of various anti-tumor drugs in patients with high and low ERBB3 expression level.
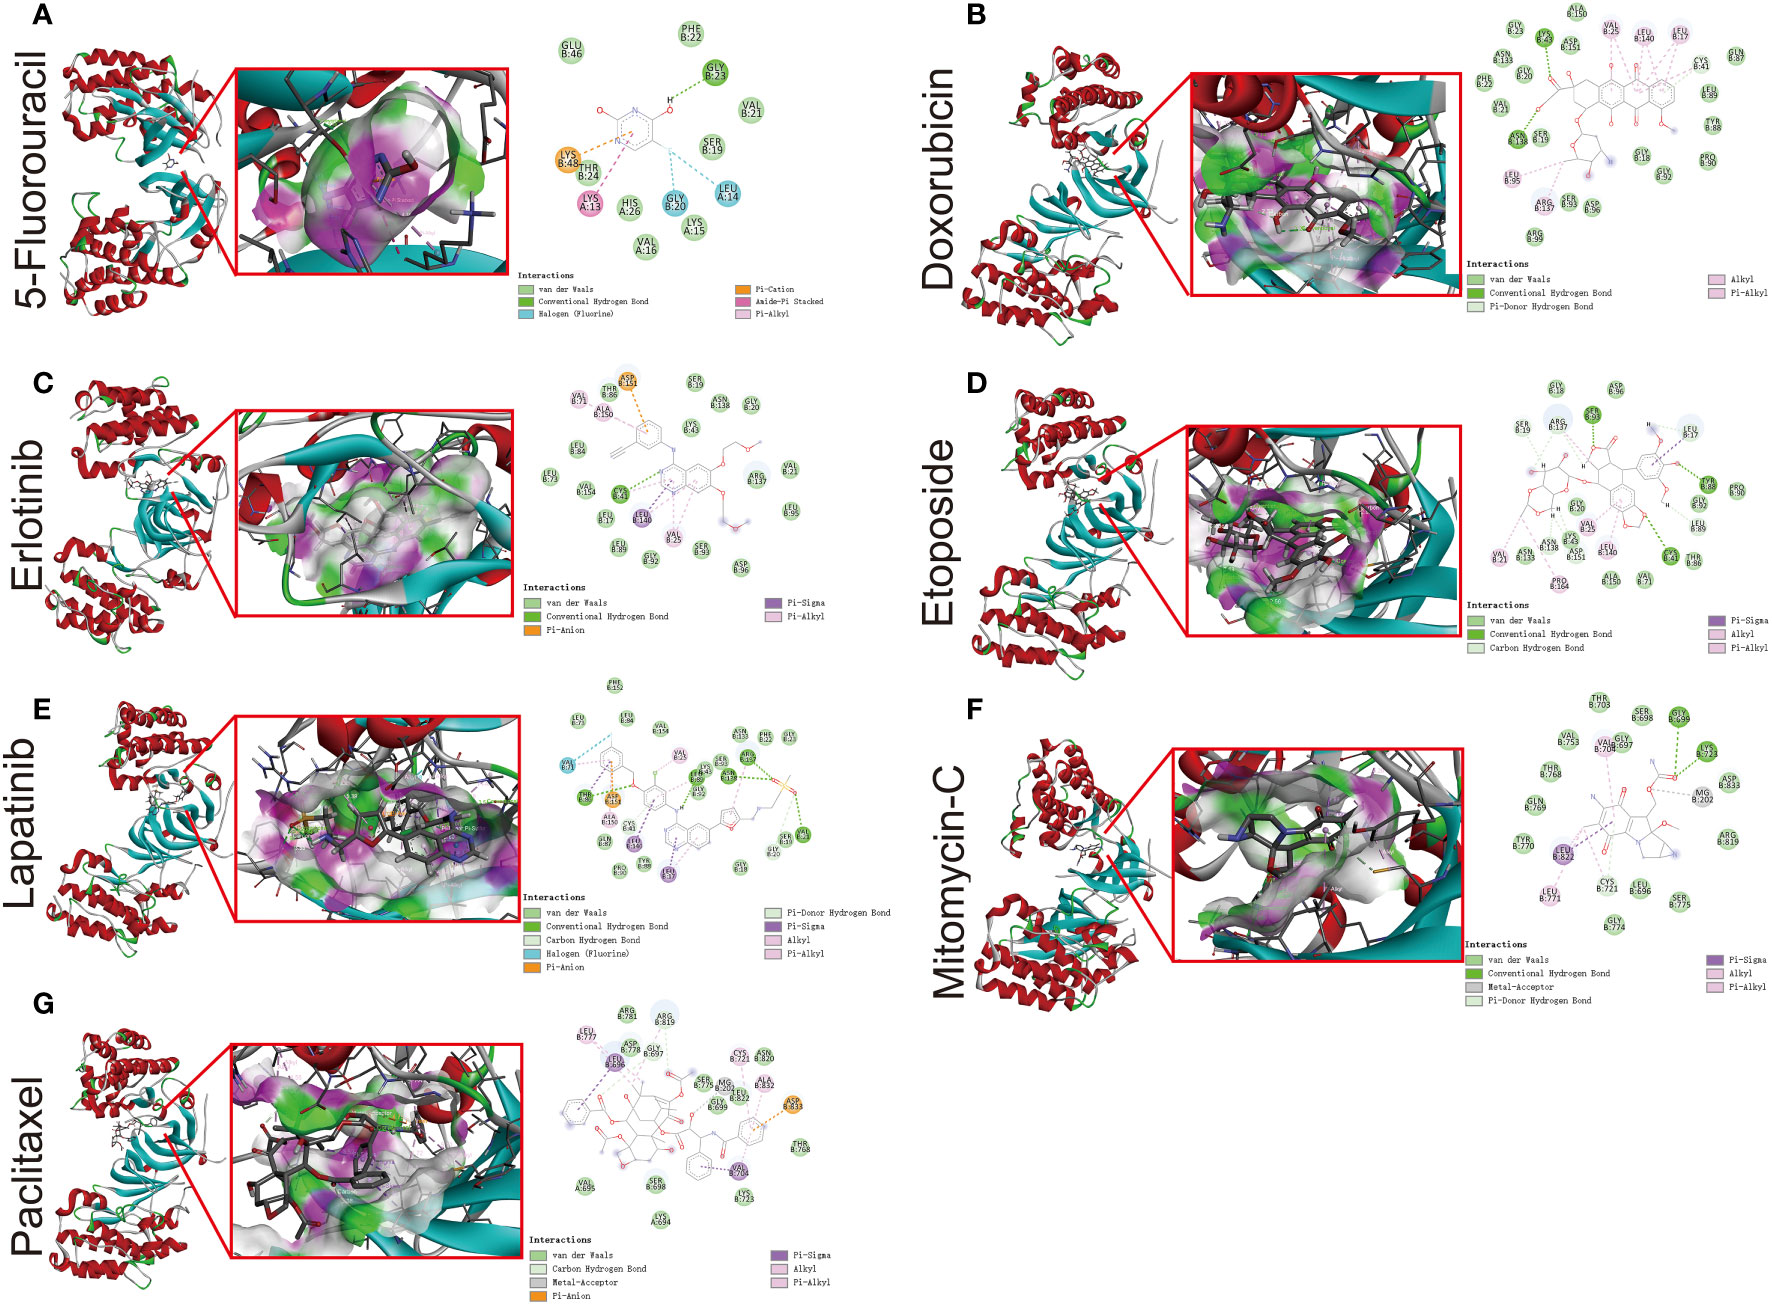
To further verify the strong correlation between ERBB3 and these potential therapeutic drugs, we performed molecular docking of these drugs with ERBB3. The three-dimensional and two-dimensional conformations of the molecular docking between Capecitabine, Doxorubicin, Epirubicin, Erlotinib Hydrochloride, Etoposide, Fluorouracil, Lapatinib, Mitomycin, and Paclitaxel with ERBB3 are shown in Figures 10A–G. The docking scores of Lapatinib, Etoposide, and Doxorubicin with ERBB3 are the most favorable, with values of -10.1 kcal/mol, -9.3 kcal/mol, and -8.8 kcal/mol, respectively.
Figure 10 Molecular docking simulation between ERBB3 and 5-Fluorouracil (A), Doxorubicin (B), Erlotinib (C), Etoposide (D), Lapatinib (E), Mitomycin-C (F), and Paclitaxel (G).
We further conducted a meta-analysis to validate the therapeutic potential of Lapatinib in tumor patients with LNM. Since there is a scarcity of research studies on the therapeutic effects of Lapatinib in the treatment of thyroid cancer, we focused our investigation on endocrine-related tumors instead. A total of five clinical studies were collected (Supplementary Figure 8A) (67–70). The heterogeneity test result of the rates of achieving PCR between lapatinib combination therapy and monotherapy group was (Q=23.4, P=0.0001, I2 = 83%) and the combined value of the estimated effect was [RR=1.48, 95% CI (1.19, 1.86); P=0.0005]. The funnel plot presented is not suggestive of publication bias (Supplementary Figure 8B). Our meta-analysis indicates that the treatment regimen incorporating Lapatinib is more effective in achieving pathological complete response (PCR) in patients with LNM.
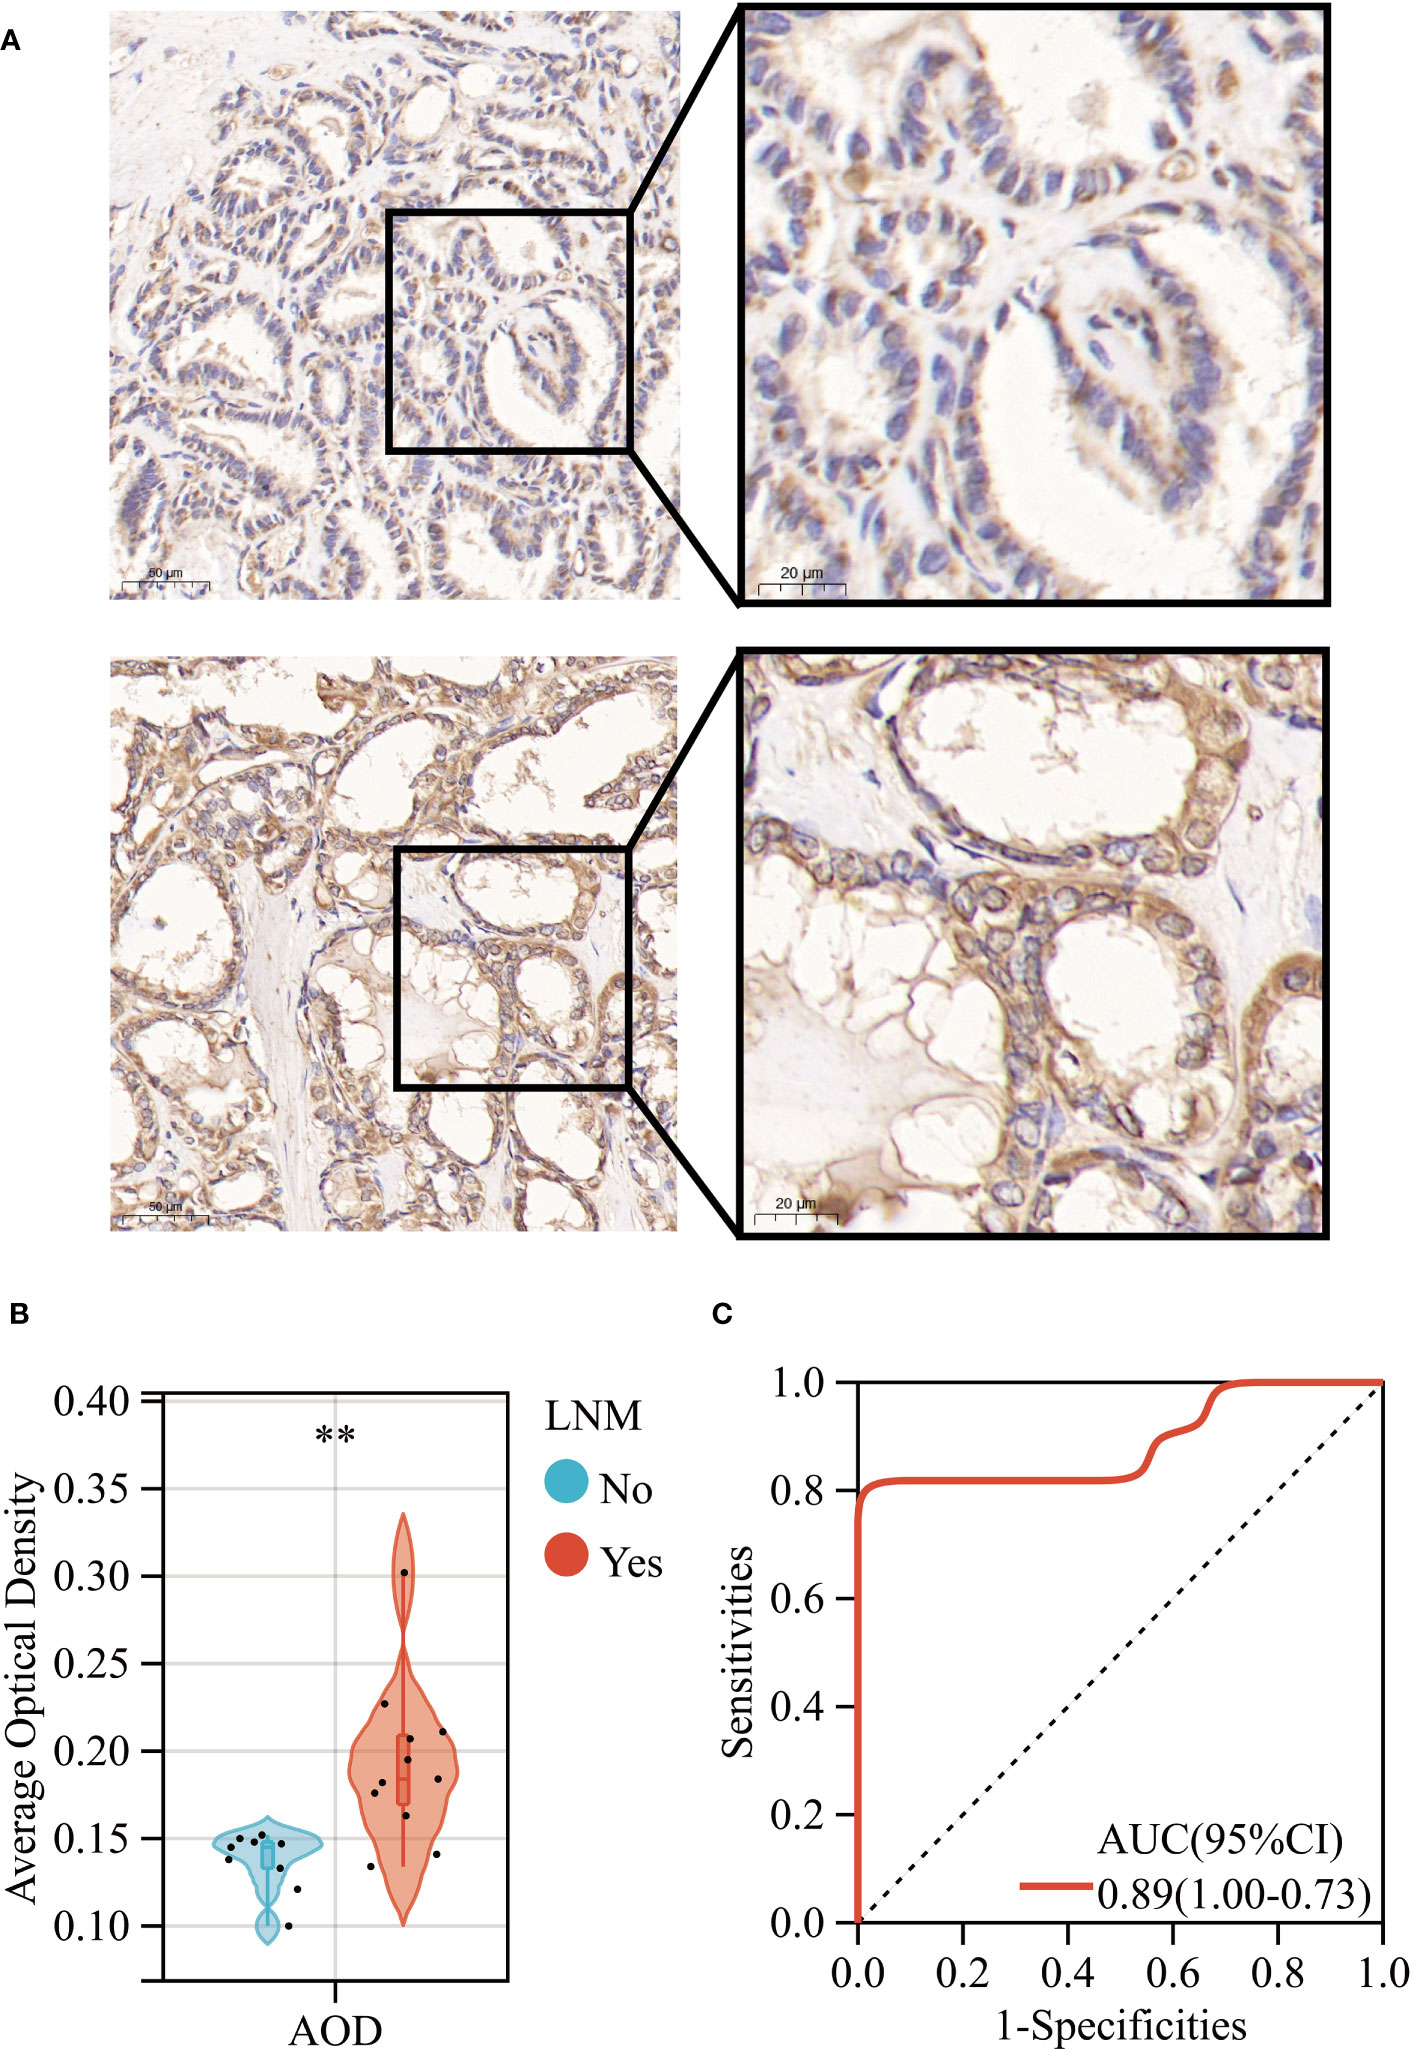
Experimental validation of expression levels of ERBB3 in THCA cases with and without LNMPrimarily, we observed a significant upregulation in the gene expression levels of ERBB3 in THCA samples that had experienced LNM through RT-qPCR experimental analysis (Supplementary Figure 9). Subsequently, our IHC results revealed that while ERBB3 protein was expressed in the cytoplasm of THCA cases without LNM, a significant increase in the expression levels of the ERBB3 protein was evident in THCA cases with LNM (Figure 11A). This was also quantified by the AOD values measured for different pathological slides, thus corroborating the findings (Figure 11B). Moreover, the ROC analysis indicated that the AOD values of ERBB3 protein immunohistochemical positive staining could serve as a promising diagnostic biomarker for determining the occurrence of lymph node metastasis in THCA cases (AUC=0.89, 95%CI 0.73-1.00; Figure 11C).
Figure 11 (A) Immunohistochemical expression levels of ERBB3 in THCA with (Lower) and without (Upper) lymph node metastasis. (B) AOD of ERBB3 protein immunohistochemical positive staining. (C) ROC curves of the AOD of ERBB3 protein for predicting LNM in THCA. **: p<0.01.
DiscussionLNM, particularly in the cervical region, is a common pathological feature encountered in THCA and may manifest in the early stages of the disease. In this study, we introduce a novel concept - LNM potential - aimed at elucidating the genetic basis of this phenomenon. Additionally, we employ a diverse range of bioinformatics analysis techniques, including WGCNA, machine learning, and molecular docking, to pinpoint the key gene underlying LNM potential and explore potentially therapeutic drugs targeting this gene.
Our study identified 12 hub genes as a potential high-risk biomarker for LNM in THCA. Simultaneously, we explored the association between the 12 hub genes and the biological processes and immune infiltration in THCA. Regardless of whether in THCA or pan-cancer, hub genes were significantly associated with the decrease of neutrophils and the increase of DC and macrophages in tumors. Considerable research has demonstrated the utility of neutrophil-to-lymphocyte ratio (NLR) in predicting lymph node metastasis in multiple types of cancer (71–74). The study conducted by Hiromu Fujita et al. revealed that the accumulation of neutrophils, especially CD16b-positive neutrophils, in the peritumoral region is an independent factor contributing to lymph node metastasis (75). Notably, the authors’ research was centered on thoracic esophageal squamous cell carcinoma (75). The investigations undertaken by Yuandong Liao et al. demonstrate that STC1-dependent immune escape from macrophage phagocytosis can be suppressed by the inhibition of competitive interaction between LNMAS and HMGB1, resulting in the abrogation of TWIST1 and STC1 chromatin accessibility, thereby suppressing cervical cancer lymph node metastasis (76). DC cells, as professional antigen-presenting cells, are responsible for presenting cancer-associated antigens to the adaptive immune system in the sentinel lymph nodes (77, 78). It has been observed that sentinel lymph nodes with macrometastases in cancer patients exhibit arrested maturation of dendritic cells, fewer interactions between mature dendritic cells and cytotoxic T cells, and an increased population of regulatory T cells, as opposed to sentinel lymph nodes without metastasis. However, these observations were not made when compared to healthy controls (79). Therefore, the physiological basis for the influence of hub genes on the lymph node metastatic potential of THCA lies in the observed differences in immune cell infiltration associated with these hub genes, particularly in neutrophils, DC cells, and macrophages. However, it is important to note that this study is based on bioinformatics techniques for estimating immune cell infiltration within tumors. Further in-depth experiments, such as flow cytometry and immunofluorescence, are required for the validation of clinical samples. Additionally, it’s worth mentioning that ITGA3, one of the 12 Hub genes we identified, has been found to serve as a biomarker of progression and recurrence in THCA (80). The results of the CCK-8 experiment conducted by Jizong Zhang et al. indicate that overexpression of ITGA3 significantly enhances the proliferation capability of thyroid cancer cell lines. Additionally, it markedly augments their invasive and migratory abilities (81).
It is worth noting that our pan-cancer analysis indicates a close correlation between the activation of these 12 hub genes and the oncological feature of EMT, a critical step in tumor invasion and metastasis (82). In particular, SNAI1 and FN1 were found to be positively correlated with EMT activation in more than half of the tumor types analyzed. Consistent with previous research, SNAI1 was identified as the first and most extensively studied transcription repressor of CDH1, a hallmark of EMT encoded by the epithelial gene encoding E-cadherin. Direct binding of SNAI1 to the E-boxes present in the CDH1 promoter leads to transcriptional repression of CDH1 expression (83). SNAI1 is an EMT regulatory factor that has been widely reported, which is consistent with our research findings. In cancer-associated EMT, SNAI1 serves as an imperative factor in driving the transition by strongly repressing E-cadherin and tight junction components (claudins), while also upregulating mesenchymal marker proteins, including vimentin and fibronectin (84). The study by Haihai Liang et al. revealed that knockdown of PTAL resulted in increased expression of miR-101 and consequent inhibition of FN1 expression, ultimately leading to upregulation of EMT, which in turn promoted the migration of OvCa cells (85). Thus, EMT represents another potential biological basis for the hub genes we have identified that can affect the LNM potential of THCA (86). In general, the identification of these hub genes provides a valuable and significant resource for further understanding and exploring the phenomenon of early LNM in THCA.
Furthermore, we have developed a nomogram capable of accurately predicting the likelihood of LNM in THCA patients. Additionally, we have established a web-based tool to access this nomogram’s prediction model. The nomogram presented in this study can be easily utilized in clinical practice through our web-based tool, offering valuable resources and guidance for the formulation of clinical treatment and care strategies for THCA patients (87, 88).
Subsequently, employing an integrative analysis of three machine learning techniques, we identify ERBB3 as the key gene influencing LNM potential. ErbB/HER receptor tyrosine kinases (RTKs) occupy a crucial position in animal development, and their dysfunctional operation may catalyze the pathophysiological progression of certain tumor types (89, 90). In mammals, the existence of four ErbB/HER receptors is expounded: the epidermal growth factor receptor (EGFR/HER1), HER2/ErbB2/neu, HER3/ErbB3, and HER4/ErbB4 (91). Physiological expression of these receptors has been reported in epithelial, mesenchymal, cardiac, and neuronal tissues. The gene ERBB3 codes for HER3, a discovery credited to Kraus et al. in 1989 (92). Located on human chromosome 12q13, HER3 exhibits a wide expression across adult human tissues, including cells from the reproductive, endocrine, urinary, gastrointestinal, respiratory, skin, and nervous systems (93–96). Structurally, HER3 comprises an extensive extracellular domain (ECD), an individual hydrophobic transmembrane segment, and an intracellular domain, which comprises a tyrosine-rich carboxyterminal tail, a juxtamembrane region, and a tyrosine kinase segment (97–99). Featuring four subdomains, the HER3 extracellular domain is known as subdomains I-IV. ERBB3 expression has been discovered to be upregulated in numerous types of tumors, including but not limited to breast, ovarian, lung, colon, pancreatic, melanoma, gastric, head and neck, and prostate cancers (100–105). In additional reports, targeting ERBB3, such as gene knockdown and knockout, has also been shown to impact the proliferation and migration of thyroid cancer. This implies that targeting ERBB3 may become one of the potential therapeutic targets for thyroid cancer (106). Notably, there exists limited research on ERBB3 in THCA, and at present, no studies have reported the potential biological functions of ERBB3 in THCA lymph node metastasis.
The gene expression level of ERBB3 has been found to be associated with distinct clinical characteristics of THCA, particularly the occurrence of LNM. Aberrant methylation of the gene promoter is a significant cause of deactivation (107–109). To further investigate the underlying mechanisms of ERBB3 gene expression alterations, our attention was directed towards the variation in methylation levels of ERBB3. Notably, clinical traits associated with upregulation of ERBB3 mRNA expression were always accompanied by decreased levels of ERBB3 methylation, and vice versa. Hence, the downregulation of ERBB3 gene expression is partly attributed to CpG island hypermethylation in its promoter region (104,
Comments (0)