
Remember me
Gallbladder cancer (GC) refers to the most common malignant neoplasms in the biliary system, which is characterized by insidious symptoms, rapid development, early metastasis and weak prognosis, and its incidence and death rate have been increasing slowly in recent years [1]. At present, there is still a lack of early diagnosis means with good specificity and sensitivity for GC, and most of the GCs found clinically are in the middle and late stages [2]. Since the gallbladder is adjacent to the liver, gallbladder neoplasms often invade and metastasize to the liver, which makes prognosis prediction and treatment more difficult.
Currently, the 8th edition of the American Joint Committee on Cancer staging system (TNM staging system) is used the most broadly in order to assess the prognosis of confirmed cases with GC [3]. Nevertheless, there’s a limitation in that the clinicopathological and therapeutic information is ignored in the TNM staging system [4]. If the liver metastasis has been diagnosed clinically, it’s usually regarded as a late stage of GC liver metastasis (GCLM). Also, it’s impossible to predict the prognosis by the conventional TNM staging. Therefore, there is an imperative need for more precise prognostic models to impart clinical decision to patients suffering from GCLM. Recently, the nomograph has been extensively used as a prediction approach for oncology, which has been proved to have better predictive ability than conventional TNM classification [5]. In the former study [6,7], the nomogram model showed good discrimination for patients with GC as well. However, to date, there haven’t been studies on the nomograph prediction model of GCLM.
Through the retrospective analysis of confirmed cases from 2010 to 2019, the prediction model of GCLM is constructed on the basis of the Surveillance Epidemiology and the End Results database (SEER). And its reliability and feasibility have been assessed through an independent validation cohort.
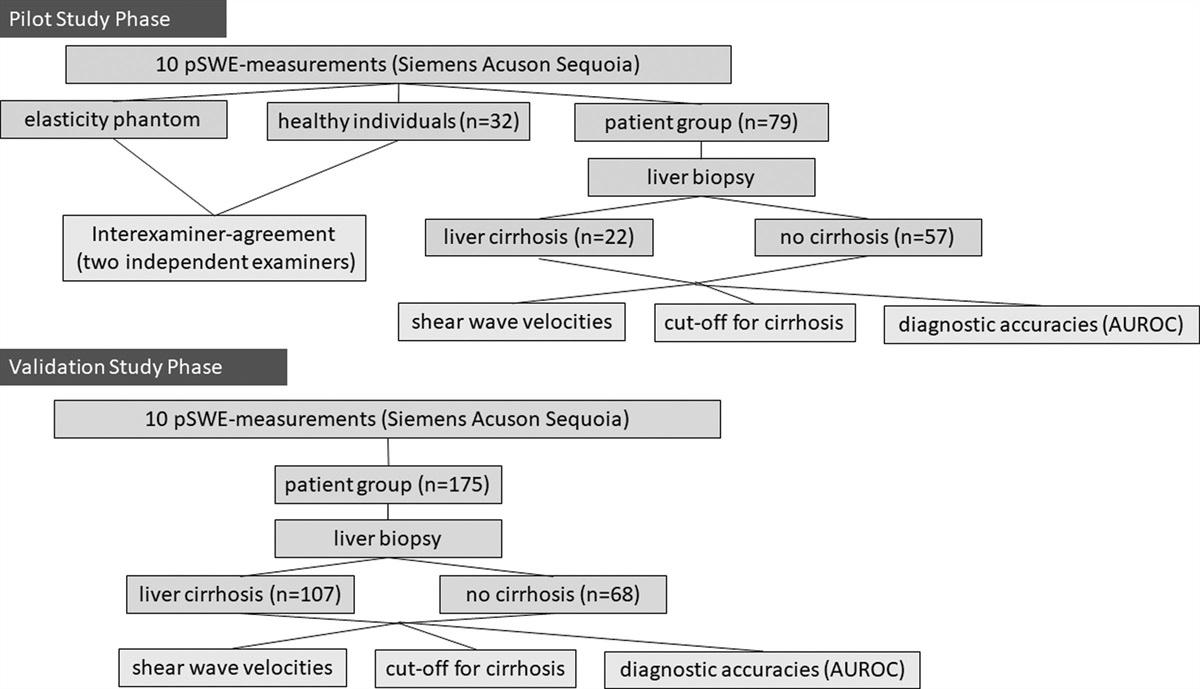
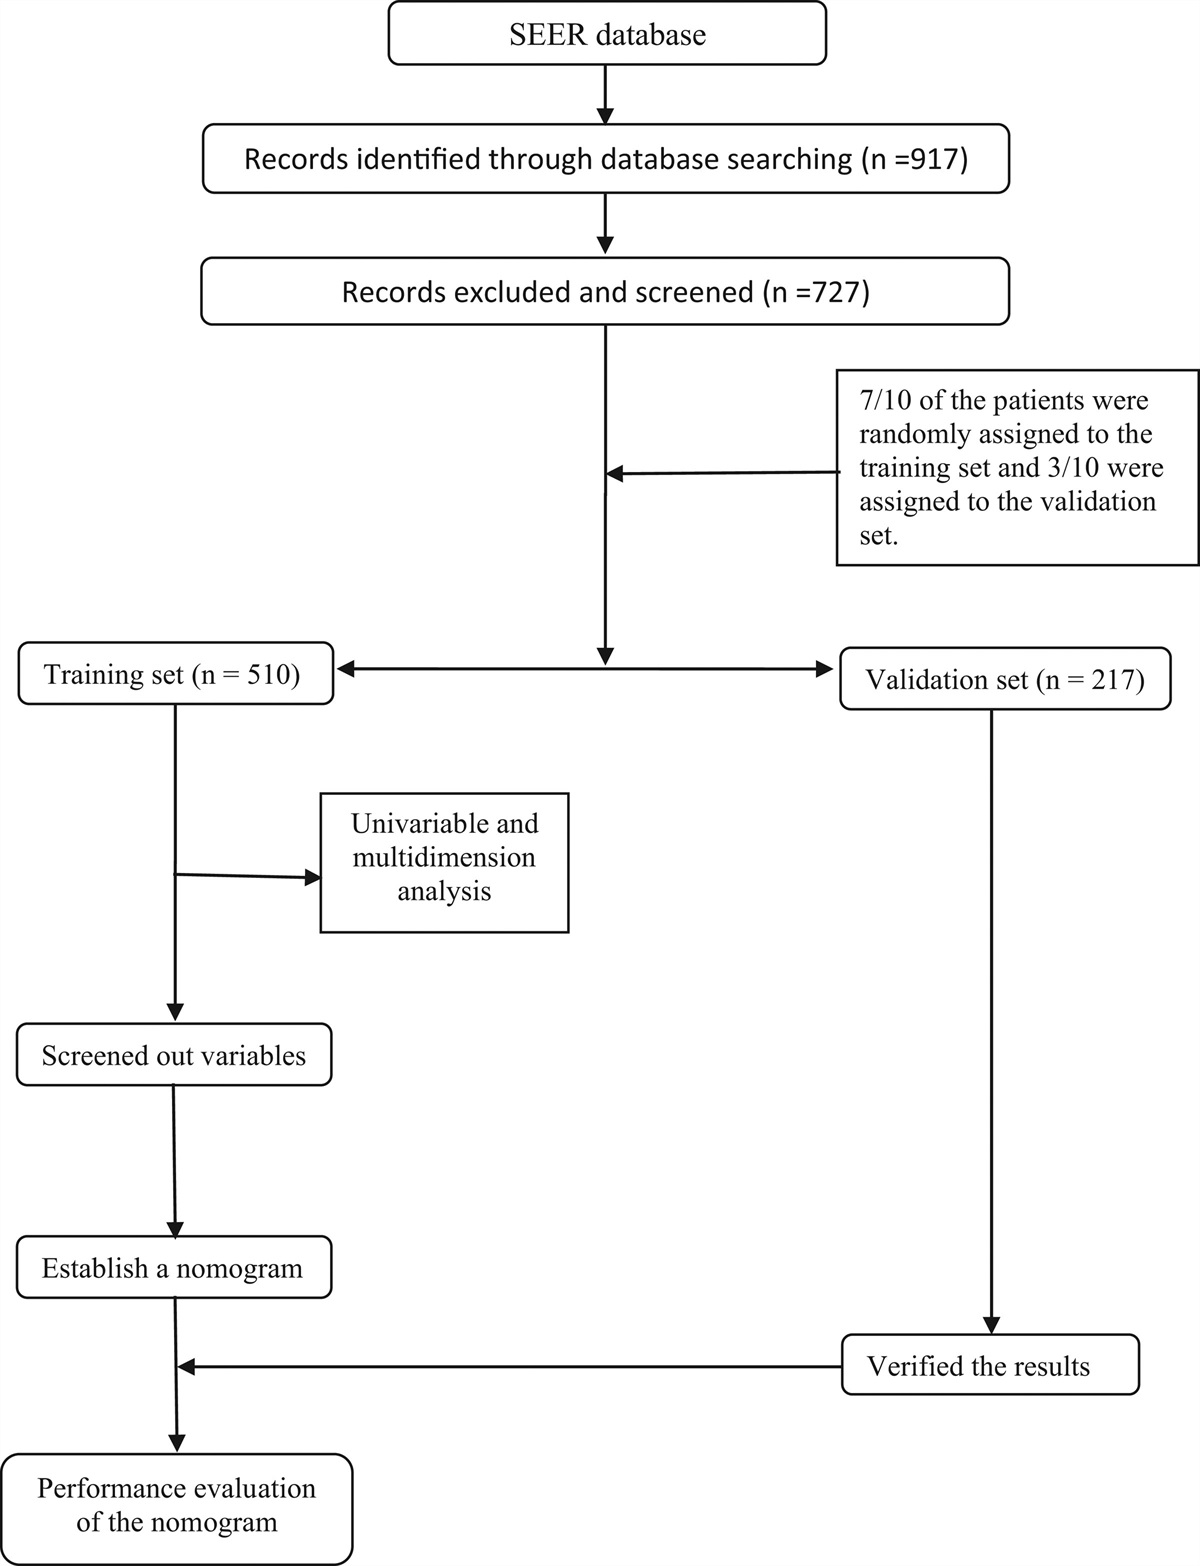
Materials and methods Patient selectionFor the GCLM in this study, the exclusion criteria are as follows: tumors of multiple origins; incomplete tumor type, differentiation and staging; incomplete follow-up information; patients lacking a clear pathological diagnosis; patients with incomplete information; patients whose first tumor was a non-primary GC; and patients aged ≥80 years or <20 years. The selection criteria and screening process are illustrated in Fig. 1.
 Fig. 1.:
 Flowchart of patient enrollment and study procedure.
Data extractionOn the basis of the inclusion and exclusion criteria, the SEER*Stat 8.4.0 software was used to search for the information on confirmed cases in the SEER database, which includes the patient ID, year, gender, race, marital status, age at diagnosis, average household income, the type of pathology, whether the patient received timely treatment, whether the patient had pulmonary bone and brain metastasis, whether the patient was operated, whether the patient received radiotherapy, whether the patient received chemotherapy, and follow-up situations, etc. The extracted data were recoded. Gallbladder cancer-specific survival (CSS) refers to the patient’s survival time from the diagnosis with GC to the death of GC. The survival situation is recorded in accordance with the latest follow-up. On the basis of the above inclusion and exclusion criteria, patients with GCLM who were registered in the SEER database between 2010 and 2019 were included in the study for retrospective analysis.
Statistical analysisThe study was statistically analyzed in its entirety using R software. The confirmed cases were divided into 2 groups, the training set and the validation set, in a ratio of 7:3 to make sure the outcome event (dead or alive) was randomly distributed between the 2 data groups. A chi-square test was used for comparing the baseline data between the 2 groups (in Table 1 for details). For the training group data, univariate analysis was employed, and factors with P < 0.05 were further included in multifactor Cox regression analysis to screen out the factor with P < 0.05 as predictors. Based on the predictors, R called the ‘rms’ package to construct the COX proportional risk model function and applied the Nomogram tool to build the survival prediction model. Internal and external validation were performed using C-index, calibration curve, receiver operating characteristic curve and decision curve analysis (DCA) in the training set and the validation set, separately, to test the distinction and consistency of this model. All statistical tests were bilateral, and P-value (<0.05) was statistically significant.
Table 1. - Characteristics of the training set and validation set Training cohort (N = 510) Validation cohort (N = 217) P-value Age ≤65 234 (45.9%) 100 (46.1%) 1 >65 276 (54.1%) 117 (53.9%) Sex Female 366 (71.8%) 135 (62.2%) 0.011 Male 144 (28.2%) 82 (37.8%) Race White 341 (66.9%) 155 (71.4%) 0.243 Black 72 (14.1%) 32 (14.7%) Other 97 (19.0%) 30 (13.8%) Marital Married 283 (55.5%) 115 (53.0%) 0.567 Not married 227 (44.5%) 102 (47.0%) Household_income <65 000$ 170 (33.3%) 63 (29.0%) 0.251 ≥65 000$ 340 (66.7%) 154 (71.0%) Histology Adenocarcinoma 410(80.4%) 166(76.5%) 0.273 No-adenocarcinoma 100 (19.6%) 51 (23.5%) Msite bone No/unknown 470 (92.2%) 204 (94.0%) 0.443 Yes 40(7.8%) 13(6.0%) Msite lung No/unknown 440 (86.3%) 193 (88.9%) 0.339 Yes 70 (13.7%) 24 (11.1%) Msite brain No/unknown 505 (99.0%) 217 (100%) 0.333 Yes 5 (1.0%) 0 (0%) Delayed treatment None 187 (36.7%) 74 (34.1%) 0.733 <1 month 140 (27.5%) 61 (28.1%) ≥1 month 45 (8.8%) 16 (7.4%) NA/unknown 138 (27.1%) 66 (30.4%) Training cohort(N = 510) Validation cohort(N = 217) P-value PTR No/unknown 382 (74.9%) 161 (74.2%) 0.866 Yes 128 (25.1%) 56 (25.8%) Chemotherapy No/unknown 207 (40.6%) 95 (43.8%) 0.463 Yes 303 (59.4%) 122 (56.2%) Radiation No/unknown 481 (94.3%) 208 (95.9%) 0.482 Yes 29 (5.7%) 9 (4.1%)A total of 727 confirmed cases of GCLM diagnosed between 2010 and 2019 were screened out from the SEER database. After randomization of all patients in a 7:3 ratio, there were 510 confirmed cases in the training set and 217 confirmed cases in the validation set. No statistically significant differences were shown in demographics, pathological characteristics and treatment information between the 2 sets (P > 0.05), as detailed in Table 1, indicating no obvious difference between the 2 groups.
Screening out prognostic factorsUnivariate analysis indicated that factors affecting CSS comprised delayed treatment, bone metastasis, surgery, chemotherapy and radiotherapy (all P < 0.05). Based on Cox regression, multivariate analysis included the remarkable factors from the univariate analysis. Bone metastasis, surgery, chemotherapy and radiotherapy (P < 0.05). Table 2 indicates the outcomes of univariate versus multivariate analyses. On the basis of the Kaplan–Meier approach as well as Cox regression model, the 4 factors were selected for model construction: bone metastasis, surgery, chemotherapy and radiotherapy.
Table 2. - Univariate and multivariate analysis of this study Variable Univariate analysis Multivariate analysis HR (95% CI) P-value HR (95% CI) P-value Age >65 1.08 (0.89–1.31) 0.414 - - Chemotherapy, yes 0.43 (0.35–0.52) 0 0.42 (0.3–0.59) 0 Delayed treatment <1 month 1.2 (0.94–1.52) 0.145 0.96 (0.72–1.28) 0.7605 Delayed treatment ≥1 month 0.82 (0.57–1.18) 0.28 0.69 (0.47–1.03) 0.0715 Delayed treatment NA/unknown 2.85 (2.22–3.66) 0 0.97 (0.62–1.51) 0.8861 Histology, no-adenocarcinoma 1.04 (0.82–1.33) 0.749 - - Household income ≥65 000$ 0.89 (0.73–1.09) 0.244 - - Marital, not married 1.13 (0.94–1.37) 0.195 - - Msite bone, yes 1.45 (1.03–2.04) 0.033 1.56 (1.1–2.23) 0.0137 Msite_brain, yes 1.5 (0.48–4.67) 0.486 - - Msite_lung, yes 1.24 (0.94–1.63) 0.133 - - PTR, yes 0.57 (0.45–0.72) 0 0.52 (0.37–0.73) 0.0002 Race, black 0.92 (0.7–1.22) 0.578 - - Race, other 0.85 (0.66–1.09) 0.191 - - Radiation, yes 0.46 (0.29–0.72) 0.001 0.62 (0.39–0.98) 0.0426 Sex, male 1 (0.81–1.24) 0.973 - -The bold represents that the P-values are less than 0.05.
CI, confidence interval; HR hazard ratio.
In the nomogram model, four independent prognostic factors were selected as variables. and we constructed a prediction model using R software for predicting the median survival time, 6-month CSS, 1-year CSS, and 2-year CSS (results are shown in Fig. 2). The results showed bone metastasis (yes score 4.9, no/unknown score 0), surgery (yes score 0, no/unknown score 6.75), chemotherapy (yes score 0, no/unknown score 10) and radiotherapy (yes score 0, no/unknown score 5.5). As is seen in the nomograph, the higher the total score is, the lower the CSS and the median survival time are. We got the total score by summing the scores of each factor and then referring to the prediction model to get the more accurate median survival time and CSS rate (Fig. 2).
 Fig. 2.:
 Prognostic model for patients with liver-metastatic gallbladder cancer.
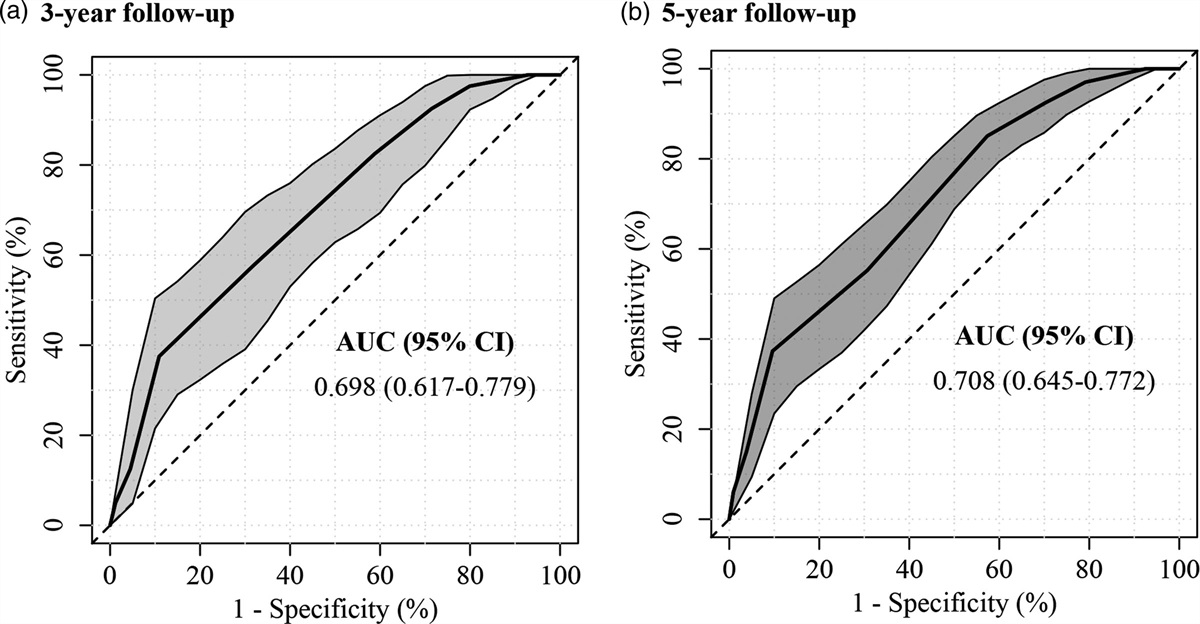
Calibration and validation of the nomogramThe nomograph model was further calibrated and validated. Figure 3 shows the calibration curves of the nomogram at 6 months CSS, 1-year CSS and 2-years CSS, which confirms the high consistency between the predicted CSS and actual CSS in training and validation groups. The C-index in training and validation cohorts were 0.688 and 0.708, respectively. In the ROC curve of the training set, the area under the curve (AUC) for 6-month CSS, 1-year CSS, and 2-year CSS were 0.759, 0.701 and 0.713, respectively. In the ROC curve of the validation set, the AUC for 6-month CSS, 1-year CSS, and 2-year CSS were 0.773, 0.666 and 0.618, respectively. Besides, the ROC curve also indicated the high authenticity of the prediction model (Fig. 4). In addition, the DCA curve of nomogram exhibited a wider range of threshold probabilities at 6-month, 1-year and 2 years (Fig. 5). In conclusion, the outcome indicated that our constructed nomograms have identification and calibration abilities.
 Fig. 3.:
 The calibration curve for comparing survival predicted by the model with actual observed survival.
 Fig. 4.:
 The time-dependent ROC curve for predicting patients’ CSS at 6 months, 1 year and 2 years.
 Fig. 5.:
 Decision curve analysis of the nomogram in the training cohort (a) and validation cohort (b).
Discussion Summary of main resultsWhen gallbladder tumors locally infiltrated into the liver, they were often combined with vascular invasion and extensive metastasis of regional lymph nodes, or even distant metastasis, with a high degree of malignancy and a rather poor prognosis. Improving the prognosis and prolonging the survival time of the confirmed cases had been a long-standing goal of biliary surgeons. The bleak prognosis of GCLM was mainly due to the inability to diagnose and manage it as early as possible. Although GCLM was classified as stage M1 in TNM staging, the prognosis of patients with tumors remains heterogeneous because of distinctions in age, metastatic organs, and cures. Nevertheless, to date, there’s no available prognostic nomograph for M1 stage in GCLM. In this research, we developed and validated a prognostic nomogram for confirmed cases with GCLM, using a large population data as the study population. The factors in the nomogram are available from clinical data. In addition, we verified the good performance of the nomograph through various validations. More importantly, it can also be greatly convenient to patients and clinicians.
In the research, the clinicopathological data of 727confirmed cases with GCLM from the US SEER database from 2010 to 2019 were retrospectively analyzed to four independent prognostic factors, including bone metastasis, surgery, chemo derive therapy, and radiotherapy, which affected the survival prognosis of patients with GCLM from a large sample and multicenter perspective. Based on these independent prognostic factors, the survival model of GCLM was established using R software, and the unique visualization of the model could help biliary surgeons visualize the contribution of every factor to the prognostic survival of confirmed cases. In addition, based on the model, the mean survival time, 6-month CSS, 1-year CSS and 2-year CSS could be calculated easily.
In the era of precision medicine treatment, the model is a practical and easy clinical prediction tool that fills the gap in the prognosis of confirmed cases suffering from GCLM. For specific clinical applications, when the prognosis of a patient is evaluated according to the model, if the CSS of that patient is low and the prognosis is poor, as a clinician, a closer follow-up plan can be made for the patient and more aggressive treatment such as radiotherapy and chemotherapy can be administered.
Potential limitations in the study In the SEER database, there is no detailed information on documenting adjuvant chemotherapy and neoadjuvant therapy (including treatment regimens, cycles, etc.), which is likely to influence the precision of assessing prognosis. In the SEER database, the surgical procedure, the surgeon, and the pathologist for surgical specimen detection are not described in detail. This is because radical versus palliative surgery can have a significant influence on the survival prognosis of confirmed cases. In the SEER database, there isn’t information on postoperative treatments for confirmed cases, such as retreatment after tumor recurrence and metastasis, targeted therapy, etc., which are key factors affecting the survival prognosis of confirmed cases. The research is a retrospective study, and there may be some selection bias. The data used in the research were obtained from the SEER database with a North American population, and there may be bias when applied to the Asian population.In conclusion, the research aimed to construct a prognostic prediction model for GCLM, and a more accurate and effective prediction nomograph was constructed by means of retrospectively analyzing the SEER database. Despite certain shortcomings, the study will provide research ideas to achieve more accurate prediction of prognosis and provide a basis for implementing accurate individualized cure and implementing prospective clinical studies. The research is a retrospective study with some bias, so a large sample, prospective, multicenter randomized controlled trial is needed to offer more precise data to improve and update this model.
ConclusionIn conclusion, we successfully established a nomograph model to predict the median survival time and CSS of GCLM patients. Our nomogram model has high discrimination and good concordance, and has excellent clinical application value.
AcknowledgementsThis work was supported by grants from the Fujian Provincial Clinical Medical Research Center for First Aid and Rehabilitation in Orthopaedic Trauma (2020Y2014) of China.
Woods Zhang wrote the main manuscript text and prepared all the figures and tables. Woods Zhang, Zhitian Chen and Benzhong Sa reviewed the manuscript.
All methods were carried out in accordance with relevant guidelines and regulations. We declare that none of the work contained in this manuscript is published in any language or currently under consideration at any other journal. All authors have contributed to read and approved this submitted manuscript in its current form.
Conflicts of interestThere are no conflicts of interest.
References 1. Huang J, Patel HK, Boakye D, Chandrasekar VT, Koulaouzidis A, Lucero-Prisno Iii DE, et al. Worldwide distribution, associated factors, and trends of gallbladder cancer: a global country-level analysis. Cancer Lett 2021; 521:238–251. 2. Sharma A, Sharma KL, Gupta A, Yadav A, Kumar A. Gallbladder cancer epidemiology, pathogenesis and molecular genetics: recent update. World J Gastroenterol 2017; 23:3978–3998. 3. Giannis D, Cerullo M, Moris D, Shah KN, Herbert G, Zani S, et al. Validation of the 8th edition American Joint Commission on Cancer (AJCC) gallbladder cancer staging system: prognostic discrimination and identification of key predictive factors. Cancers 2021; 13:547. 4. Wang J, Bo X, Shi X, Suo T, Xin Y, Nan L, et al. Modified staging classification of gallbladder carcinoma on the basis of the 8th edition of the American Joint Commission on Cancer (AJCC) staging system. Eur J Surg Oncol 2020; 46:527–533. 5. Cai YL, Lin YX, Jiang LS, Ye H, Li FY, Cheng NS. A novel nomogram predicting distant metastasis in T1 and T2 gallbladder cancer: a seer-based study. Int J Med Sci 2020; 17:1704–1712. 6. Xu X, He M, Wang H, Zhan M, Yang L. Development and validation of a prognostic nomogram for gallbladder cancer patients after surgery. BMC Gastroenterol 2022; 22:200. 7. Chen M, Li S, Topatana W, Lv X, Cao J, Hu J, et al. Development and validation of a nomogram for predicting survival in gallbladder cancer patients with recurrence after surgery. Front Oncol 2021; 10:537789.
Comments (0)