
Remember me
Autoimmune hepatitis (AIH) is a rare chronic liver disease caused by an autoimmune regulation disorder, which is closely related to heredity and the external environment [1]. AIH can occur in all regions and age groups worldwide and is more prevalent in women, but the pathogenesis is still unclear [2]. Clinical studies in several countries have found that the incidence of AIH has been on the rise in recent years [3,4]. Therefore, paying more attention to patients with autoimmune liver disease is essential.
AIH is primarily diagnosed by clinical scores, and the International Health Organization has formulated a set of criteria [5,6]. However, the heterotopic disease phenotype often makes the diagnosis of the disease very challenging [7]. Corticosteroids and azathioprine are the first-line drugs for the treatment of AIH [8,9]. But there is a wide variation in the degree of response to treatment, with the majority of patients improving after treatment, however, a small percentage of patients still respond poorly to standard therapy [10,11]. There are few studies on the risk factors of treatment response in AIH patients [12,13]. Some clinical trial studies have shown that patients’ age, genetic factors, serum transaminase levels, liver co-morbidities, methemoglobinemia, and so on are significant influencing factors in treatment response [14–16]. However, whether other clinical monitoring indicators have a suggestive effect on patients’ treatment response still needs further study. In addition, there are no studies revealed the extent to which various risk factors influence the poor outcome of patients in response to treatment [17].
The nomogram is considered to be a mature, simple, intuitive, and reliable statistical prediction model for quantifying the risks of clinical events [14]. In this study, by collecting and screening risk factors associated with poor treatment response in clinical AIH patients, a nomogram was creatively used to screen risk factors attributed to the poor treatment response outcome in AIH patients. The quantitative scoring of each risk factor was used to assist in clinical decision-making.
Methods Patients selectionOur study retrospectively collected 297 patients clinically diagnosed with AIH between 2010 and 2019 at Beijing Ditan Hospital affiliated with Capital Medical University. The diagnosis of all patients followed the simplified diagnostic criteria for AIH issued in 2008, which confirmed the diagnosis of patients as definite and probable AIH based on scores more than or equal to 7 and equal to 6 [6]. At the same time, patients with overlapping syndromes were identified and differentiated based on pathological sections and international AIH subgroups [18]. Disease history, medication history, and clinical features of all enrolled patients were thoroughly surveyed and recorded. Ultimately, a total of 149 patients with AIH were enrolled in the final study. The study was approved by the Ethics Committee of Beijing Ditan Hospital affiliated with Capital Medical University.
Inclusion and exclusion criteriaPatients who met the following criteria were included in the study: (a) Determined or probable AIH according to the 2008 Simplified Diagnostic Criteria for AIH; (b) Treatment for more than 6 months.
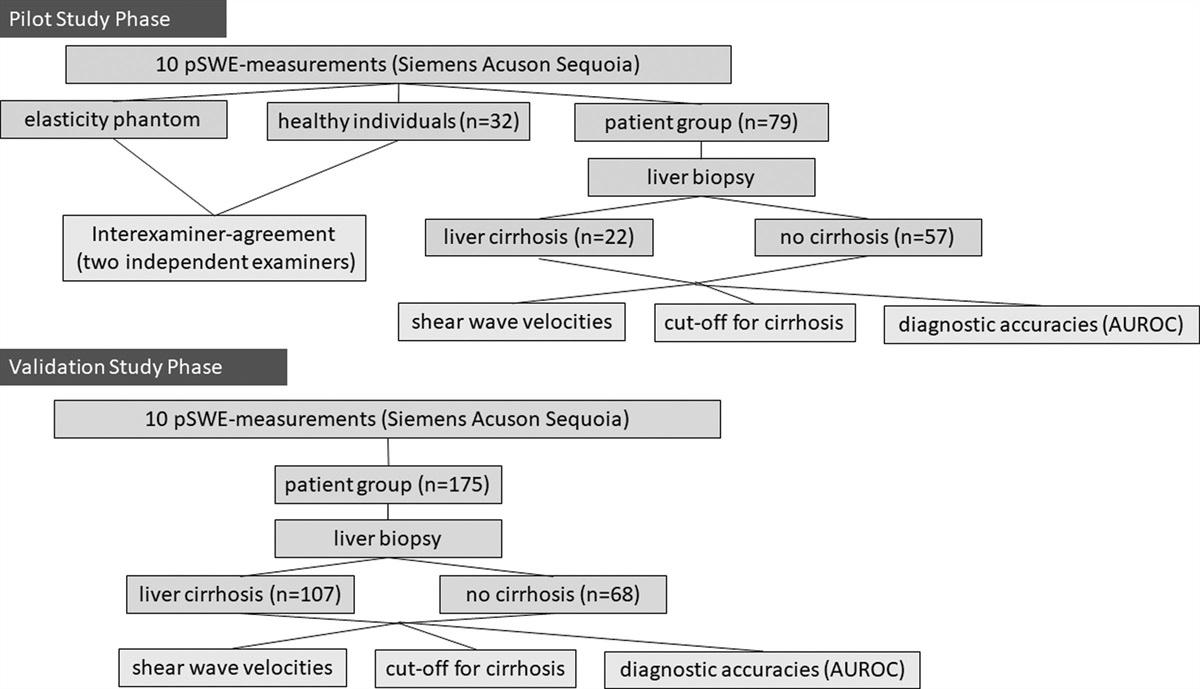
Patients with any of the following conditions were excluded: (a) Positive for hepatotropic viruses, such as, HBV HCV; (b) History of other chronic liver diseases, such as hereditary, metabolic liver diseases, and hepatocellular carcinoma; (c) Overlap syndromes (between AIH and primary biliary cholangitis, between AIH and primary sclerosing cholangitis); (d) History of hepatotoxic drug usage in the 3 months before diagnosis, such as antibiotics, non-steroidal anti-inflammatory drugs, and anti-cancer drugs; (e) Liver biopsy was not performed; (f) Treatment duration less than 6 months (Fig. 1).
 Fig. 1.:
 Research workflow.
Case-finding strategiesAn exhaustive method was used to collect patients who were first diagnosed with AIH at Beijing Ditan Hospital of Capital Medical University from 2010 to 2019 and the clinical characteristics of the patients were recorded in detail. Specific embodiments include: (a) searching for the medical term ‘AIH’ in the electronic medical record system of the Beijing Ditan Hospital to collect data on patients who have been discharged from the hospital. (b) Retrieving paper case files of AIH patients with liver disease in Beijing Ditan Hospital to collect information on AIH patients as systematically and comprehensively as possible.
Treatment of autoimmune hepatitisAll patients were treated with first-line therapy, a combination of glucocorticoids and azathioprine. According to the American Association for the Study of Liver Diseases research guidelines [8], treatment was as follows: Initially, prednisone 30 mg/d for 1 week, then 20 mg/d for 2 weeks, 15 mg/d for 4 weeks, and finally prednisone was maintained at a dose of 10 mg/d; AZA 50 mg/d was then added daily throughout the treatment. Duration of treatment not less than 6 months.
Histopathological evaluationThe liver puncture biopsy was performed in all 149 patients. Interfacial hepatitis and lymphocytic infiltration were present in all patients with liver pathology, while the presence of hepatocellular rosette nodules and regenerative nodules represented severe histological activity [18].
Data collection and definitionBaseline data extracted from the hospital medical record system include demographic characteristics (sex, age at diagnosis, clinical comorbidities); laboratory tests: including routine biochemical parameters [white blood cells (WBC), red blood cells, platelets, alanine aminotransferase (ALT), portal aminotransferase (AST), etc.]; blood coagulation tests [prothrombin time (PT), prothrombin activity (PTA), international normalized ratio (INR)]; autoimmune disease-related antibodies (antinuclear antibody, antimitochondrial antibody, anti-smooth muscle antibody); image and histological data.
Patients’ response outcomes were divided into a response group and a poor response group, with the response group being the Complete biochemical response (CRB are patients whose serum transaminases decreased by ≥ 50% within 4 weeks of treatment and whose transaminases <ULN and IgG <ULN within 6 months of treatment). The poor response group included the non-responders (patients whose serum transaminases decreased by <50% within 4 weeks of treatment), and the incomplete responders (patients whose serum transaminases decreased ≥50% within 4 weeks of treatment, but whose transaminase and IgG levels remained >ULN after 6 months of treatment) [19].
Statistical analysisSpss26.0 software (IBM, USA) and R4.2. 0 (R Core Team (2021), Vienna, Austria) was used to analyze the data and draw the chart, it is considered to be statistically significant when P < 0.05.
Baseline data from included patients with a continuous normal distribution (mean ± SD) for continuous variables were analyzed by t-test; categorical variables (values, percentages) were analyzed by chi-square test; and non-normally distributed data (median, interquartile spacing) were statistically analyzed by rank sum test. Univariate binary logistic regression analysis was used to assess the risk of poor response to treatment in AIH patients. Variables with P < 0.2 were input into a multivariate logistic regression analysis to identify risk factors for poor response. Based on the results of the last regression analysis, selected variables were included in the Nomogram.
Area Under the receiver operating characteristic curve was used to evaluate the discrimination of the Nomogram model. Calibration curves were used to calibrate the model and visualize the predicted probability of poor treatment response in AIH patients with the actual probability. Decision curves analysis (DCA) was used to assess whether the risk model helps us make better clinical decisions by quantifying the net benefit of a range of reasonable risk thresholds [20]. The clinical impact curve (CIC) was used to stratify the proportion of risk for each threshold probability in the model.
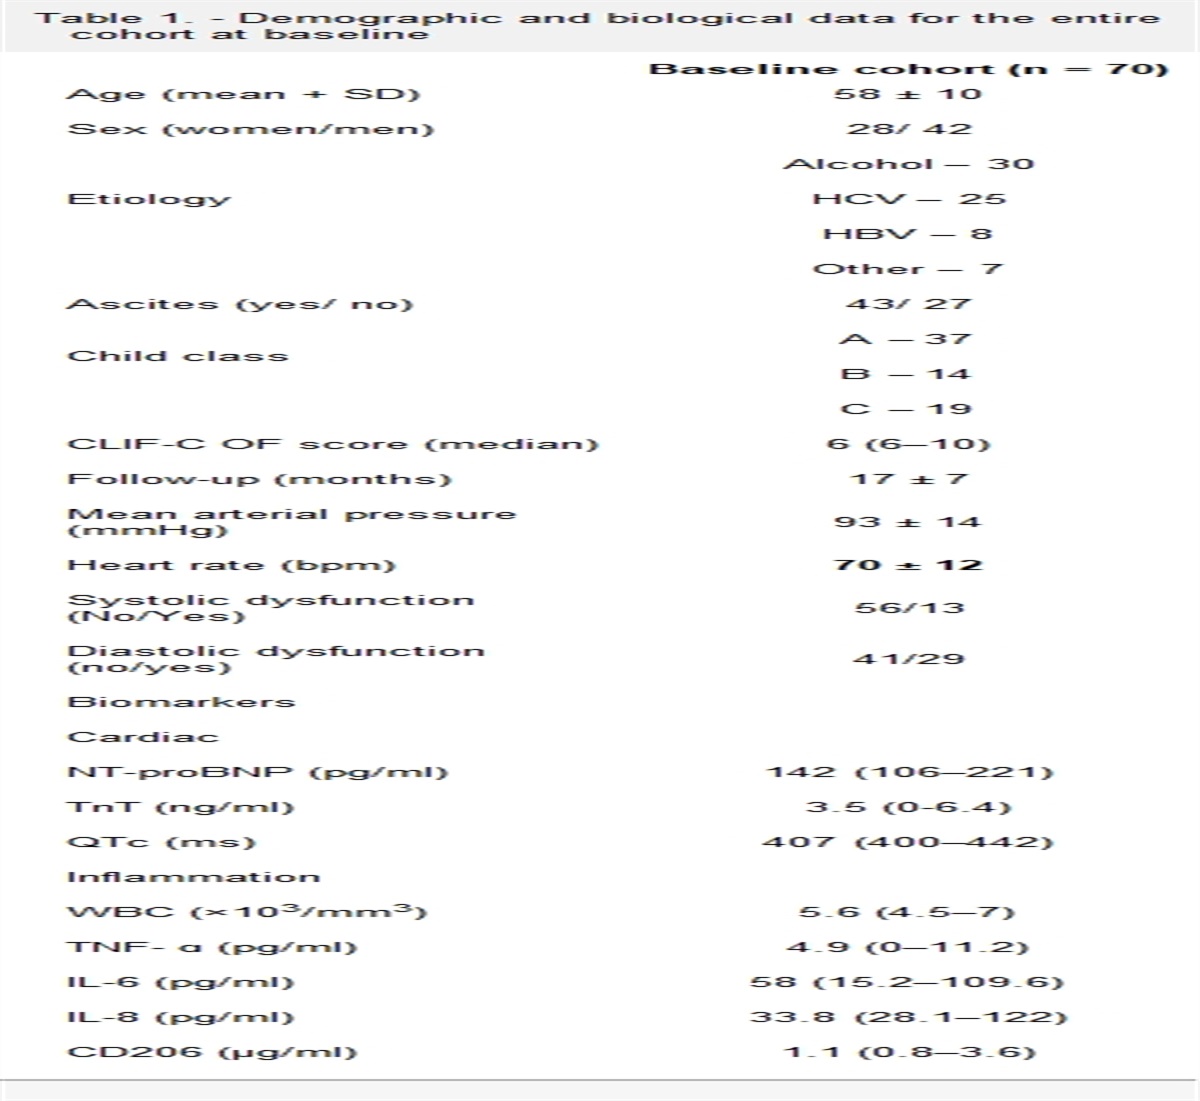
Results Baseline characteristics of AIH patients with responding and poorly respondingThis retrospective study included a total of 149 patients with AIH. Among them, 17 cases were male and 132 cases were female. The mean age of the patients was 61 years old. According to the biochemical indexes of the patients during treatment, patients were divided into two groups of biochemical responders and poor responders, in which there were 120 biochemical responders and 29 poor responders. Table 1 shows the baseline characteristics of the two cohorts of patients at admission. Including demographic characteristics, blood biochemical tests, and AIH-related antibody detection.
Table 1. - The baseline characteristics of AIH patients with different response endpoints ResponseThe bolded P-value was considered to be statistically different between the two groups for this factor.
The study found that the proportion of males in the biochemically poor response group (24.1%) was significantly higher than that in the group of biochemically responsive patients (8.3%), and the group of biochemically poor responders was significantly younger than the responders. Analysis of the laboratory findings revealed that the levels of WBC, ALT, AST, and INR were significantly lower in treatment-poor responders than in biochemical responders, but the PTA and IgG were higher, and all were statistically significant (P < 0.05). However, there was no difference in autoimmune-related antibodies and type of AIH between the two groups. All indicators of differences were included in the following study.
Risk factors associated with poor biochemical response in AIH patientsUnivariate and multifactorial binary logistic analyses were used to screen out possible risk factors affecting biochemical poor responses in AIH patients. The study found that a higher number of patients aged ≤60 years (P = 0.004), male (P = 0.006), with a higher IgG > 26.5g/L (P < 0.0001), and with elevated AST ≤ 4.49 × ULN(P = 0.008) had a higher risk of poor response (Table 2).
Table 2. - Factors associated with poor response in patients with AIH Univariate analysis Multivariate analysis OR 95% CI P-value OR 95% CI P-value Age >60 years 0.272 (0.117–0.634) 0.003 0.159 (0.045–0.564) 0.004 Female 0.286 (0.098–0.083) 0.022 0.085 (0.015–0.497) 0.006 Thyroid dysfunction 0.577 (0.254–1.309) 0.188 IgG > 26.5 (g/L) 3.057 (1.329–7.032) 0.009 22.016 (4.677–103.640) <0.001 WBC < 4 × 10⁹/L 2.098 (0.923–4.768) 0.077 ALT > 1.602 [×ULN] 0.198 (0.081–0.485) <0.001 AST > 4.49 [×ULN] 0.077 (0.017–0.337) 0.001 0.066 (0.009–0.494) 0.008 ALB < 40g/L 1.783 (0.382–8.323) 0.462 PT (s) 0.973 (0.898–1.053) 0.492 PTA < 70% 0.450 (0.185–1.096) 0.079 INR > 1.2 0.421 (0.177–0.999) 0.050Factors with P < 0.2 in the univariate regression analysis were included in the multifactor regression analysis; factors with P < 0.05 in the multifactor regression analysis were considered independent risk factors for poor response. The P-value <0.2 in the univariate regression analysis was bolded, and the bold P-value in the multifactor regression analysis represented <0.05.
Based on the results of multivariate binary Logistic regression analysis, the four variables of age, gender, IgG, and AST were included to construct a nomogram for the probability of poor treatment response in AIH patients after standard treatment. Each variable is assigned a score based on its projected value on the score axis, and the total score can be obtained by simply summing the scores of the four variables. The total score is used to predict the probability of poor treatment response in the AIH patients (Fig. 2).
 Fig. 2.:
 The four variables screened by the multifactorial logistic regression are used to plot the nomogram. The bold dots represent the specific values of the four variables for a particular patient and each variable has a corresponding mapping on the score axis and the total score can be obtained by simple summation. The total score is used to predict the probability of poor response.
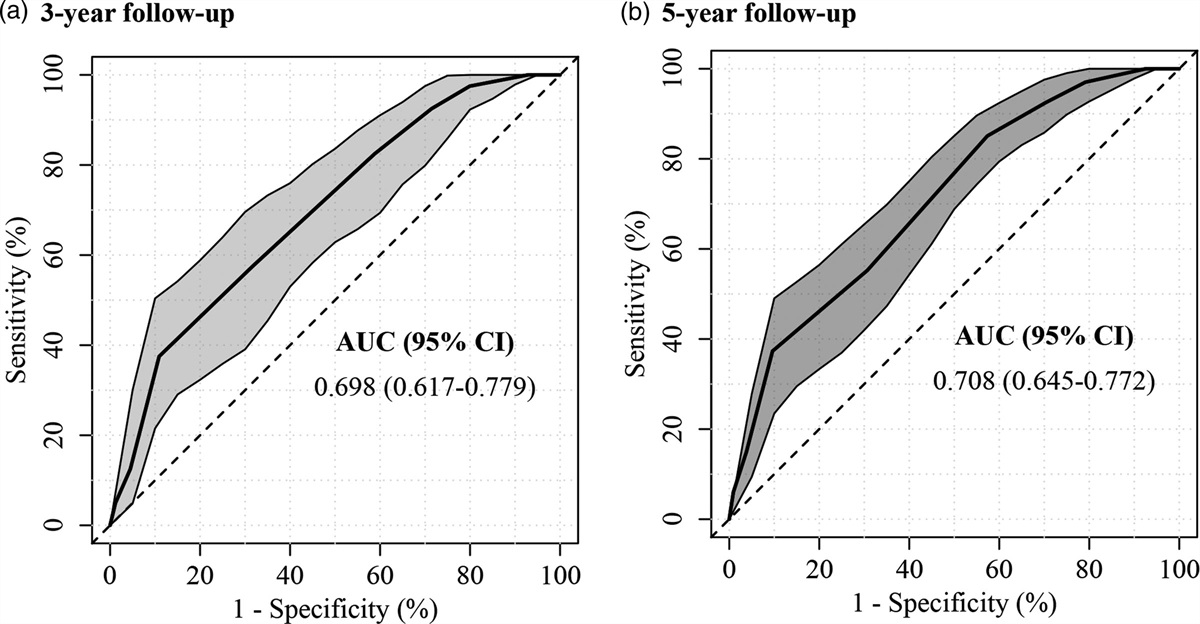
Assessment of nomogramThe performance of the nomogram was evaluated by the calibration curve and ROC curve. Figure 3a and b shows the calibration curve of the nomogram and the ROC curve with an area under the receiver operating characteristic curve of 0.853 (95% CI: 0.777–0.928), indicating that the model has good discrimination. The true and corrected cohort curves in the calibration curve float up and down on the 45-degree line, indicating that the nomogram has a good model fit. DCA shows that patients will benefit greatly when using this clinical model for decision-making if the probability of a patient experiencing a poor treatment response is between 10% and 90% (Fig. 4a). The CIC shows the relationship between the number of people who have a poor response to treatment and the number of people at risk under different risk probabilities (Fig. 4b).
 Fig. 3.:
 (a) ROC curve for nomogram, the area under the curve (AUC) of 0.853. (b) Calibration curve for nomogram, the x-axis represents the predicted probability of nomogram, and the y-axis represents the actual probability of poor response. The 45-degree diagonal line represents the ideal prediction curve, the dashed curve represents the true cohort, solid line is the corrected curve.
 Fig. 4.:
 (a) Nomogram’s clinical Decision curves analysis (DCA) to predict the probability of occurrence of poor response. When the probability of occurrence is betweens 0.1 and 0.9, there is a good clinical benefit. (b) Clinical impact curve (CIC) of the nomogram. The solid line represents the number of poor responders predicted by the nomogram in the population, and the dashed line represents the number of true occurrences. When the nomogram predicted probability is greater than 0.75, the predicted number overlaps with the true number of occurrences.
DiscussionIn this retrospective study, 149 patients with AIH in Beijing Ditan Hospital affiliated with Capital Medical University were collected and screened, and the patients were divided into responders and poor responders according to the relevant biochemical indexes in the latest international consensus [19]. By constructing a nomogram with risk factors screened by logistic regression, we visually quantify the risk, which may provide help for clinicians in making treatment decisions for AIH patients. Finally, four factors as predictive risk factors for poor treatment response in patients with AIH were screened: namely, age ≤60 years, male, IgG > 26.5g/L, and AST ≤ 4.49 × ULN. The nomogram constructed in this study was validated by calibration curves, DCA, and CIC with high discrimination, calibration, and clinical benefit.
A systematic review revealed the close association of age with various liver diseases, including nonalcoholic liver disease, alcoholic liver disease, hepatitis, liver fibrosis, and cirrhosis [21]. Our study found that age seems to be an independent risk factor for poor response in AIH patients. A retrospective study from Italy found that younger AIH patients were more likely to have incomplete or non-responsive responses; and that younger patients had a greater tendency to develop liver fibrosis and cirrhosis [15]. The results of Ahmed Abdel-Razik et al. came to the same conclusion [22]. In our study, patients aged ≤60 years were 6.3 times more likely to have a poor treatment response than older patients, reinforcing these conclusions. However, one study found no difference in treatment response between younger patients and AIH patients over 70 years, which may be due to the different geographic regions, ethnicity, and genetic factors of the study population [23].
Similar to other autoimmune diseases, AIH is also more common in female patients [24]. In our study, 89% of patients were female, which is consistent with the international consensus. Our study showed that male AIH patients were 11.7 times more likely to respond poorly to treatment than female patients, an independent risk factor. This is in agreement with the findings of Luis Téllez1 et al [14]. However, the exact mechanism has not been studied.
Elevated IgG is one of the important pieces of evidence for diagnosing AIH and judging patients’ responses to treatment [19,25]. IgG levels are related to patient autoimmune regulation and immune hypersensitivity, resulting in differential responses in patients under standard therapy [26]. A prospective cohort study, also from China, found that among 569 AIH patients, those with lower IgG levels (17.8 g/L vs. 25 g/L) at diagnosis had better biochemical and histological remission, which coincides with our findings [27]. However, the minimum value of IgG that can cause an increased risk of poor treatment response remains unspecified. In this study, we assumed 26.5 g/L as the critical point based on the cutoff value of IgG data. Surprisingly, patients with IgG > 26.5 g/L had 22.016 times the poor treatment rate of the rest patients. which was adjacent to the predicted IgG value (1.5 ×ULN) of You Li et al [27]. Therefore, monitoring IgG levels at the patient’s first visit helps physicians make better clinical decisions.
Aspartate aminotransferase (AST) is one of the important detectors in liver injury as a vital aid in the diagnosis of multiple liver diseases [28]. Elevated AST is present in most patients with AIH with liver injury [6]. In this study, we found that patients with AIH had better biochemical treatment responses when their elevated AST at diagnosis was greater than 4.49 × ULN. Both the Paolo Muratori and You Li teams similarly find that higher AST levels may contribute to the poor response to AIH, and Paolo Muratori et al. suggested that AST also played an inverse role in predicting histological remission of AIH [15,27]. Meanwhile, some past studies have not found significant differences in AST levels between the two different responding populations [14,16]. This may be related to the varying degrees of disease progression when the AIH patients were enrolled.
The response outcome of standard treatment in AIH patients is a key influencing factor for the clinician’s next medical decision [9]. We creatively propose to use easily available influencing factors to assess the risk of under-response in patients. This is the first time to construct a nomogram to predict the probability of poor response to treatment in Chinese AIH patients.
There are still some limitations in this research. First, the current study is a single-center, small-scale study that is inevitably biased. Second, although the model has good discrimination and calibration, the universality of this alignment map still needs to be verified by external data sets, considering the influence of epidemiological characteristics and clinical manifestations of patients with different races, regions, and heredity. Due to the limitation of the number of AIH patients, further study and analysis are needed.
ConclusionIn summary, our study identified four risk factors associated with poor response outcomes in AIH patients by univariate and multifactorial logistic regression. Notably, we constructed a nomogram to assess the influence of each risk factor on treatment response. This will help clinicians to identify patients with poor treatment responses more precisely and carry out individualized treatment.
AcknowledgementsThis work was supported by the Natural Science Foundation of Beijing (7212053), Innovation Team and Talents Cultivation Program of the National Administration of Traditional Chinese Medicine (ZYYCXTD-C-202006), Dengfeng Talent Support Program of Beijing Municipal Administration of Hospitals (No.DFL20221601).
WX is the first author of this study. Concept and design (LX, WX); data acquisition (WX, LH, WP, WYQ, YYY); statistical analysis (WX, LH), drafting of the manuscript (WX), critical revision of the manuscript for important intellectual content (LX); obtained funding: (LX). All authors read and approved the final manuscript.
The study was conducted in accordance with the guidelines of the Declaration of Helsinki and was approved by the ethics committee of Beijing Ditan Hospital, Capital Medical University.
Conflicts of interestThere are no conflicts of interest.
References 1. Sebode M, Hartl J, Vergani D, Lohse AW; International Autoimmune Hepatitis Group (IAIHG). Autoimmune hepatitis: from current knowledge and clinical practice to future research agenda. Liver Int 2018; 38:15–22. 2. Sahebjam F, Vierling JM. Autoimmune hepatitis. Front Med 2015; 9:187–219. 3. Lamba M, Ngu JH, Stedman CAM. Trends in incidence of autoimmune liver diseases and increasing incidence of autoimmune hepatitis. Clin Gastroenterol Hepatol 2021; 19:573–579.e1. 4. Tanaka A, Mori M, Matsumoto K, Ohira H, Tazuma S, Takikawa H. Increase trend in the prevalence and male-to-female ratio of primary biliary cholangitis, autoimmune hepatitis, and primary sclerosing cholangitis in Japan. Hepatol Res 2019; 49:881–889. 5. Mieli-Vergani G, Vergani D, Czaja AJ, Manns MP, Krawitt EL, Vierling JM, et al. Autoimmune hepatitis. Nat Rev Dis Primers 2018; 4:18017. 6. Hennes EM, Zeniya M, Czaja AJ, Parés A, Dalekos GN, Krawitt EL, et al.; International Autoimmune Hepatitis Group. Simplified criteria for the diagnosis of autoimmune hepatitis. Hepatology 2008; 48:169–176. 7. Stamm GM, Sempoux C, Fraga M, Comte D, Aubert V, Moradpour D, et al. [Autoimmune hepatitis: 2021 update]. Rev Med Suisse 2021; 17:1457–1463. 8. Mack CL, Adams D, Assis DN, Kerkar N, Manns MP, Mayo MJ, et al. Diagnosis and management of autoimmune hepatitis in adults and children: 2019 practice guidance and guidelines from the american association for the study of liver diseases. Hepatology 2020; 72:671–722. 9. Komori A. Recent updates on the management of autoimmune hepatitis. Clin Mol Hepatol 2021; 27:58–69. 10. Obermayer-Straub P, Strassburg CP, Manns MP. Autoimmune hepatitis. J Hepatol 2000(1 Suppl); 32:181–197. 11. Krawitt EL. Autoimmune hepatitis. N Engl J Med 2006; 354:54–66. 12. Li Y, Sun Y, Liu Y, Wang B, Li J, Wang H, et al.; Chinese AIH Consortium. Genome-wide meta-analysis identifies susceptibility loci for autoimmune hepatitis type 1. Hepatology 2022; 76:564–575. 13. Higuchi T, Oka S, Furukawa H, Tohma S, Yatsuhashi H, Migita K. Genetic risk factors for autoimmune hepatitis: implications for phenotypic heterogeneity and biomarkers for drug response. Hum Genomics 2021; 15:6. 14. Téllez L, Sánchez Rodríguez E, Rodríguez de Santiago E, Llovet L, Gómez-Outomuro A, Díaz-Fontenla F, et al. Early predictors of corticosteroid response in acute severe autoimmune hepatitis: a nationwide multicenter study. Aliment Pharmacol Ther 2022; 56:131–143. 15. Muratori P, Lalanne C, Bianchi G, Lenzi M, Muratori L. Predictive factors of poor response to therapy in Autoimmune Hepatitis. Dig Liver Dis 2016; 48:1078–1081. 16. Montano-Loza AJ, Ronca V, Ebadi M, Hansen BE, Hirschfield G, Elwir S, et al.; International Autoimmune Hepatitis Group (IAIHG). Risk factors and outcomes associated with recurrent autoimmune hepatitis following liver transplantation. J Hepatol 2022; 77:84–97. 17. Roberts EA. Autoimmune hepatitis. Indian J Pediatr 1995; 62:525–531. 18. Alvarez F, Berg PA, Bianchi FB, Bianchi L, Burroughs AK, Cancado EL, et al. International Autoimmune Hepatitis Group Report: review of criteria for diagnosis of autoimmune hepatitis. J Hepatol 1999; 31:929–938. 19. Pape S, Snijders RJALM, Gevers TJG, Chazouilleres O, Dalekos GN, Hirschfield GM, et al.; International Autoimmune Hepatitis Group (IAIHG) collaborators(‡). Systematic review of response criteria and endpoints in autoimmune hepatitis by the International Autoimmune Hepatitis Group. J Hepatol 2022; 76:841–849. 20. Vickers AJ, Holland F. Decision curve analysis to evaluate the clinical benefit of prediction models. Spine J 2021; 21:1643–1648. 21. Tajiri K, Shimizu Y. Liver physiology and liver diseases in the elderly. World J Gastroenterol 2013; 19:8459–8467. 22. Abdel-Razik A, Mousa N, Zakaria S, Elhelaly R, Elzehery R, Zalata K, et al. New predictive factors of poor response to therapy in autoimmune hepatitis: role of mean platelet volume. Eur J Gastroenterol Hepatol 2017; 29:1373–1379. 23. Dalekos GN, Azariadis K, Lygoura V, Arvaniti P, Gampeta S, Gatselis NK. Autoimmune hepatitis in patients aged 70 years or older: disease characteristics, treatment response, and outcome. Liver Int 2021; 41:1592–1599. 24. Ngo ST, Steyn FJ, McCombe PA. Gender differences in autoimmune disease. Front Neuroendocrinol 2014; 35:347–369. 25. Zgair AK. Involvement of (IgG and IgM)-secreting B lymphocytes in severity of autoimmune hepatitis type 1. Med Microbiol Immunol 2013; 202:229–237. 26. Ma L, Qin J, Ji H, Zhao P, Jiang Y. Tfh and plasma cells are correlated with hypergammaglobulinaemia in patients with autoimmune hepatitis. Liver Int 2014; 34:405–415. 27. Li Y, Yan L, Wang R, Wang Q, You Z, Li B, et al. Serum Immunoglobulin G Levels Predict Biochemical and Histological Remission of Autoimmune Hepatitis Type 1: A Single-Center Experience and Literature Review. Clin Rev Allergy Immunol 2022; 62:292–300. 28. Panteghini M. Aspartate aminotransferase isoenzymes. Clin Biochem 1990; 23:311–319.
Comments (0)