
記住我

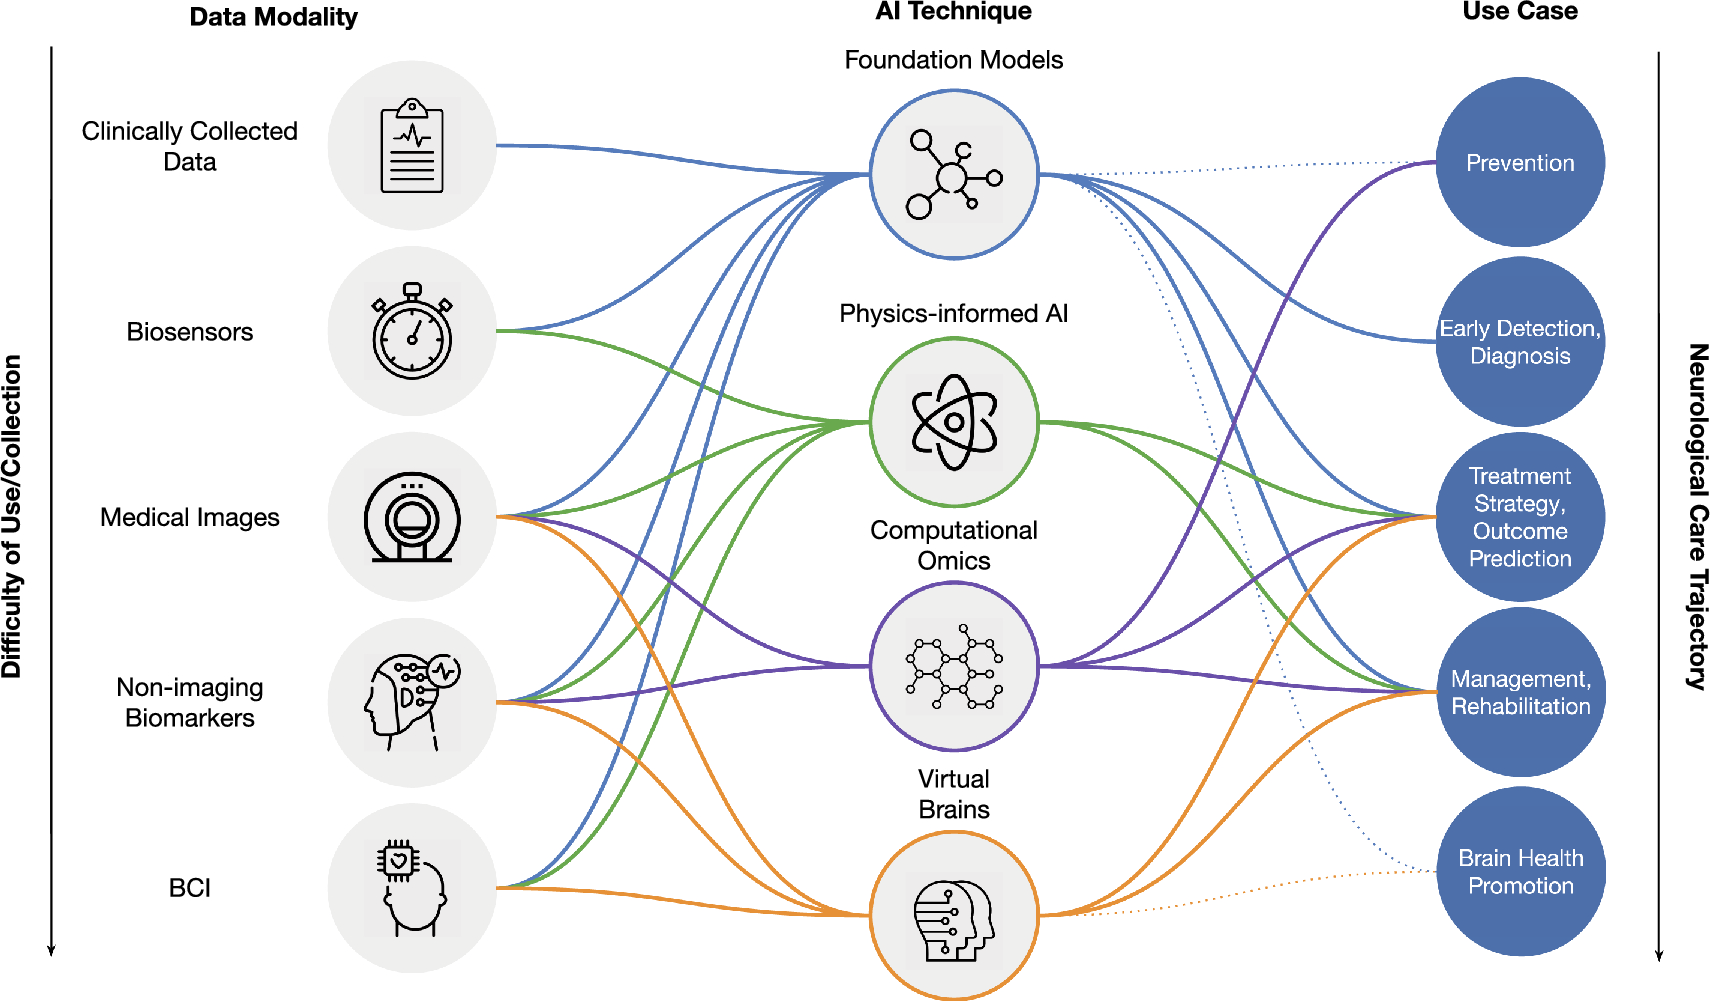
Twenty-nine patients were screened and enrolled from April 1, 2016, to June 7, 2019. Three patients (two in cohort 1 and one in cohort 2) discontinued the study during stage 3 (in the first 2 years of treatment with cipaglucosidase alfa + miglustat) before the data cutoff date of December 13, 2021 (Fig. 2). Mean (standard deviation [SD]) treatment duration during the study of the ERT-experienced patients was 51.8 (21.46), 46.3 (22.86) and 37.7 (4.13) months in cohorts 1, 2 and 4, respectively, and 54.7 (12.14) months for the ERT-naïve patients in cohort 3. Treatment compliance was high (mean ≥ 95.6%) for all stages of the study. Due to the staggered enrollment dates, some patients, who were still ongoing in the study, were yet to reach the 48-month timepoint at the data cutoff date.
Fig. 2
Patient disposition. Cohort 1: ERT experienced (2–6 years), ambulatory; cohort 2: ERT experienced (≥ 2 years), non-ambulatory; cohort 3: ERT naïve, ambulatory (1 patient in cohort 3 received a single dose of alglucosidase alfa before moving to Australia where this treatment is unavailable and was therefore eligible for inclusion in cohort 3); cohort 4: ERT experienced (≥ 7 years), ambulatory. AE adverse event, ERT enzyme replacement therapy
Patient demographics at baseline were representative of the adult Pompe disease population [32, 33]. The mean (SD) duration of treatment with alglucosidase alfa at baseline was 7.8 (3.75) years in the ERT-experienced cohorts (cohorts 1, 2, and 4); all ERT-experienced patients received 20 mg/kg every 2 weeks before study enrollment except two patients in cohort 2 who received 40 mg/kg every 2 weeks. Mean baseline values for % predicted 6MWD were similar between cohorts 1 and 4 (61.0 and 59.0, respectively), and slightly numerically larger in cohort 3 (67.8). The mean MMT lower extremity score (hip and knee muscle groups) was generally similar across cohorts 1, 4, and 3 (Table 1). The mean % predicted sitting FVC was similar for cohorts 1 and 3 (52.6 and 57.2, respectively), higher in cohort 4 (65.3), and lower for the non-ambulatory ERT-experienced cohort 2 (42.3; Table 1).
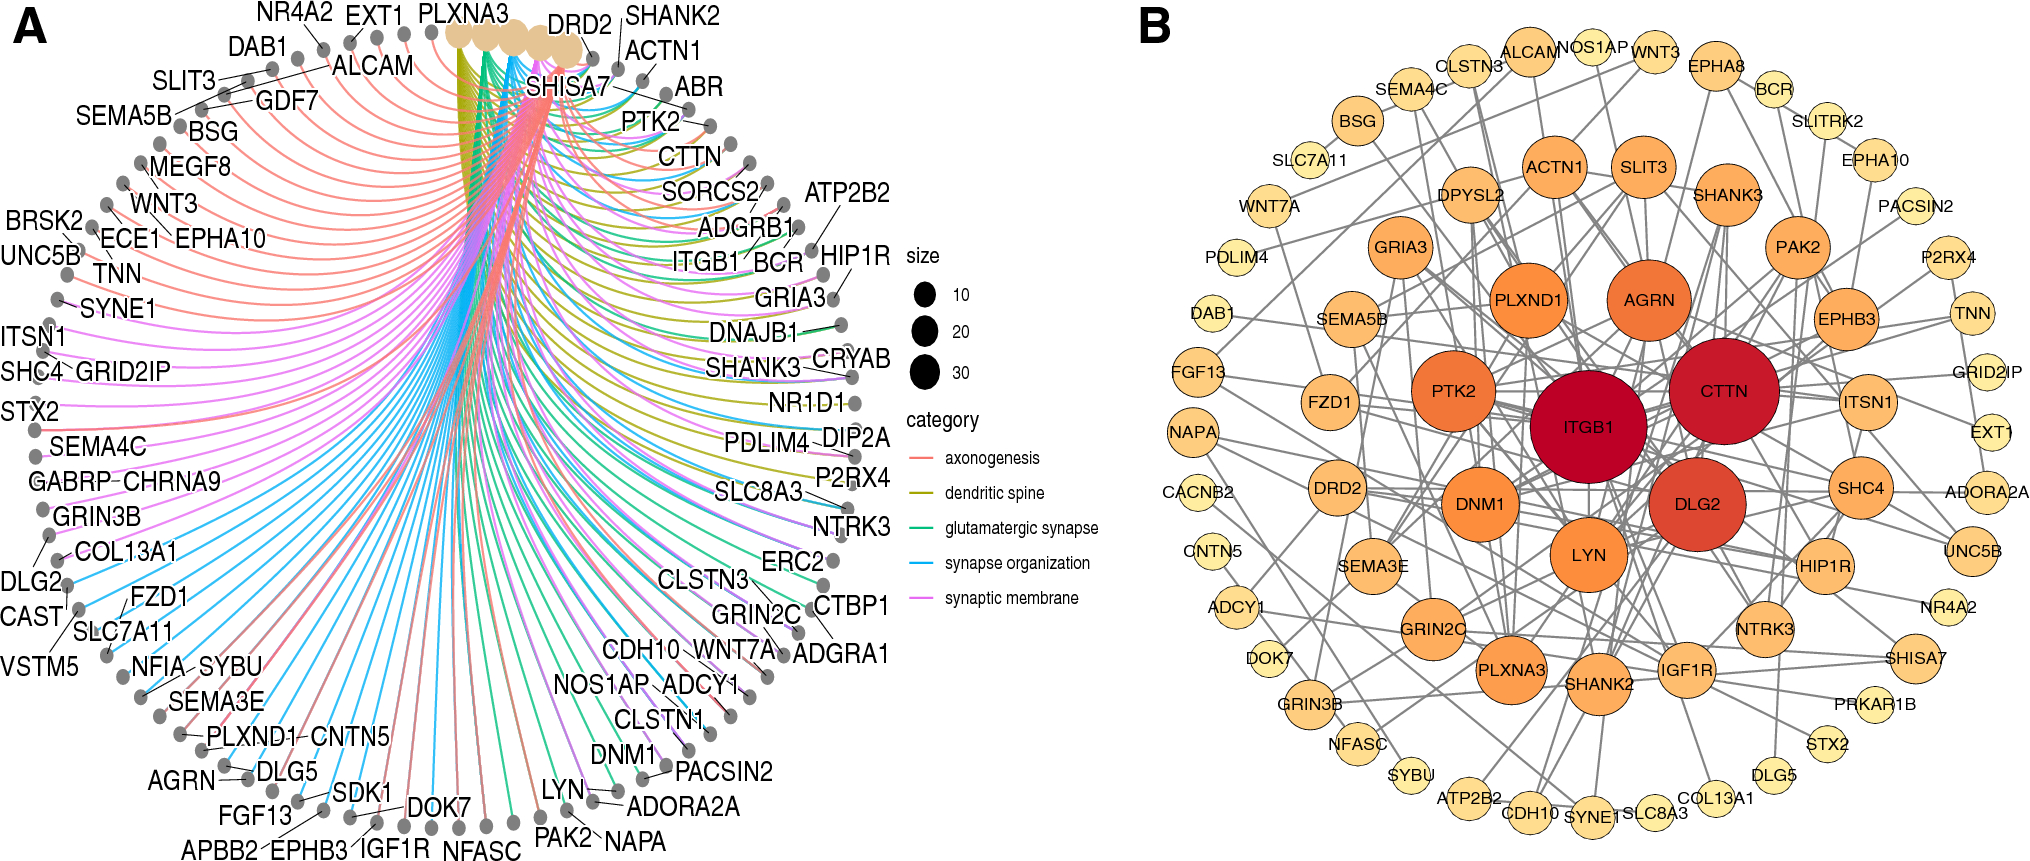
Table 1 Baseline demographic and clinical characteristics (all enrolled patients)Efficacy outcomes: ambulatory patients (ERT-experienced pooled cohorts 1 + 4 and ERT-naïve cohort 3)Motor functionBoth the ERT-experienced and ERT-naïve cohorts showed durable mean improvements from baseline in % predicted 6MWD up to 48 months (Fig. 3a and b; Supplementary Table S2), with 8/9 (88.9%) of ERT-experienced patients and 4/4 (100%) of ERT-naïve patients experiencing an improvement from baseline in % predicted 6MWD at month 48 (Supplementary Fig. S1). Absolute data for 6MWD in meters are summarized in Supplementary Table S2. After 12, 24, 36, and 48 months of follow-up, 6MWD in meters improved numerically from baseline in 13/16, 9/13, 6/12, and 6/9 ERT-experienced patients, respectively. After 12, 24, 36, and 48 months of follow-up, 6MWD in meters improved numerically from baseline in 6/6, 6/6, 4/5, and 4/4 ERT-naïve patients, respectively.
Fig. 3
CFBL in % predicted 6MWD in ambulatory a ERT-experienced and b ERT-naïve patients. Pooled data from cohorts 1 and 4 for ERT-experienced patients. No applicable data are available for cohort 2 (non-ambulatory patients). 6MWD 6-min walking distance, CFBL change from baseline, ERT enzyme replacement therapy, SD standard deviation, SE standard error
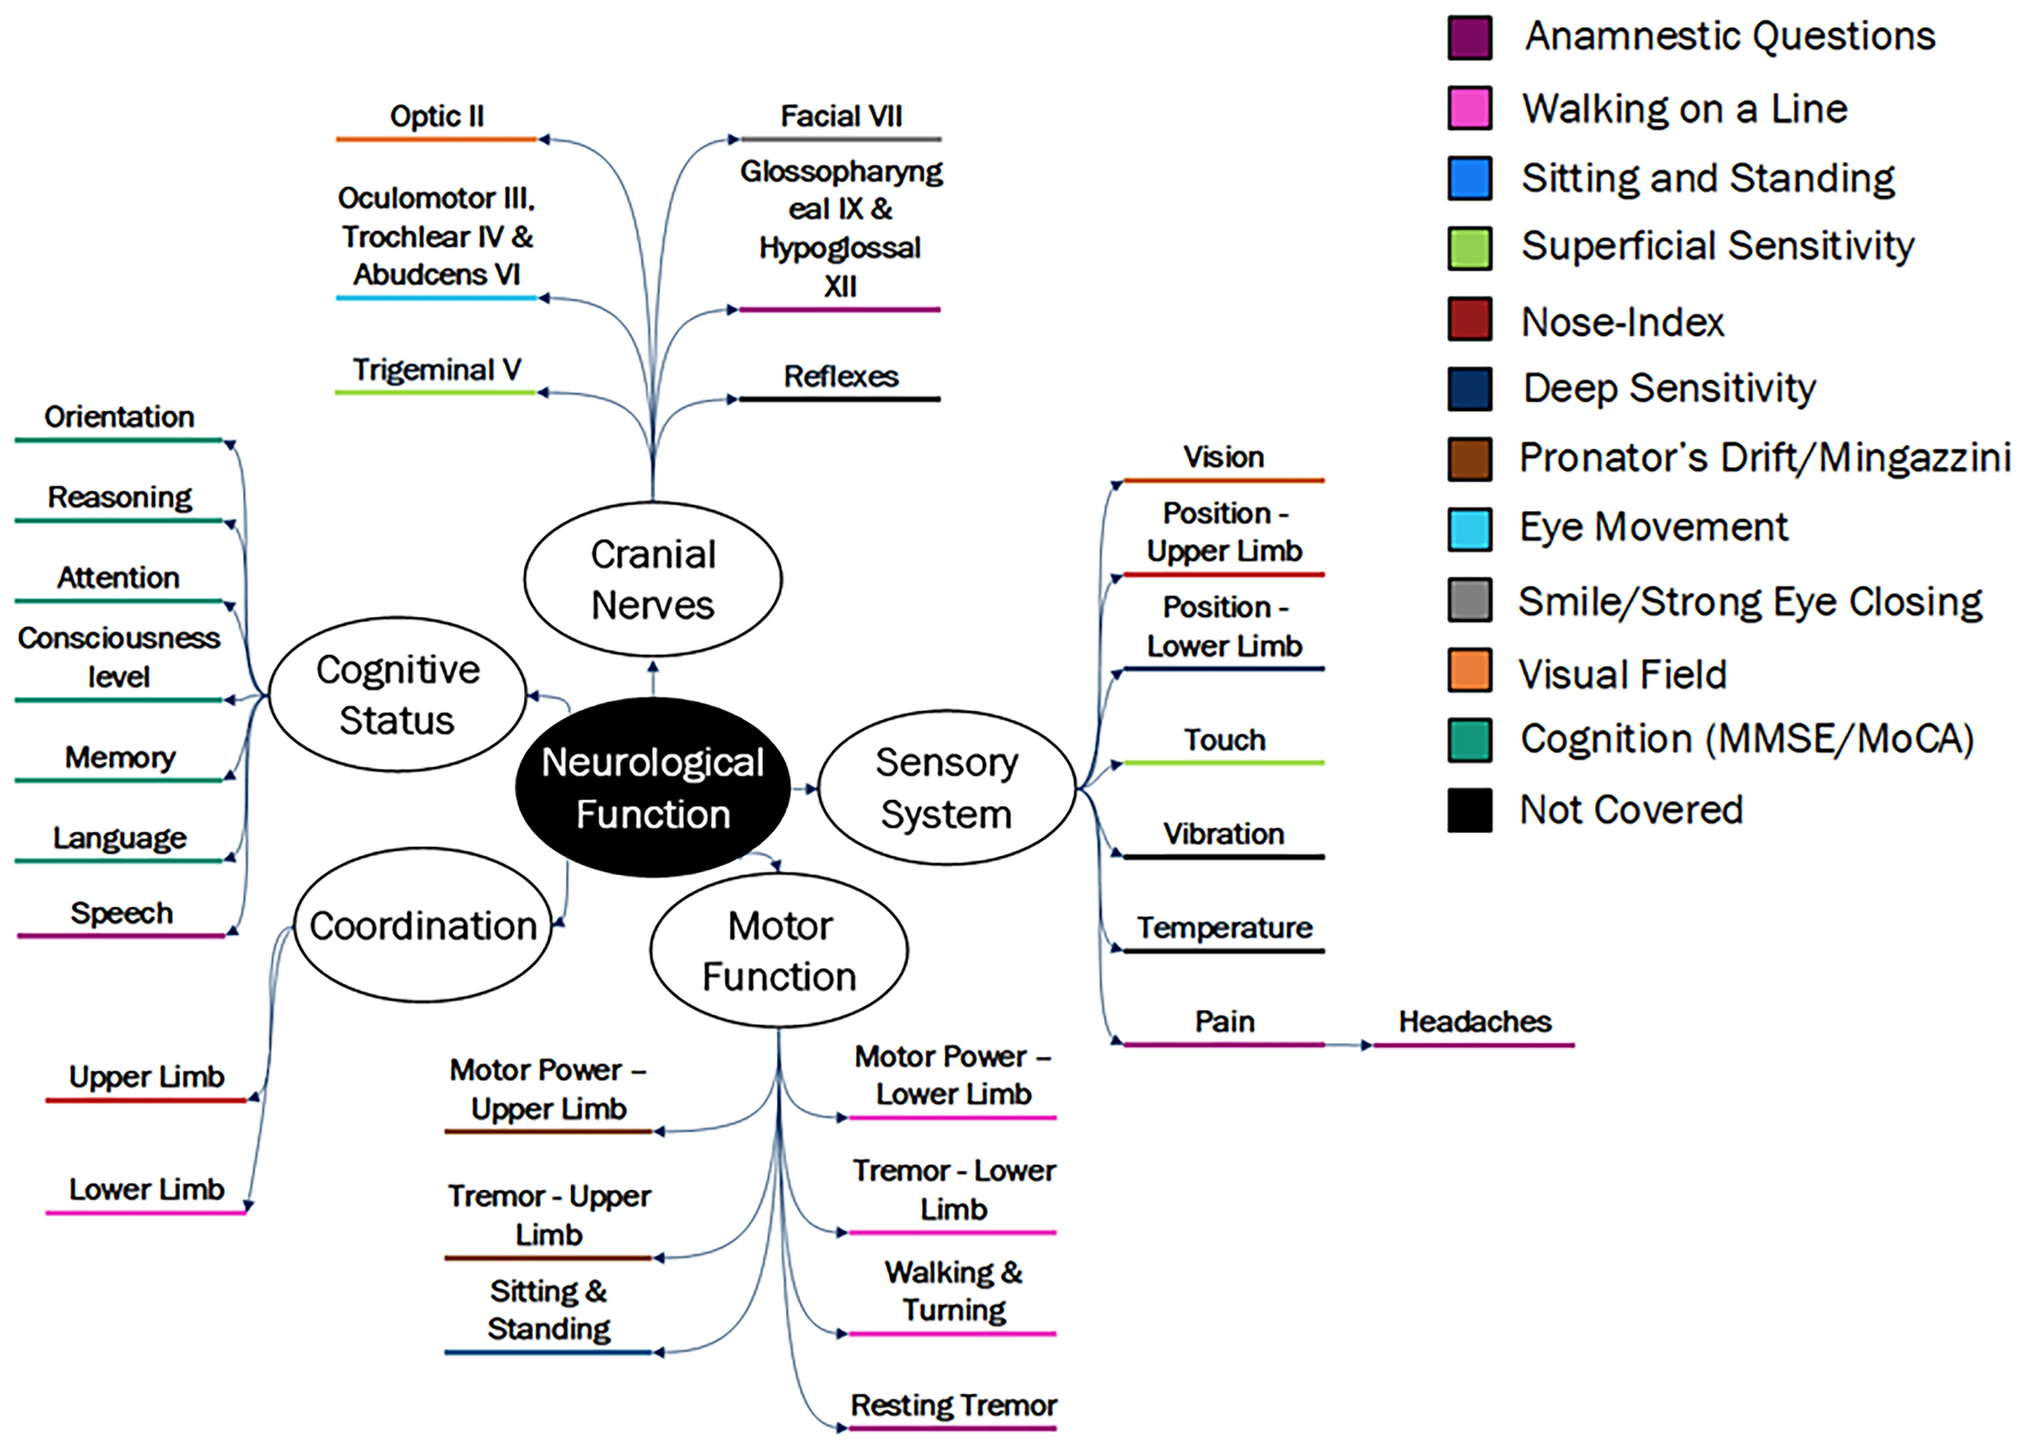
Respiratory functionMean CFBL in % predicted sitting FVC was generally stable (CFBL ± 3% points) for up to 48 months of follow-up in the ERT-experienced cohorts (Fig. 4a; Supplementary Table S2), with improvements (CFBL ≥ 3% points) at month 48 in 66.7% of ERT-experienced patients with available data (Supplementary Fig. S1). After 12, 24, 36, and 48 months of follow-up, % predicted sitting FVC improved (≥ 3% points) or remained stable (± 3% points) from baseline in 9/16, 11/13, 8/10, and 4/6 ERT-experienced patients, respectively. This is further supported by mean CFBL in % predicted maximum expiratory pressure (MEP) results that also improved numerically from baseline at 12, 24, 36, and 48 months of follow-up in ERT-experienced patients (Supplementary Table S2). Mean CFBL in % predicted maximum inspiratory pressure (MIP) initially improved numerically at 12 and 24 months of follow-up but declined numerically after 36 and 48 months of follow-up from baseline in ERT-experienced patients (Supplementary Table S2).
Fig. 4
CFBL in % predicted FVC in ambulatory a ERT-experienced and b ERT-naïve patients. Pooled data from cohorts 1 and 4 for ERT-experienced patients. aOne patient in the ERT-naïve cohort experienced a large drop in % predicted FVC at month 21, which returned to previous levels at the following visit (month 24). CFBL change from baseline, FVC forced vital capacity, SD standard deviation, SE standard error
In the ERT-naïve cohort, mean CFBL in % predicted sitting FVC improved at 3 months and then remained generally stable up to 48 months of follow-up (Fig. 4b; Supplementary Table S2), except for a steep drop at month 21 where one patient experienced a large drop in % predicted sitting FVC, which returned to previous levels at the next visit at month 24. After 48 months of follow-up, 75% of ERT-naïve patients with available data showed improvements (≥ 3% points) in % predicted sitting FVC (Supplementary Fig. S1). While mean baseline values for % predicted sitting FVC in the ERT-naïve cohort (57.2%) and the ERT-experienced cohort (57.4%) were similar, mean improvements over 48 months of follow-up were more marked in the ERT-naïve cohort (Fig. 4b; Supplementary Table S2). After 12, 24, 36, and 48 months of follow-up, % predicted sitting FVC improved (≥ 3% points) or remained stable (± 3% points) from baseline in 5/6, 6/6, 5/5, and 4/4 in ERT-naïve patients, respectively. Percent predicted sitting FVC data were supported by similar outcomes in other pulmonary measures in ERT-naïve patients, including mean CFBL in % predicted MIP and MEP, which improved numerically at 12, 24, 36, and 48 months of follow-up (Supplementary Table S2).
6MWD and % predicted sitting FVC clinically meaningful changes from baselineAt 48 months of follow-up, six ERT-experienced and three ERT-naïve ambulatory patients had available data for both 6MWD in meters and % predicted sitting FVC. In ERT-experienced patients, two demonstrated clinically meaningful improvements in both 6MWD and % predicted sitting FVC, four demonstrated clinically meaningful improvements or stabilization for at least one of 6MWD or % predicted sitting FVC, and none demonstrated clinically meaningful worsening for both 6MWD and % predicted sitting FVC. In ERT-naïve patients, one demonstrated clinically meaningful improvements in both 6MWD and % predicted sitting FVC, two demonstrated clinically meaningful improvements or stabilization for at least one of 6MWD or % predicted sitting FVC, and none demonstrated clinically meaningful worsening for both 6MWD and % predicted sitting FVC.
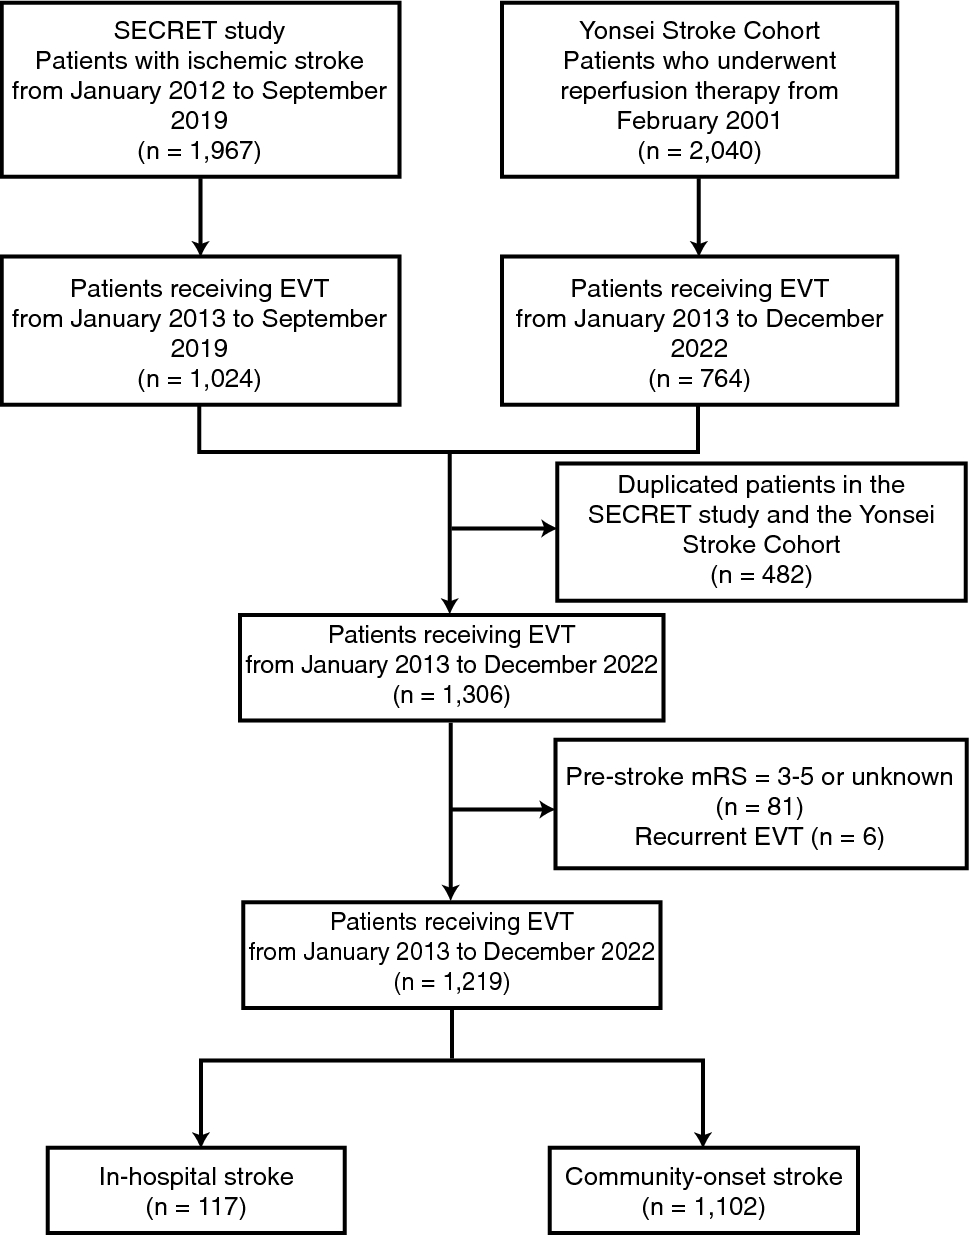
Muscle strengthIrrespective of ERT-treatment status at baseline, ambulatory patients experienced early improvements in muscle strength based on MMT lower extremity scores, which were maintained for up to 48 months of follow-up (Fig. 5; Supplementary Table S2). After 12, 24, 36, and 48 months of follow-up, the MMT lower extremity score improved numerically from baseline in 14/15, 11/13, 10/10, and 8/8 ERT-experienced patients and 4/5, 4/5, 4/4, and 3/4 ERT-naïve patients, respectively. MMT upper body scores (shoulder and elbow muscle groups) improved or stabilized from baseline in ambulatory ERT-experienced and ERT-naïve patients up to 48 months of follow-up (Supplementary Table S2).
Fig. 5
Absolute CFBL in MMT lower extremity score in ambulatory a ERT-experienced and b ERT-naïve patients. Pooled data from cohorts 1 and 4 for ERT-experienced patients. No applicable data are available for cohort 2 (non-ambulatory patients). CFBL change from baseline, ERT enzyme replacement therapy, MMT manual muscle test, SD standard deviation, SE standard error
PRO resultsPROs supported the improvements observed for motor function, muscle strength, and pulmonary function tests. At baseline, all patients were significantly impacted by fatigue, which improved after 48 months of follow-up, as shown by the favorable mean CFBL in FSS. After 48 months of follow-up, all ambulatory patients reported stable R-PAct scores and RHS compared with baseline scores (Supplementary Table S2). SGIC outcomes for overall physical wellbeing improved in most patients across all cohorts after 48 months of follow-up (Supplementary Table S3). PGIC results indicated an improvement or stabilization for all cohorts after 48 months of follow-up and supported the results of other efficacy outcomes (Supplementary Table S3).
PD outcomesDuring the 48 months of follow-up, cipa + mig was associated with mean reductions from baseline in plasma CK in both ERT-experienced and ERT-naive ambulatory cohorts (Fig. 6a; Supplementary Table S2). After 12, 24, 36, and 48 months of follow-up, plasma CK levels decreased numerically or remained stable from baseline in 13/15, 14/15, 9/11, and 8/9 ERT-experienced patients and 6/6, 6/6, 5/5, and 4/5 ERT-naïve patients, respectively (plasma CK levels increased in the remaining patients). Among patients who had CK data available at baseline and month 48, 6 of 9 (66.7%) ERT-experienced patients had abnormal CK levels at baseline and 2 of these (33.3%) had normal CK levels at month 48; 2 of 5 (40.0%) ERT-naïve patients had abnormal CK levels at baseline that remained abnormal at month 48. Overall, similar trends were observed with urine Hex4, which decreased numerically or remained stable from baseline after 12, 24, 36, and 48 months of follow-up in 16/16, 11/14, 11/12, and 6/9 ERT-experienced patients and 5/6, 5/6, 4/5, and 4/5 ERT-naïve patients, respectively (urine Hex4 levels increased in the remaining patients; Fig. 6b; Supplementary Table S2). In the ERT-experienced cohort, individual outlier values from different patients contributed to the peaks in mean Hex4 CFBL at months 21, 24, and 48, but these outliers did not affect the overall observed trends (Fig. 6b; Supplementary Table S2). Among patients who had Hex4 data available at baseline and at month 48, 5 out of 9 (55.6%) ERT-experienced patients had abnormal Hex4 levels at baseline, and 4 of these (80.0%) had normal Hex4 levels at month 48; 4 out of 5 (80.0%) ERT-naïve ambulatory patients had abnormal Hex4 measurements at baseline, and 1 of these (25.0%) returned to normal Hex4 levels at month 48, while the other 3 remained elevated.
Fig. 6
Percentage CFBL in a serum CK and b urine Hex4 in ambulatory patients over 48 months. Pooled data from cohorts 1, and 4 for ERT-experienced patients. aLower normal CK limit = 26 IU/L, upper normal CK limit = 192 IU/L. CFBL change from baseline, CK serum creatine kinase, ERT enzyme replacement therapy, Hex4 urine glucose tetrasaccharide, SD standard deviation, SE standard error
Efficacy outcomes: non-ambulatory ERT-experienced patients (cohort 2)Limited long-term efficacy data are available for the non-ambulatory ERT-experienced cohort 2. Percent predicted sitting FVC data were available for 2 non-ambulatory ERT-experienced patients after 36 months and 1 patient at 48 months of follow-up. After 36 months of follow-up, 1 patient improved and the other worsened compared with baseline. The patient with available data after 48 months of follow-up was generally stable compared with baseline (Supplementary Table S2).
Non-ambulatory ERT-experienced patients showed durable mean percent reductions from baseline in plasma CK levels: 20.8% (n = 5), 25.3% (n = 5), 27.1% (n = 3), and 23.7% (n = 2) at 12, 24, 36, and 48 months, respectively. In addition, a consistent decrease was also seen in urine Hex4 levels from baseline over the follow-up period. After 12, 24, 36, and 48 months, the mean percent decrease from baseline in Hex4 levels were 15.6% (n = 5), 34.1% (n = 5), 36.5% (n = 4), and 9.4% (n = 2), respectively (Supplementary Table S2).
PRO results are available for 2 non-ambulatory ERT-experienced patients up to 48 months of follow-up and demonstrate improved FSS and stable RHS scores compared with baseline. R-PAct scores also showed a mean improvement from baseline up to 48 months of follow-up in the 2 non-ambulatory ERT-experienced patients, indicating an improved ability to perform daily activities and participate in social situations (Supplementary Table S2). One patient reported no change, and 1 reported an improvement from baseline in SGIC’s overall physical wellbeing. The PGIC results for the 2 ERT-experienced non-ambulatory patients showed no change for 1 patient and a decline for the other (Supplementary Table S3).
Pharmacokinetic outcomesBlood sampling for plasma GAA protein and miglustat concentrations was taken for cohort 1 (ERT experienced) and cohort 3 (ERT naïve) only. Blood sampling for PK was not performed for cohort 2 (non-ambulatory ERT-experienced) or cohort 4 (ERT-experienced) due to the expected similarity in PK assessments to cohort 1 and to prevent any undue burden on patients. Plasma total GAA protein, measured by signature peptide T09, increased dose-dependently after single ascending doses of 5 mg/kg, 10 mg/kg and 20 mg/kg cipaglucosidase alfa (Supplementary Fig. S2). Generally, the median time of peak signature peptide T09 concentrations (tmax) was similar across all treatments and consistent with the duration of cipaglucosidase infusion of approximately 4 h. Exposures (Cmax and the area under the plasma drug concentration–time curve [AUC]) increased dose-dependently. Plasma total GAA protein exposures were similar between cohort 1 and cohort 3 ambulatory patients. Plasma miglustat exposures increased dose-dependently in cohort 1 ambulatory patients. PK outcomes are summarized in Supplementary Tables S4 and S5.
Plasma total GAA protein by signature peptide T09 AUCs were estimated by population PK analysis (median: 1700 µg·h/mL, range: 1520 to 1870 µg·h/mL) at 24 months from cohorts 1 and 3. The data were similar to AUCs estimated by noncompartmental analysis (median: 1796 µg·h/mL, range: 1240 to 2652 µg·h/mL) following the first and third doses at 20 mg/kg cipaglucosidase alfa + 260 mg miglustat from cohort 1 and cohort 3 (Supplementary Fig. S3).
Administration of miglustat 1 h before cipaglucosidase alfa infusion resulted in greater AUCs than 20 mg/kg cipaglucosidase alfa alone (Supplementary Fig. S2). The distribution phase half-life was increased by 26.7% and 47.7% following 130 mg and 260 mg miglustat co-administration, respectively (mean t1/2α [CV%, percentage coefficient of variation]: cipaglucosidase alfa 20 mg/kg, 1.52 h [9.2]; cipaglucosidase alfa 20 mg/kg + miglustat 130 mg first dose, 1.9 h [10.6]; cipaglucosidase alfa 20 mg/kg + miglustat 260 mg first dose, 2.2 h [19.1]; Supplementary Table S4). Miglustat was rapidly cleared from circulation.
SafetyCipa + mig was generally well tolerated; safety outcomes are shown in Table 2. The most frequently reported treatment-emergent adverse events (TEAEs; > 40% of patients) for the overall population were falls, nasopharyngitis, diarrhea, headache, and arthralgia. Most TEAEs were mild or moderate in severity. TEAEs leading to study withdrawal occurred in 2 patients: 1 patient in cohort 1 had diffuse large B-cell lymphoma, which the investigator assessed as unrelated to treatment, and 1 patient in cohort 2 had a drug-related TEAE of urticaria, considered to be an IAR. The incidence of IARs was similar between ERT-experienced (48%) and ERT-naïve (50%) cohorts. Most patients who experienced IARs responded well to pre-infusion medications given to mitigate IARs and continued on study treatment.
Table 2 Summary of adverse eventsImmunogenicity outcomesImmunogenicity data up to the data cutoff date of December 13, 2021, are presented. The mean (SD) duration of cipa + mig treatment was 48.4 (18.04) months for patients tested for ADAs at the data cutoff date. At baseline, ADAs were present in 21/23 ERT-experienced patients (median titer 12,800 [range 200–1,638,400]) and 1/6 ERT-naïve patients (titer 400), based on a cutoff established using 75 ERT-naïve human plasma samples (Supplementary Section S1). In patients with available data after 48 months of follow-up, the median (range) ADA titer was 9600 (1600–1,638,400; n = 9) for ERT-experienced patients and 3200 (800–1,638,400; n = 5) for ERT-naïve patients. After treatment with cipa + mig, ADAs were present in all patients, meaning that 2 ERT-experienced patients seroconverted with a median peak titer of 1,664,000 (interquartile range [IQR] calculated as the difference between the upper and lower quartiles [Q3–Q1], 1,612,800) and 5 ERT-naïve patients seroconverted, with a median peak titer of 102,400 (IQR, 51,200). In ERT-experienced patients with ADAs at baseline, titers increased by ≥ fourfold in 17 patients with a median peak titer of 102,400 (IQR, 102,400). In the ERT-naïve patient with ADAs at baseline, the peak titer was 3,276,800 after treatment.
Most ERT-experienced patients (22, 95.7%) and all ERT-naïve patients tested positive for at least one type of NAb at intermittent time points (Supplementary Section S1). At baseline, 12 ERT-experienced patients and no ERT-naïve patients tested positive for antibodies cross-reactive to alglucosidase alfa. After treatment, 17 ERT-experienced patients and 5 ERT-naïve patients were positive for antibodies cross-reactive to alglucosidase alfa.
Anti-rhGAA IgE antibodies were measured at baseline for 21 of 23 ERT-experienced patients and all 6 ERT-naïve patients and after treatment only if anaphylaxis or a moderate to severe IAR occurred, as determined by the study investigator. One ERT-experienced patient and none of the ERT-naïve patients were positive for anti-rhGAA IgE antibodies at baseline. Six patients were tested for anti-rhGAA IgE antibodies post-treatment (after an IAR), and 1 ERT-naïve patient tested positive.
留言 (0)