Participants and research plan
This case-control study was conducted between June 2020 and September 2021 at the specialized nutrition clinic of Zanjan University of Medical Sciences. The study included two groups: obese individuals with low-calorie intake and non-obese individuals with high-calorie intake. The sample size for the study was determined to be 70 subjects, with 35 participants in both the case and control groups, based on Yang et al.‘s research [15]. The study was conducted in compliance with the Declaration of Helsinki and the protocol of the research was approved by the Ethics Committee of the Zanjan University of Medical Sciences (Ethics Code: IR.ZUMS.REC.1399.089) and the Ethics Committee of the National Institute for Medical Research Development (Ethics Code: IR.NIMAD.REC.l397.539). Before the data collection, participants were explained the aims and methodology of the study and then were asked to sign a written informed consent letter.The study was approved by the Prior to the commencement of the study, written informed consent was obtained from all participants.
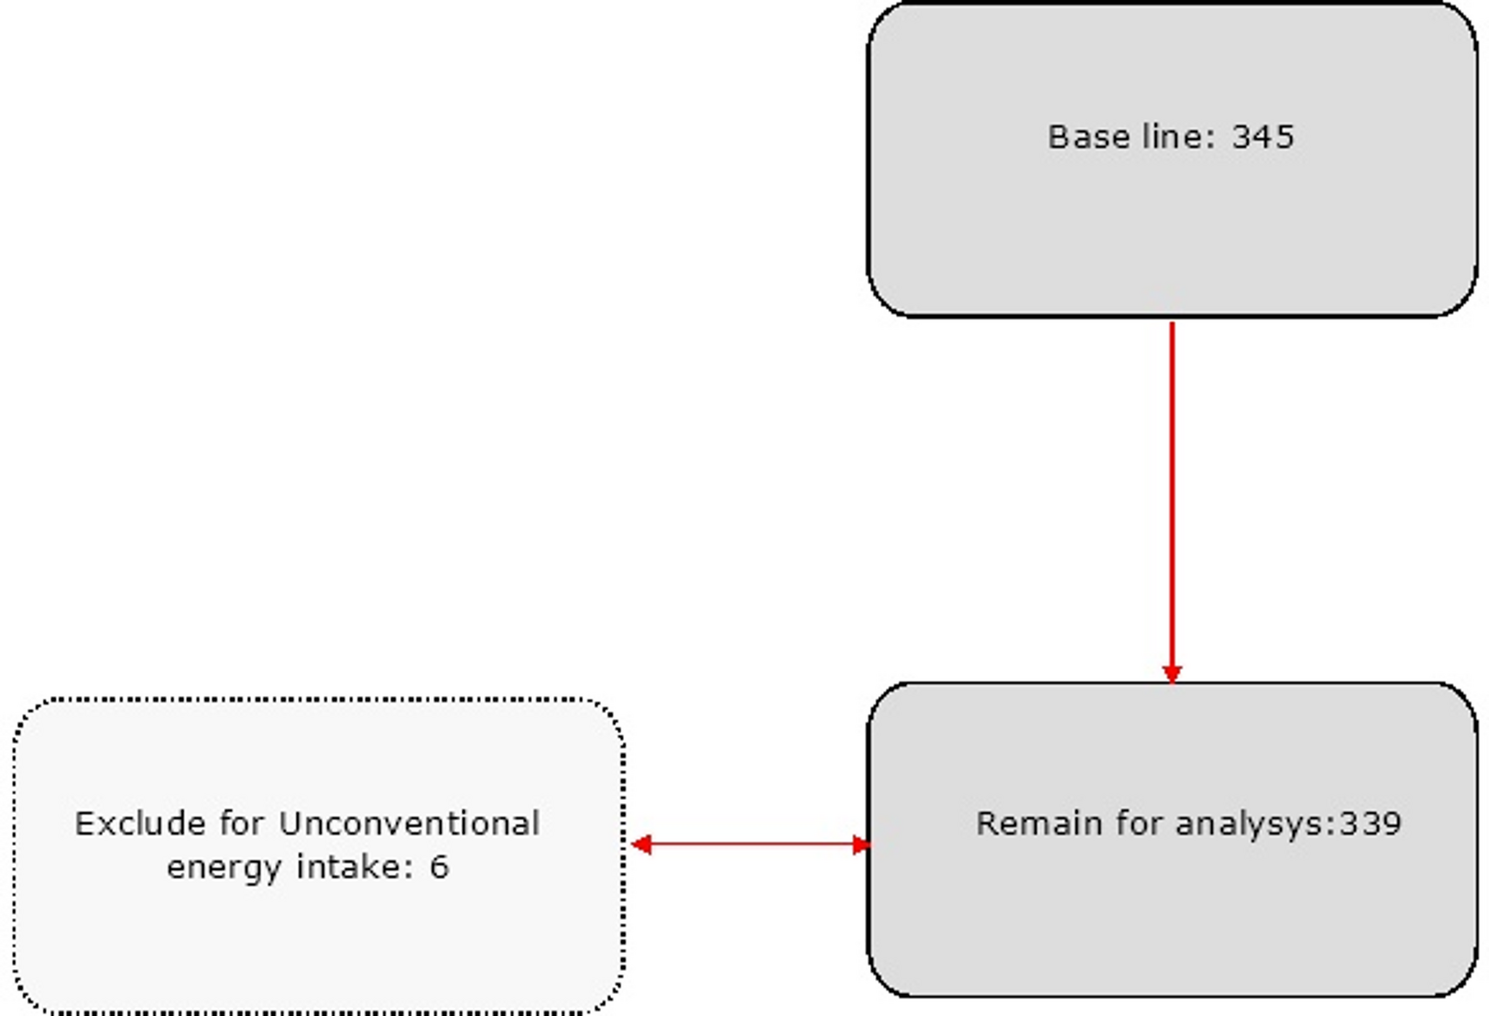
The case group consisted of 36 subjects who were classified as obese with a BMI greater than 30. These individuals were recognized by their friends and family as having a low appetite, and their average daily calorie intake was determined to be less than 50% of the required calories based on the Mifflin St. Jeor equation, which was calculated using a 3-day, 24-hour recall method [21]). The control group consisted of 41 participants who had a BMI of less than 25 kg/m2. These individuals were recognized by their peers as having a high appetite, and their average daily energy intake was estimated to be more than 50% of the required calories.
Individuals who had been on a weight reduction diet within the past year, had a disease that could impact weight (such as diabetes, thyroid disorders, cancer, polycystic ovary syndrome, etc.), or were taking medications that could affect weight (such as corticosteroids) were not included in the study.
General questionnaires
All participants provided sociodemographic information, including their age, gender, ethnicity, and history of disease or drug use. The participants’ height and weight were measured while they were fasting and wearing light clothing, and Body mass index (BMI) was calculated by dividing the weight (kg) by height squared (m2).
Dietary intake assessment
The researchers used a semi-quantitative food frequency questionnaire (FFQ) consisting of 147 food items to collect dietary data. Trained dietitians asked participants about their intake frequency for each food item they consumed over the past year, with responses recorded as daily, weekly, or monthly intakes, and then converted to weekly intakes. Previous studies have evaluated and confirmed the validity and reliability of this questionnaire for assessing the dietary intake of the Iranian population [22]. Individuals with a daily energy intake greater than 4300 or less than 670 kcal were excluded. The FFQ consisted of 23 fatty food items (such as fried potatoes, canned tuna, haslet, hamburgers, sausages, rumen, Khash, animal tongue and brain, whole-fat milk, whole-fat yogurt, full-fat cheese, cream, butter, margarine, fried onion, oil, mayonnaise and mayonnaise-based products, peanut butter, fried eggs, chocolate- or nut-based spread, nuts and seeds, chocolate-based candies, cake/pudding/cookies) and 19 sweet items (including fruit juices, carbonated sugar-sweetened drinks, sugar-sweetened drinks not carbonated, flavored milk, sugar added breakfast cereals, ice cream, raisin, fruit compote, sugar, honey, gaz (a Persian candy), sohan (a Persian candy), candy, halva, jam, cake/pudding/cookies, sweetened coffee and sweetened tea). To calculate the sweet and fatty food propensity scores, the consumption frequency of each sweet and fatty food was divided by the consumption frequency of all foods in the FFQ and multiplied by 100. This resulted in a continuous variable with scores ranging from 0 to 100% indicating the preference for sweet and fatty food. [23, 24].
DNA extraction and genotyping
To conduct genetic evaluations, 10 ccs of venous blood were drawn from all participants and placed in vacuum collection tubes containing EDTA. Genomic DNA was extracted from a peripheral blood sample of each participant using a DNA extraction kit according to the manufacturer’s instructions (Viragen, Tehran, Iran). The quality of the extracted DNA was assessed by measuring OD260/OD280 and concentration using a nanodrop instrument (Eppendorf, Germany). The FTO gene’s single nucleotide polymorphism (SNP) rs9939609(A/T) was directly genotyped by amplifying the rs9939609(A/T) region of the gene using gene-specific oligonucleotide primers. Genotypes for the FTO rs9939609 polymorphism (TT/AT/AA) were determined via amplification refractory mutation system polymerase chain reaction (ARMS-PCR). Table 1 S and Table 2 S display the primer sequences and PCR conditions. Each PCR was initially conducted in a 25 µL mixture, which included 300 ng of genomic DNA, 10 pM of each primer, and 25 µl of 2× Master Mix (Fermentas, USA) containing Taq DNA polymerase, MgCl2, dNTPs, and reaction buffers. The PCR products were then analyzed through 2% agarose gel electrophoresis and viewed under UV light. Next, 25 µl of each PCR product with the forward primer was sent for direct sequencing (Pishgam, Tehran, Iran). Sequencing was performed using the Sanger method on an ABI 3730 sequencer. The resulting sequences were analyzed using BLAST, Clustal X2, and Chromas V2.4 software.
Statistical analysis
The Kolmogorov-Smirnov test was utilized to assess whether the variables were normally distributed. As the data was found to be normally distributed, a t-test for independent samples was employed to compare the means between the two groups. Logistic regression was conducted to compute the odds ratio, with age and sex included in the model as confounding variables. The Hardy-Weinberg Equilibrium (HWE) was performed to evaluate the genes variant among cases and controls, and the chi-square test was used to compare the allelic frequency distributions between different variants. IBM-SPSS software version 26 was utilized to analyze all of the data, and a p-value of less than 0.05 was considered statistically significant.


Comments (0)