
記住我
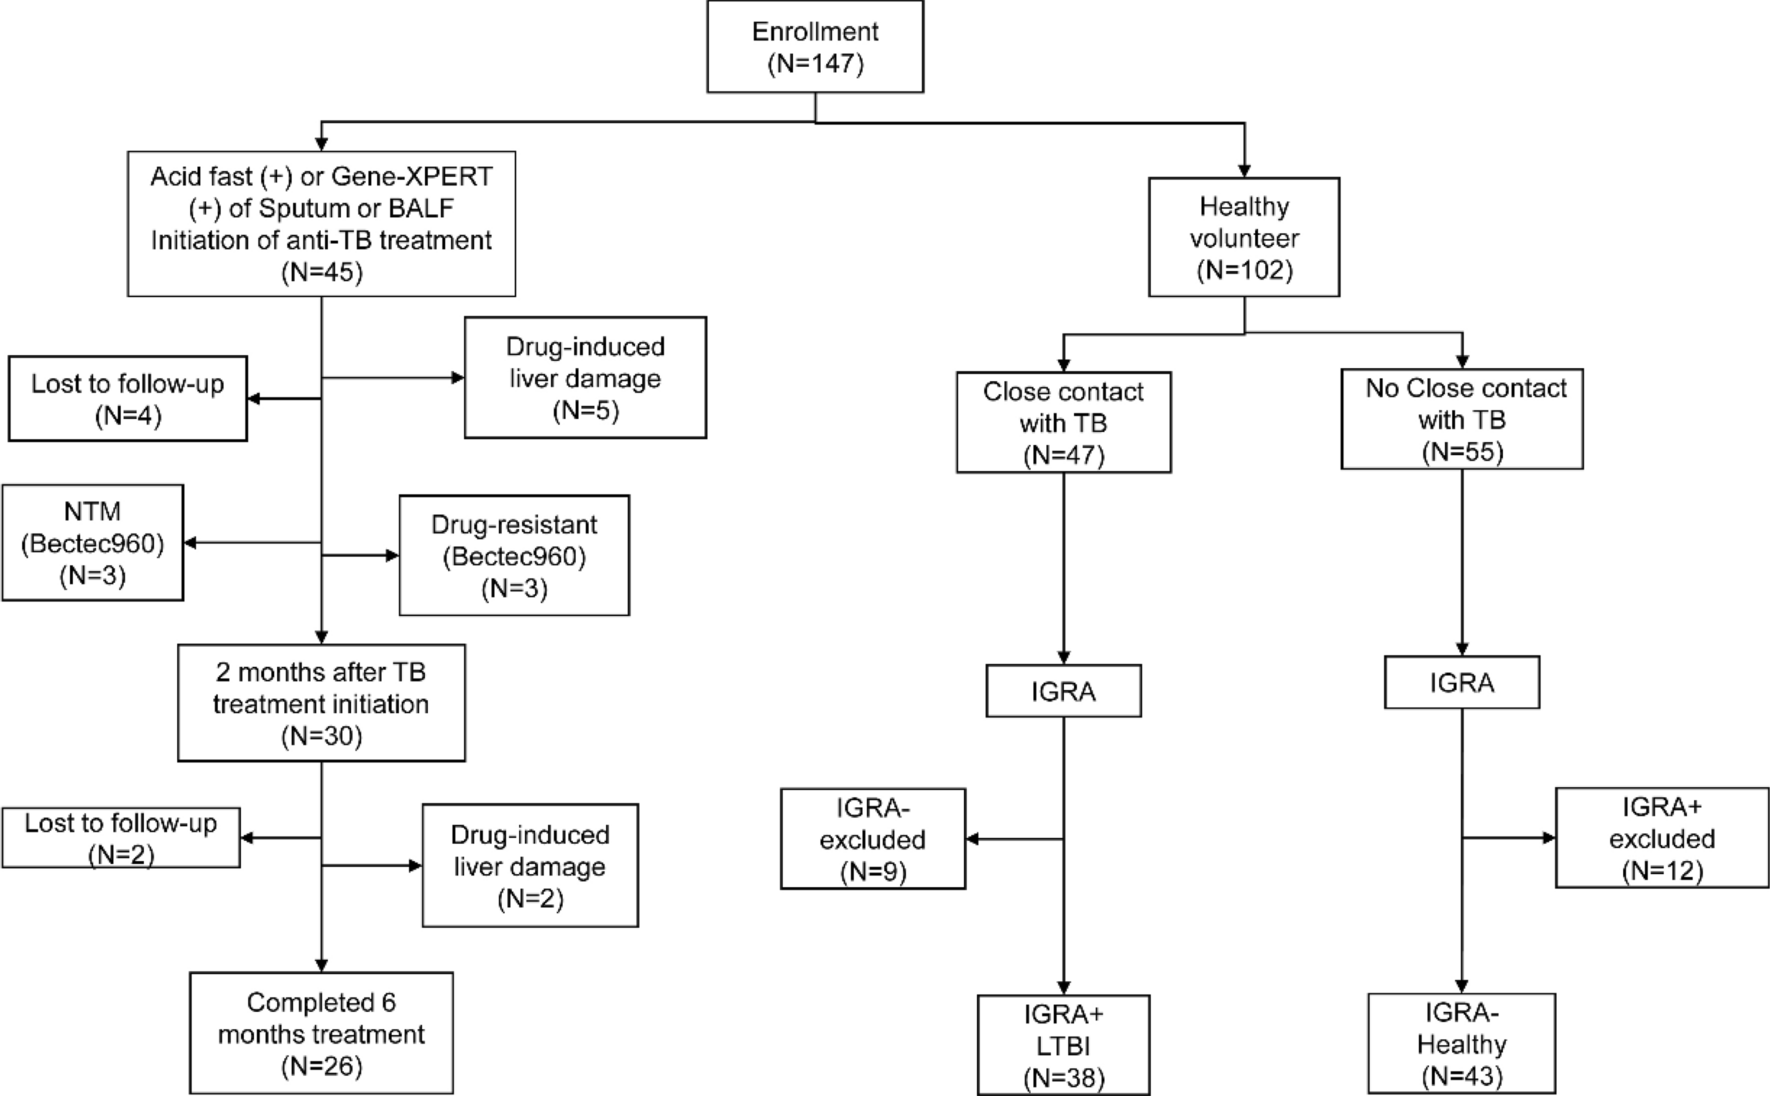


In this cross-sectional study, the inspected population was sequentially selected from community-dwelling residents who undertook annual medical examinations and LSM in Zhongnan Hospital of Wuhan University in the year of 2019 (from January 1, 2019, to December 31, 2019). Clinical data of 6315 participants were obtained. After running our exclusion criteria listed in Fig. 1, a total of 5791 participants were enrolled in the final analysis. Exclusion criteria were as follows: invalid liver stiffness measurement data, missing baseline data, age under 18 or pregnant, diagnosed with hepatocellular carcinoma or advanced liver cirrhosis (Child–Turcotte–Pugh B and C), other known liver disease (hepatitis B and C, etc.), heavy alcohol drinking [14] (alcohol intake > 30 g/d for males and > 20 g/d for females), human immunodeficiency virus infection, and current use of medication.
Fig. 1
All procedures were conducted following the Helsinki Declaration of 1975, with revisions made in 2008, and were approved by the Ethics Committee of Zhongnan Hospital of Wuhan University (The Approval Number is 2021094 K).
Clinical and laboratory data collectionThe demographic features, comorbidities, laboratory findings and other relative information was accumulated from the hospital records. Data concerning co-morbidities were collected from the self-report questionnaire recording in the hospital records. Coronary heart disease (CHD) was defined as having been diagnosed in a medical institution with coronary angiography. Hypertension was defined as the use of antihypertensive agents or having been diagnosed in a medical institution. Diabetes was defined as receiving oral hypoglycemic agents or insulin treatment, or having been diagnosed in a medical institution. All blood samples were collected in the morning after an overnight fast and were processed within 2 h of collection. Blood Urea nitrogen (BUN), and creatinine were measured by enzymatic method. Alanine aminotransferase (ALT) and aspartate aminotransferase (AST) were measured by velocity method. Automated chemistry analyzer (Beckman Coulter chemistry analyzer AU5800 series, Tokyo, Japan) was used for measuring the levels of fasting blood–glucose (FBG), Uric acid, total cholesterol (TC), high-density lipoprotein cholesterol (HDL), low-density lipoprotein cholesterol (LDL) and triglycerides (TG). Two independent investigators were involved in reviewing medical records to ensure data accuracy.
BMI was computed on the basis of weight in kilograms and height in meters. All participants were divided into four different groups according to the calculated BMI. The categories of BMI were based on the epidemiology of obesity in China and defined as followed [15, 16]: underweight (BMI < 18.5 kg/m2), normal weight (BMI 18.5–23.9 kg/m2), overweight (BMI 24–27.9 kg/m2) and obese (BMI ≥ 28 kg/m2).
Fasting blood was collected from peripheral venous. To ensure sample consistency, laboratory tests and LSM were performed on the same date, within a time window of no more than 3 h.
Liver stiffness measurement (LSM)LSM was detected with a FibroScan device (Echosens, Paris, France) on the right lobe of the liver. Depends on the BMI level, a 3.5 MHz standard M probe or a 2.5 MHz XL probe were used to examine their LS value [17]. The characteristics, principle and procedure of TE have been described in detail previously [18]. Participants were also requested to an overnight fast before TE measurements. Participants who could not complete the test were excluded from the study. The ratio of the inter-quartile range (IQR) of LSM to the median (IQR/M), as an indicator of variability, was calculated. Only the measures with an IQR/M ratio of the LSM value < 0.3, a success rate of at least 60% and at least ten valid consecutive measurements were considered as reliable. LSM that did not meet these criteria of reliability was, therefore, excluded [19].
A strong correlation between LSM using TE and the stages and severity of liver fibrosis was observed in previous studies [20, 21]. The optimal LSM threshold for elevated LS varies in different populations and in people with various etiology of chronic liver diseases. A recent study reported that a TE cutoff of 9.1 kPa would be more accurate when diagnosing significant fibrosis (≥ F2) in both European and Asian populations [22]. Therefore, we adopted this value in the current study, and thus, a liver stiffness threshold larger than 9.1 kPa was categorized as elevated LS.
Statistical analysisWhile categorical variables were presented as frequencies and proportions, continuous variables were presented as mean ± SD or median and interquartile. To analyze the differences among the BMI classifications, we used the one-way ANOVA to assess normally distributed continuous variables, the Kruskal–Wallis test for skewed continuous variables and the Chi-squared test for categorical variables.
BMI were first treated as a categorical variable and then as a continuous variable in our analysis. The underweight category was the reference for BMI classifications. We used univariate and multivariate logistic regression models to evaluate the relationship between BMI and elevated LS. Thus, original and adjusted odds ratios (ORs) and corresponding 95% confidence intervals (CIs) were computed accordingly. Considering the clinical significance, we included age, gender, mean arterial pressure (MAP), history of coronary heart disease, diabetes, hypertension, ALT, FBG, creatinine, TG, TC and HDL in the multivariate adjusted models. We selected these variables on the basis of their associations with the outcomes of interest and changes in effect estimates by at least 10% as well. The generalized additive model (GAM) was adopted to identify the non-linear relationship. Once the non-linear correlation was detected, a two-piecewise linear regression model was performed to calculate the threshold effect in terms of the smoothing plot. The segmented regression model and likelihood ratio test (LRT) were used to explore the threshold effect [23]. P values less than 0.05 (two-sided) were considered statistically significant. All statistical analyses were performed using Empower(R) software (www.empowerstats. com, X&Y solutions, Inc., Boston, MA) and R software (http://www.R-project.org).
留言 (0)