
記住我

Colorectal cancer (CRC) is a common malignant tumor worldwide.[1,2] Type 2 diabetes mellitus (T2DM) is an independent risk factor for CRC.[3,4] The positive association between T2DM and CRC risk did not decrease when the meta-analysis was limited to studies that controlled for smoking and body mass index (BMI).[5] In addition, CRC patients with T2DM are at a greater risk for cancer-specific mortality (CSM) and relapse and have worse disease-free survival (DFS) than non-diabetic patients.[6,7] Early research established that compared with patients who are non-diabetic, those who have diabetes would have a shorter 5-year survival with respect to the colorectal, colon, and rectal cancers, with 18%, 19%, and 16% decreased overall survival (OS), respectively.[8]
Gut microbiota (GM), including bacteria, archaea, fungi, and viruses, have co-evolved with the host for millions of years to form an intricate and mutually beneficial relationship.[9] GM offers several benefits to the host through various physiological functions, such as strengthening gut integrity or shaping the intestinal epithelium, harvesting energy, protecting against pathogens, and regulating host immunity.[10] Correlations between changes in the composition and activity of the GM and common disorders, such as inflammatory bowel diseases (IBD), obesity, diabetes, and malignant diseases, have been proposed, increasing the interest of the scientific community in this research field.[11] Currently, most GM are not traditionally available for culture. Metagenomics has emerged as one of the most powerful sequence-driven approaches for studying the composition and genetic potential of GM in the development of human diseases.
Data from in vitro, animal, and human studies have suggested that GM may be involved in the etiopathogenesis of cancer.[12] Although the composition and function of GM are affected by dietary habits and the environment, composition and diversity of GM, including bacteria, fungi, and viruses, are significantly different between patients with CRC and healthy people, whether in intestinal mucosal tissues or feces.[13–15] Dynamic changes in the microbial composition, gene abundance, and metabolites of GM were observed through metagenomics and metabolomics during the different stages of CRC.[16] Likewise, the composition of the GM changes in both animal models and patients with T2DM.[17] The total bacterial and gene count are evidently similar between T2DM patients and healthy controls, but the diversity of GM is significantly decreased in T2DM patients.[18] Short-chain fatty acids (SCFAs) and bile acids (BAs) are mostly microbial metabolites produced during anaerobic fermentation in the gut and act as central components in microbe-to-host signaling pathways.[19] As the inhibitory effect of butyrate on histone deacetylase enzymes promotes carcinogenesis,[20] the SCFAs might regulate blood glucose concentrations through an increase in insulin secretion mediated by glucagon-like peptide-1.[21]
Currently, research on GM, CRC, and T2DM has shifted from descriptive to applied studies. However, the characteristics of GM in CRC patients with T2DM remain unclear. From this perspective, a comprehensive and detailed view of the human GM, in terms of phylogenetic composition, as well as genetic and metabolic potential, is essential to understand the dynamics and possible mechanisms of the cause–effect relationships between GM and pathology.
Methods Ethical approvalThe study protocol was approved by the Ethical Committee of Peking University Shougang Hospital (No. SGYYZ201701) and performed according to the Declaration of Helsinki.
Study subjects and sample collectionAll samples and clinical information of the study were obtained between October 2018 and January 2020 under conditions of written informed consent. In total, the study included 36 individuals, consisting of CRC patients diagnosed with T2DM (DCRC group, n = 12), non-diabetic CRC patients (CRC group, n = 12), and healthy controls (Health group, n = 12). Stool samples were collected by individuals in hospital, followed by immediate transportation to the laboratory within 0.5 h, separation into cryogenic storage tubes, and storage at −80°C before analysis.[22]
CRC groupInclusion criteria were the following: (1) Inpatients aged 18–85 years; (2) Colonoscopic biopsy, pathological diagnosis of colorectal adenocarcinoma; (3) No diabetes; (4) No neoadjuvant therapy. Exclusion criteria were the following: (1) Familial adenomatous polyposis (FAP); (2) Lynch syndrome; (3) Family history of digestive tract tumors; (4) History of ulcerative colitis or Crohn's disease; (5) Usage of antibiotics in the past two weeks; (6) Smoking and alcohol habits; (7) Patients with severe cardiovascular and cerebrovascular diseases or multiple organ failure.
DCRC groupInclusion criteria were the following: (1) Inpatients aged 18–85 years; (2) Colonoscopic biopsy, pathological diagnosis of colorectal adenocarcinoma; (3) Combined with the diagnosis of T2DM; (4) No neoadjuvant therapy. Exclusion criteria: (1) FAP; (2) Lynch syndrome; (3) Family history of digestive tract tumors; (4) History of ulcerative colitis or Crohn's disease; (5) Usage of antibiotics in the past two weeks; (6) Smoking and alcohol habits; (7) Patients with severe cardiovascular and cerebrovascular diseases or multiple organ failure.
Health groupHealthy individuals were selected as controls and were matched according to sex and age during a routine physical examination.
All patients with CRC were classified according to their post-operative clinical data, using the tumor-node-metastasis (TNM) staging system for malignant tumors.[23]
DNA extractionDNA was extracted from frozen stool samples (approximately 200 mg) using a Qiagen DNA Stool Mini Kit (Tiangen Biotechnology Co., Beijing, China). The concentration and quality of the extracted DNA were determined using a NanoDrop spectrophotometer (Thermoscientific, Waitham, MA, USA), and integrity and purity were assessed using agarose gel electrophoresis (TransGen Biotech, Beijing, China). After final precipitation, the DNA samples were resuspended in TE buffer and stored at −80°C until further analysis.
Metagenomic sequencing and annotationMetagenomic sequencing using the Illumina HiSeq 2000 platform (Illumina, San Diego, CA, USA), generating gene profiles using gene catalog, constructing metagenomic linkage groups, and generating Kyoto Encyclopedia of Genes and Genomes ortholog, module, and pathway profiles, were all performed using previously published methods.[24] Species-level molecular operational taxonomic units (mOTUs) were obtained using mOTU profiling software.[25] All samples were sequenced with a 150-bp read length to a targeted data size of 5.0 Gb.
SCFAs analysisMethanol and tert-butyl methyl ether (Chromasolv grade), sodium bicarbonate and hydrochloric acid (reagent grade), acetic acid, propionic acid, butyric acid, isobutyric acid, valeric acid, and isovaleric acid (analytical standard grade) were purchased from Sigma–Aldrich (Milan, Italy). MilliQ water (18 MΩ) was obtained from Millipore's simplicity system (Milan, Italy). SCFA analyses were performed using an Agilent gas chromatography-mass spectrometry (GC-MS) system.[26] The SCFA in the samples was analyzed in free acid form using a Supelco Nukol column of 30 m length, 0.25 mm internal diameter, and 0.25 μm of film thickness with the temperature program as follows: the initial temperature of 40°C was held for 1 min, then it was increased to 150°C at 30°C/min, and finally up to 220°C at 20°C/min. Approximately 1 μL aliquot of the extracted sample was injected in the spitless mode (spitless time 1 min) at 250°C, whereas the transfer line temperature was 280°C. The carrier flow rate was maintained at 1 mL/min.
BA analysisBAs were added to the fecal samples as reference standards, and an external standard method was used for preliminary measurements. The concentration of BAs in the feces was measured using liquid chromatography-mass spectrometry (LC-MS), as previously described.[27] Briefly, freeze-dried feces were thoroughly ground, suspended in 5 mL of chromatographic ethanol, and extracted by vortexing and sonication at 30°C for 60 min. The pooled extract was then centrifuged twice (10 min, 10,000 r/min, 4°C). The supernatant (4 mL) was concentrated and dried under a nitrogen atmosphere. Chromatographic methanol was used to dissolve the samples, and the extracts were passed through a 0.22-μm filter. The filtrate was stored at 4°C and analyzed using an Agilent 1260 Series liquid chromatography combined with a 6120B mass spectrometer. The concentrations of the individual BAs in each group were calculated based on the peak areas.
Statistical analysisGraphPad Prism version 8.0 (GraphPad, San Diego, USA) and SPSS version 24.0 (IBM Corp, Armonk, USA) were used for statistical analysis. The measurement data were expressed as mean ± standard deviation (SD), and the distribution was determined by the Kolmogorov–Smirnov normality test. One-way analysis of variance (ANOVA) followed by Tukey's post-hoc test was used to evaluate the statistical significance of differences among the three groups. A two-tailed Student's t test was used to evaluate the statistical significance between the two groups. The quantitative data were expressed as case number (%) and was performed with the chi-squared test. To compare the microbiota between the two groups, we performed LEfSe analyses in addition to the t test. Statistical significance was set at P < 0.05. Correlation coefficients anaysis was performed using Spearman's correlation coefficients between species and metabolites. P < 0.05 was considered statistically significant. In addition, a Benjamini–Hochberg false-discovery rate-corrected P value was estimated.
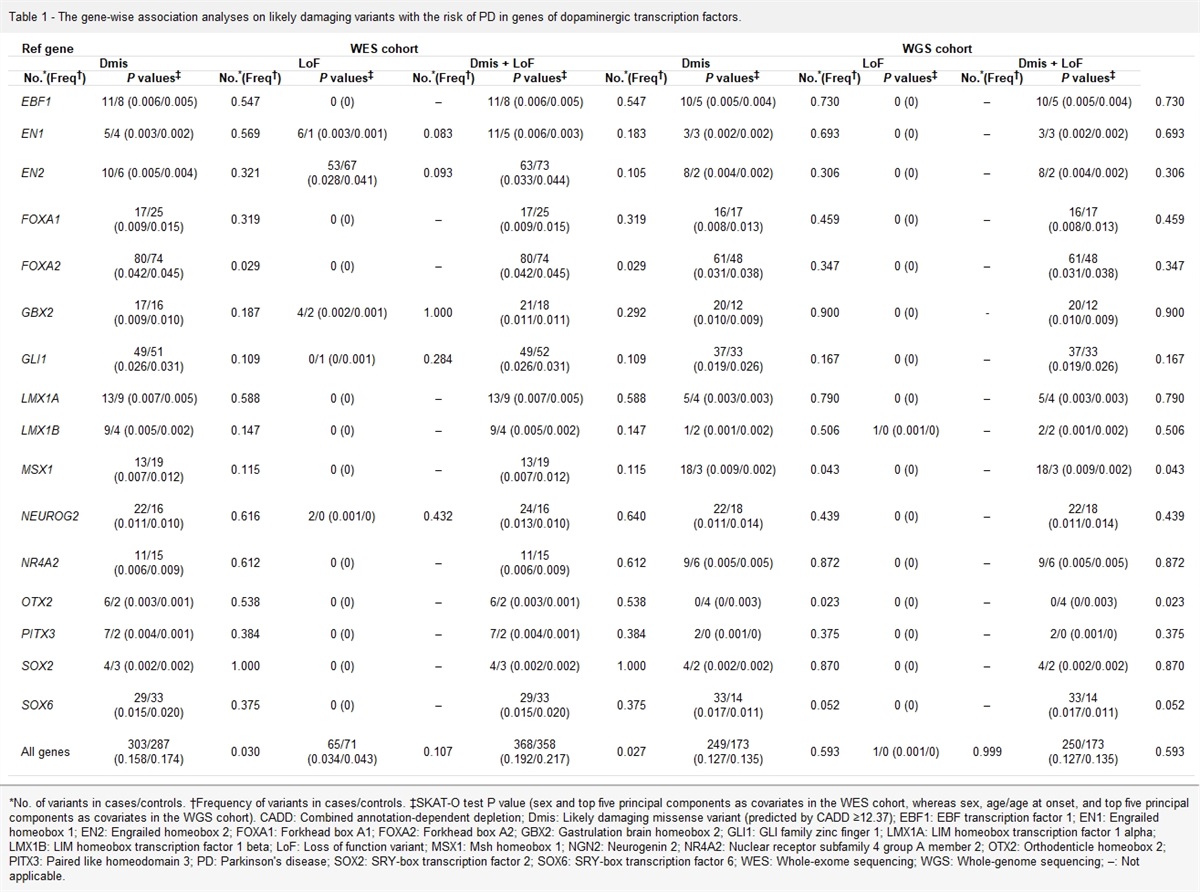
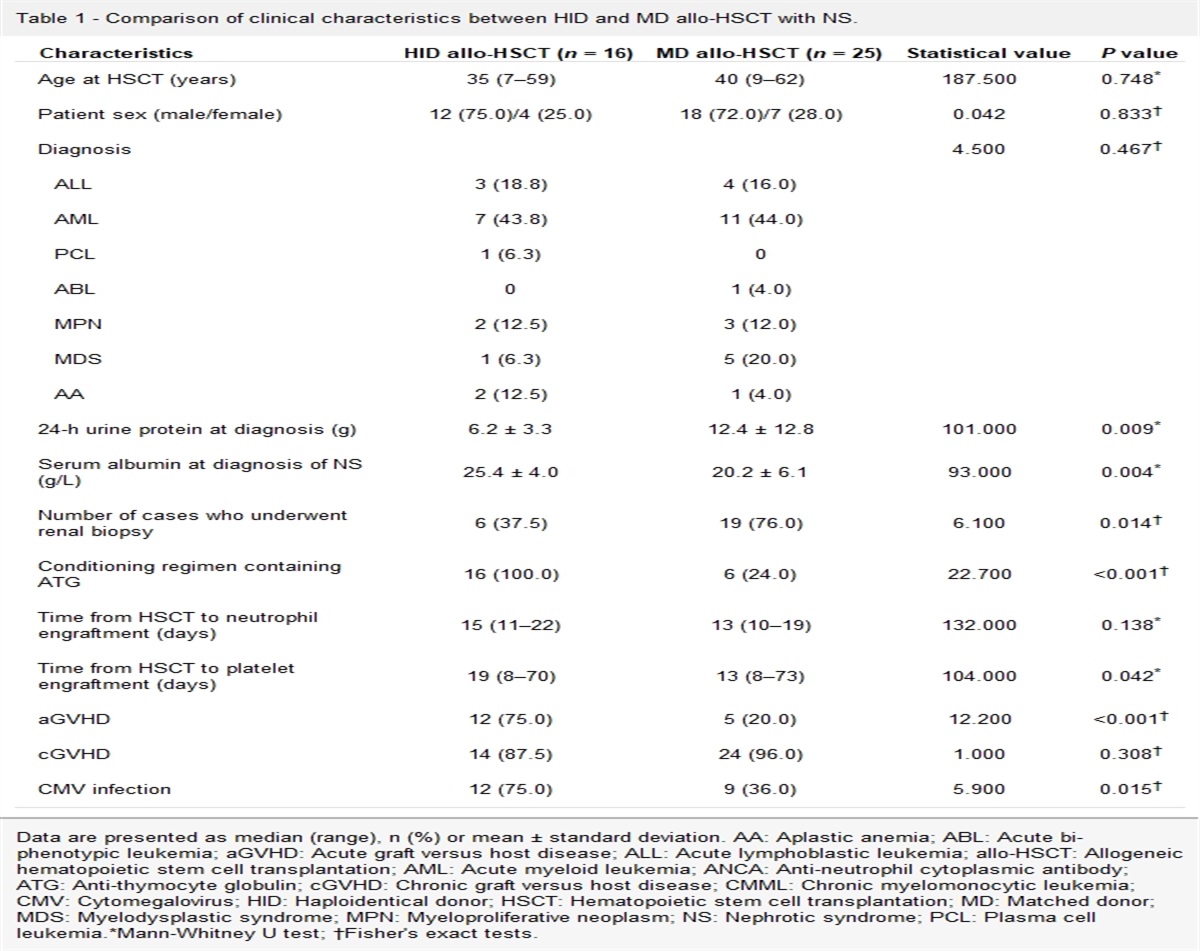
Results Demographic and clinical features of subject groupsThe DCRC group comprised 12 CRC patients with T2DM (6 men and 6 women), with a mean age of 60.8 ± 6.1 years. The CRC group comprised 12 CRC patients without diabetes (6 men and 6 women), with a mean age of 58.1 ± 8.0 years. The Health group comprised 12 individuals (6 men and 6 women), with a mean age of 57.7 ± 5.1 years. No statistically significant differences were found in terms of age, sex distribution, or BMI among the three groups (P > 0.05). The mean fasting plasma glucose value of the DCRC group was higher than that of the other groups (P < 0.001). The pathological prognostic stage, tumor location, and pathological differentiation were similar between the DCRC and CRC groups (P > 0.05) [Table 1].
Table 1 - Demographic and clinical features of CRC patients with T2DM, CRC patients without diabetes, and healthy controls. Items DCRC group (n = 12) CRC group (n = 12) Health group (n = 12) Statistics P value Age (years, mean ± SD) 60.8 ± 6.1 58.1 ± 8.0 57.7 ± 5.1 F = 0.084 0.441 Gender (n) Male 6 6 6 – – Female 6 6 6 – – BMI (kg/m2, mean ± SD) 24.21 ± 1.09 23.79 ± 1.18 23.28 ± 1.40 F = 1.736 0.192 Fasting plasma glucose (mmol/L, mean ± SD) 10.68 ± 3.54 5.36 ± 0.40∗ 5.40 ± 0.61∗ F = 23.751 <0.001 Pathological prognostic stage group (n) Stage I 2 2 – χ 2 = 1.000 0.801 Stage II 2 4 – Stage III 7 5 – Stage IV 1 1 – Tumor location (n) Left semicolon (including rectum) 8 9 – χ 2 = 0.202 0.653 Right semicolon 4 3 – Pathological differentiation (n) Well 1 1 – χ 2 = 2.200 0.333 Moderate 9 11 – Poor 2 0 –BMI: Body mass index; CRC: Colorectal cancer patients not having diabetes; DCRC: CRC patients with T2DM; SD: Standard deviation; T2DM: Type 2 diabetes mellitus; –: No data.
∗P < 0.001, compared with DCRC group.
The common and unique gene information between different groups was analyzed and plotted as a Venn graph. The total number of genes in the three groups reached 1,811,101, and the common number of genes reached 1,155,800 between the three groups. The number of genes exclusively present in the Health, CRC, and DCRC groups were 122,443, 73,556, and 65,784, respectively [Figure 1A]. According to the species annotation results, the species with the top 30 maximum abundances at the genus level were selected to generate a column accumulation map of the relative abundance of the species to visually view those with a high relative abundance and their proportion. The results showed that the relative abundance of bacteria at the genus level in the three groups was similar, but the proportion of genera was different. The 15 most abundant bacteria were Bacteroides, Alistipes, Clostridium, Faecalibacterium, Bifidobacterium, Parabacteroides, Ruminococcus, Prevotella, Roseburia, Eubacterium, Blautia, Akkermansia, Porphyromonas, Lactobacillus, and Phascolarctobacterium [Figure 1B].
 Figure 1:
 Information of genes and the species abundance at the genus (Top 30) level between different groups. (A) Each circle represents a group; the number overlapping the circle and the part of the circle represents the number of genes shared between the groups. (B) The horizontal axis represents the sample name; the vertical axis represents the relative proportion of species annotated to a certain type; the species category corresponding to each color block is shown in the legend on the right. A: Health group; B: CRC group; C: DCRC group; CRC: Colorectal cancer; DCRC: CRC patients with Type 2 diabetes mellitus.
All samples were quantified to detect fecal SCFAs and BAs. The results showed that the proportions of SCFAs in the Health group were acetic acid (approximately 40%), propionic acid (approximately 30%), butyric acid (approximately 20%), valeric acid (approximately 5%), isobutyric acid (approximately 2%), isovaleric acid (approximately 2%), and caproic acid (approximately 1%) [Figure 2A]. The proportions of isobutyric and isovaleric acids in the CRC and DCRC groups were higher than those in the Health group; however, the proportion of butyric acid was lower. The top 10 BAs in the Health group were 12-keto-lithocholic acid (LCA), deoxycholic acid (DCA), UCA, LCA, cholic acid (CA), alloLCA, hyodeoxycholic acid (HDCA), chenodeoxycholic acid (CDCA), alpha-α-muricholic acid, and isoLCA. However, the proportion of UCA in the CRC and DCRC groups was the highest [Figure 2B].
 Figure 2:
 Proportion of fecal SCFAs and BAs among different groups. (A) The horizontal axis represents the sample name; the vertical axis represents the relative proportion of SCFAs, and each color block represents one of the SCFAs in the legend on the right. (B) The horizontal axis represents the sample name; the vertical axis represents the relative proportion of BAs, and each color block represents one of the BAs in the legend on the right. A: Health group; B: CRC group; C: DCRC group; ACA: Allocholic acid; BAs: Bile acid; CA: Cholic acid; CDCA: Chenodeoxycholic acid; DCA: Deoxycholic acid; HDCA: Hyodeoxycholic acid; LCA: Lithocholic acid; MCA: Muricholic acid; SCFAs: Short-chain fatty acids; UCA: Ursocholic acid; UDCA: Ursodeoxycholic acid.
Characterization of fecal-associated microbiomes in CRC patients with T2DMTo study the characterization of composition and function based on metagenomics of CRC patients with T2DM, the DCRC group was compared with the other groups. Compared with the Health group, LEfSe analysis showed that the dominant species (LDA score >2) of the DCRC group in the genus included Veillonella, Peptostreptococcus, Porphyromonas and Parvimonas [Figure 3A]. Compared with the CRC group, LEfSe analysis showed that the dominant species in the DCRC group included Eggerthella, Hungatella, Allofustis, Indibacter, and Cellulophaga [Figure 3B]. Compared with the CRC and Health groups, the result showed that the dominant bacteria in the DCRC group included Veillonellales, Peptostreptococcus, Parvimonas and Olsenella [Figure 3C]. Functional abundance data between the groups were analyzed using LEfSe analysis, starting from the functional abundance tables at different levels. The results showed that the pathways with significantly different functions in the DCRC groups is Glutamine and glutamate metabolism [Figure 3D].
 Figure 3:
 LEfSe analysis of differences of composition and function among groups. (A) Differential analysis based on species abundance between the DCRC and CRC groups; (B) Differential analysis based on species abundance between the DCRC, CRC, and Health groups; (C) Differential analysis based on pathway functional abundance among the DCRC, CRC, and Health groups; (D) Functional abundance data among CRC and DCRC groups. CRC: Colorectal cancer; DCRC: CRC patients with Type 2 diabetes mellitus.
Fecal metabolite content is different among the DCRC, CRC, and Health groupsComparing the fecal SCFAs between groups revealed that the propionic acid level in the DCRC group was statistically higher than that in the CRC group (P < 0.05); However, butyric acid, isobutyric acid, and isovaleric acid levels in the DCRC group were lower than those in the Health group (P < 0.05) [Figure 4A]. Comparing fecal BAs among groups suggested that the DCA and 12-ketoLCA contents in the DCRC group were higher than those in the CRC and Health groups (P < 0.05) [Figure 4B].
 Figure 4:
 Comparison of the fecal SCFAs and BAs content between groups. (A) Box plot of differential SCFAs between groups; (B) Box plot of differential BAs between groups. ∗P < 0.05 and P > 0.01; ∗∗P < 0.01 and P > 0.001. ACA: Allocholic acid; BAs: Bile acids; CA: Cholic acid; CDCA: Chenodeoxycholic acid; CRC: Colorectal cancer; DCA: Deoxycholic acid; HDCA: Hyodeoxycholic acid; LCA: Lithocholic acid; MCA: Muricholic acid; SCFAs: Short-chain fatty acids; UCA: Ursocholic acid; UDCA: Ursodeoxycholic acid.
Correlation analysis of differential microflora and metabolites among groupsThe results of correlation analysis of differential GM and SCFAs levels revealed that the abundance of the most dominant bacteria in the DCRC group was negatively correlated with the level of butyric acid compared with the Health group, including Colwelliaceae, Colwellia, Tumebacillus, Caldiserica, Candidatus Kentron, Parvimonas, Desulfurispora, Sebaldella, and Veillonellales. Moreover, the abundance of mostly inferior bacteria was positively correlated with butyric acid levels, including Faecalibacterium, Thermococci, Methanoregula, Syntrophaceticus, and Sedimentisphaera [Figure 5A]. Correlation analysis with BAs level showed that the abundance of most dominant bacteria in the DCRC group was negatively correlated with the level of HDCA, ursodeoxycholic acid (UDCA), glycochenodeoxycholic acid (GCDCA), CDCA, CA, glycocholate (GCA), and betaCA, including Peptostreptococcus, Veillonellale, Veillonellaceae, Desulfurispora, Candidatus Kentron, Colwelliaceae, Colwellia, and Selenomonadales. In addition, the abundance of mostly inferior bacteria was positively correlated with the above BAs, including Faecalibacterium and Cellulophaga. However, the levels of NorCA, DCA, 12ketoLCA, and LCA were positively correlated with the abundance of the most dominant bacteria in the DCRC group [Figure 5B].
 Figure 5:
 Correlation analysis of differential bacteria with metabolites among groups. (A) Correlation of differential bacteria with the levels of stool SCFAs; (B) Correlation of Bdifferential bacteria with the levels of stool BAs, as determined by Spearman's rank test. ∗P < 0.05 and P > 0.01; ∗∗P < 0.01 and P > 0.001. BAs: Bile acids; CA: Cholic acid; CDCA: Chenodeoxycholic acid; DCA: Deoxycholic acid; GCA: Glycocholate; GCDCA: Glycochenodeoxycholic acid; HDCA: Hyodeoxycholic acid; LCA: Lithocholic acid; SCFAs: Short-chain fatty acids; UCA: Ursocholic acid; UDCA: Ursodeoxycholic acid.
DiscussionGM is involved in the development of T2DM and CRC. However, it is difficult to accurately determine the correlation between GM and T2DM or CRC because of the influence of common factors such as ethnicity, genetics, environment, geographic and climatic conditions, possible underlying diseases, lifestyle, and dietary habits of study subjects, as well as therapeutic drugs such as antibiotics, hypoglycemia, and anticancer drugs.[28,29] Therefore, we considered the above factors, as far as possible, at the beginning of the project design and determined the research object in strict accordance with the inclusion and exclusion criteria. The results revealed no statistically significant differences in sex composition, average age, and BMI among the Health, CRC, and DCRC groups. There was no significant difference in fasting glucose levels between the T2DM and DCRC groups and TNM staging between the CRC and DCRC groups.
In this study, we identified microbiome signatures in CRC patients without diabetes, as well as in CRC patients with T2DM, through metagenomic sequencing analyses of stool samples. Currently, dozens of bacteria have been confirmed to be associated with CRC. Although the results of studies based on different populations are different or even completely opposite, there are still CRC-related species independent of region and race, such as Fusobacterium nucleatum, Bacteroides fragilis, Peptostreptococcus, Porphyromonas, Enterococcus faecalis, and Clostridium septicum that are commonly found to be increased in abundance in CRC, and the tumorigenicity of these strains has been partially validated in vitro and in vivo.[30–32] Consistent with the findings of other studies investigating GM in CRC, our results showed that the dominant species (genera) of the DCRC group included Peptostreptococcus, Porphyromonas, and Parvimonas. Interestingly, in contrast with other studies, the abundance of Veillonella was increased in patients with DCRC. Previous studies have shown that Veillonella is associated with chemotherapeutic resistance in CRC and is more abundant in the proximal colon than in the distal colon.[33,34]
Our results suggest that CRC patients with T2DM have specific GM structures, including an increased abundance of Eggerthella, Hungatella, Peptostreptococcus, and Parvimonas, and a decreased abundance of Butyricicoccus, Lactobacillus, and Paraprevotella. Peptostreptococcus, and Parvimonas have been widely studied in recent decades.[35] Tsoi et al[36] found that Peptostreptococcus anaerobius mainly colonized the colon, and that it could be selectively enriched in the feces and mucosal microbiota of CRC patients; further, they confirmed that P. anaerobius could significantly increase the proliferation of colon cells. Alexander et al[37] reported that Actinobacterium Eggerthella lenta is enriched in IBD patients and suggested that E. lenta induces intestinal Th17 activation by inhibiting the Th17 transcription factor Rorγt through cell- and antigen-independent mechanisms. Xia et al[38] found that transplantation of Hungatella hathewayi promoted abnormal proliferation of colonic epithelial cells in germ-free and conventional mice, which may be related to hypermethylation of the CDX2 and MLH1 promoters. While Butyricicoccus is a probiotic, Chang et al[39] observed that Butyricicoccus pullicaecorum supplementation can inhibit CRC formation by regulating SCFAs and their receptor levels. The role of Lactobacillus rhamnosus GG, the most studied probiotic model for cancer, has also been reported.[40] Besides, Lactobacillus plantarum could reduce low-grade inflammation and glucose levels in a mouse model of chronic stress and diabetes.[41] Zhang et al[42] suggested that the relative abundance of Paraprevotella in the T2DM and PreDM groups was lower than that in the control group.
We then analyzed the functional differences between the groups based on functional abundance tables at different levels. The results showed that the pathways with significantly different functions in the DCRC group were D-glutamine and D-glutamate metabolism. Glutamate metabolism plays a vital role in the biosynthesis of nucleic acids and proteins. It is the most abundant and versatile amino acid in the body and of fundamental importance to intermediary metabolism, interorgan nitrogen exchange via ammonia (NH3) transport between tissues, and pH homeostasis.[43,44] Different from most normal cells, the proliferation of cancer cells usually requires glutamine. Hao et al[45] revealed that PI3KCA mutations make CRC cells more glutamine-dependent by upregulating glutamate pyruvate transaminase 2 and reprograming glutamine metabolism. Compared with wild-type cells, CRC cells with PIK3CA mutation converted more glutamine to α-ketoglutarate to supplement the TCA cycle and produce ATP.
GM participates in immune metabolism, primarily through the influence of metabolites.[46] Intestinal epithelial cells, which are exposed to several intestinal microorganisms, produce mucus and antimicrobial peptides and are among the earliest cells involved in the immune response.[47] SCFAs and BAs are microbial metabolites produced during intestinal anaerobic fermentation and are the core components of microbes in the host signaling pathway.[19] These metabolites are mainly from Akkermansia, Prevotella, Ruminococcus, Coprococcus, Faecalibacterium, Eubacterium, Roseburia, Clostridium, Bacteroides, Lactobacillus, Streptococcus, Propionibacterium, and Fusobacterium.[48–50] Our results showed that the butyric, isobutyric and isovaleric acid levels were lower in the DCRC group than in the Health group. The correlation analysis of differential stool bacteria and SCFAs between the DCRC and Health groups showed that the abundance of the most dominant bacteria (Parvimonas, Desulfurispora, Sebaldella, and Veillonellales, among others) in the DCRC group was negatively correlated with the butyric acid level. However, the abundance of mostly inferior bacteria was positively correlated with butyric acid levels, including Faecalibacterium, Thermococci, Methanoregula, Syntrophaceticus, and Sedimentisphaera. Butyric acid is one of the most widely studied SCFAs. As an effective histone deacetylase inhibitor, butyrate can induce apoptosis in CRC cells by activating the Fas receptor-mediated external death pathway.[51] It also promoted the transformation of naive CD4+ T cells into immunosuppressive Treg cells and upregulated the levels of anti-inflammatory cytokine IL-10 and pro-inflammatory cytokine IL-17.[52] Butyrate also stimulates the expression of epithelial barrier molecules and mucin production by activating the AMPK and TLR4 pathways, promoting apoptosis and blocking the cell cycle through other pathways.[53]
Comparing stool BAs between groups, our result showed that the DCA and 12-ketoLCA levels in the DCRC group were higher than those in the CRC and Health groups. Correlation analysis of differential bacteria and BAs between the DCRC and Health groups showed that the abundance of the most dominant bacteria in the DCRC group was negatively correlated with the levels of HDCA, UDCA, GCDCA, CDCA, CA, GCA, and betaCA. However, the levels of NorCA, DCA, 12-ketoLCA, and LCA were positively correlated. Increasing evidence shows that the interaction between host receptors and BAs affects gene expression and metabolism in epithelial and immune cells, thereby reducing inflammation and tumorigenesis.[54] There are many kinds of secondary BAs, which interact with diseases and have complex relationships.[55] Different secondary BAs have different or even opposite effects on CRC development. Previous studies have reported that DCA can promote the occurrence of intestinal adenoma and CRC by stimulating the expression of pro-inflammatory cytokines.[56] UDCA, another BA whose chemical structure is partially similar to DCA, acts as a chemoprevention agent of CRC by preventing COX-2 production and inhibiting DCA.[57] Romagnolo et al[58] confirmed the inhibitory role of the farnesoid X receptor (FXR) in CRC and found that FXR reduces inflammation and CRC progression by maintaining intestinal BA homeostasis. IL-8 is a regulator of tumor metastasis and growth. Lithocholic acid (LCA), a tumor promoter, upregulates IL-8 production and downregulates STAT3 phosphorylation by stimulating ERK1/2.[59]
Thus, unique fecal microbiome signatures exist in CRC patients with T2DM compared with those in non-diabetic CRC patients. These patients showed changes in their GM, with more CRC-related pathogens and fewer probiotics. Glutamate metabolism is more active and may provide energy for CRC development. The levels of some metabolites changed, and more DCA and LCA were produced, which can promote the occurrence of CRC. In contrast, butyrate, which has anti-inflammatory and anticancer effects, was decreased. Combined correlation analysis also confirmed the correlation between the different bacteria and metabolite levels. These results provide a preliminary explanation for the poor prognosis in patients with CRC and T2DM. Although this study provides some positive feedback, the precise molecular mechanisms of the gut microbiome in preventing and inhibiting cancer development are still in their infancy and must be elucidated further.
Availability of data and materialsThe dataset supporting the results of this study is included in the article. The datasets used and/or analyzed during the current study are available from the corresponding author upon reasonable request.
FundingThis work was supported by grants from the National Natural Science Foundation (No. 82073223) and Beijing Natural Science Foundation (No. 7224351).
Conflicts of interestNone.
References 1. Lu B, Li N, Luo CY, Cai J, Lu M, Zhang YH, et al. Colorectal cancer incidence and mortality: the current status, temporal trends and their attributable risk factors in 60 countries in 2000–2019. Chin Med J 2021; 134:1941–1951. doi: 10.1097/CM9.0000000000001619. 2. Xia C, Dong X, Li H, Cao M, Sun D, He S, Yang F, et al. Cancer statistics in China and United States, 2022: profiles, trends, and determinants. Chin Med J 2022; 135:584–590. doi: 10.1097/CM9.0000000000002108. 3. Saeedi P, Petersohn I, Salpea P, Malanda B, Karuranga S, Unwin N, et al. IDF Diabetes Atlas Committee. Global and regional diabetes prevalence estimates for 2019 and projections for 2030 and 2045: results from the International Diabetes Federation Diabetes Atlas. 9th edition. Diabetes Res Clin Pract 2019; 157:107843doi: 10.1016/j.diabres.2019.107843. 4. Dekker E, Tanis PJ, Vleugels JLA, Kasi PM, Wallace MB. Colorectal cancer. Lancet 2019; 394:1467–1480. doi: 10.1016/S0140-6736(19)32319-0. 5. Yuhara H, Steinmaus C, Cohen SE, Corley DA, Tei Y, Buffler PA. Is diabetes mellitus an independent risk factor for colon cancer and rectal cancer? Am J Gastroenterol 2011; 106:1911–1922. doi: 10.1038/ajg.2011.301. 6. Mills KT, Bellows CF, Hoffman AE, Kelly TN, Gagliardi G. Diabetes mellitus and colorectal cancer prognosis: a meta-analysis. Dis Colon Rectum 2013; 56:1304–1319. doi: 10.1097/DCR.0b013e3182a479f9. 7. Petrelli F, Ghidini M, Rausa E, Ghidini A, Cabiddu M, Borgonovo K, et al. Survival of colorectal cancer patients with diabetes mellitus: a meta-analysis. Can J Diabetes 2021; 45:186–197. doi: 10.1016/j.jcjd.2020.06.009. 8. Zhu B, Wu X, Wu B, Pei D, Zhang L, Wei L. The relationship between diabetes and colorectal cancer prognosis: a meta-analysis based on the cohort studies. PLoS One 2017; 12:e0176068doi: 10.1371/journal.pone.0176068. 9. Lin L, Zhang J. Role of intestinal microbiota and metabolites on gut homeostasis and human diseases. BMC Immunol 2017; 18:2doi: 10.1186/s12865-016-0187-3. 10. Thursby E, Juge N. Introduction to the human gut microbiota. Biochem J 2017; 474:1823–1836. doi: 10.1042/BCJ20160510. 11. Maccaferri S, Biagi E, Brigidi P. Metagenomics: key to human gut microbiota. Dig Dis 2011; 29:525–530. doi: 10.1159/000332966. 12. Scott AJ, Alexander JL, Merrifield CA, Cunningham D, Jobin C, Brown R, et al. International Cancer Microbiome Consortium consensus statement on the role of the human microbiome in carcinogenesis. Gut 2019; 68:1624–1632. doi: 10.1136/gutjnl-2019-318556. 13. Flemer B, Lynch DB, Brown JM, Jeffery IB, Ryan FJ, Claesson MJ, et al. Tumour-associated and non-tumour-associated microbiota in colorectal cancer. Gut 2017; 66:633–643. doi: 10.1136/gutjnl-2015-309595. 14. Coker OO, Nakatsu G, Dai RZ, Wu WKK, Wong SH, Ng SC, et al. Enteric fungal microbiota dysbiosis and ecological alterations in colorectal cancer. Gut 2019; 68:654–662. doi: 10.1136/gutjnl-2018-317178. 15. Nakatsu G, Zhou H, Wu WKK, Wong SH, Coker OO, Dai Z, et al. Alterations in enteric virome are associated with colorectal cancer and survival outcomes. Gastroenterology 2018; 155:529–554. doi: 10.1053/j.gastro.2018.04.018. 16. Yachida S, Mizutani S, Shiroma H, Shiba S, Nakajima T, Sakamoto T, et al. Metagenomic and metabolomic analyses reveal distinct stage-specific phenotypes of the gut microbiota in colorectal cancer. Nat Med 2019; 25:968–976. doi: 10.1038/s41591-019-0458-7. 17. Qin J, Li Y, Cai Z, Li S, Zhu J, Zhang F, et al. A metagenome-wide association study of gut microbiota in type 2 diabetes. Nature 2012; 490:55–60. doi: 10.1038/nature11450.
留言 (0)