Participants and study design
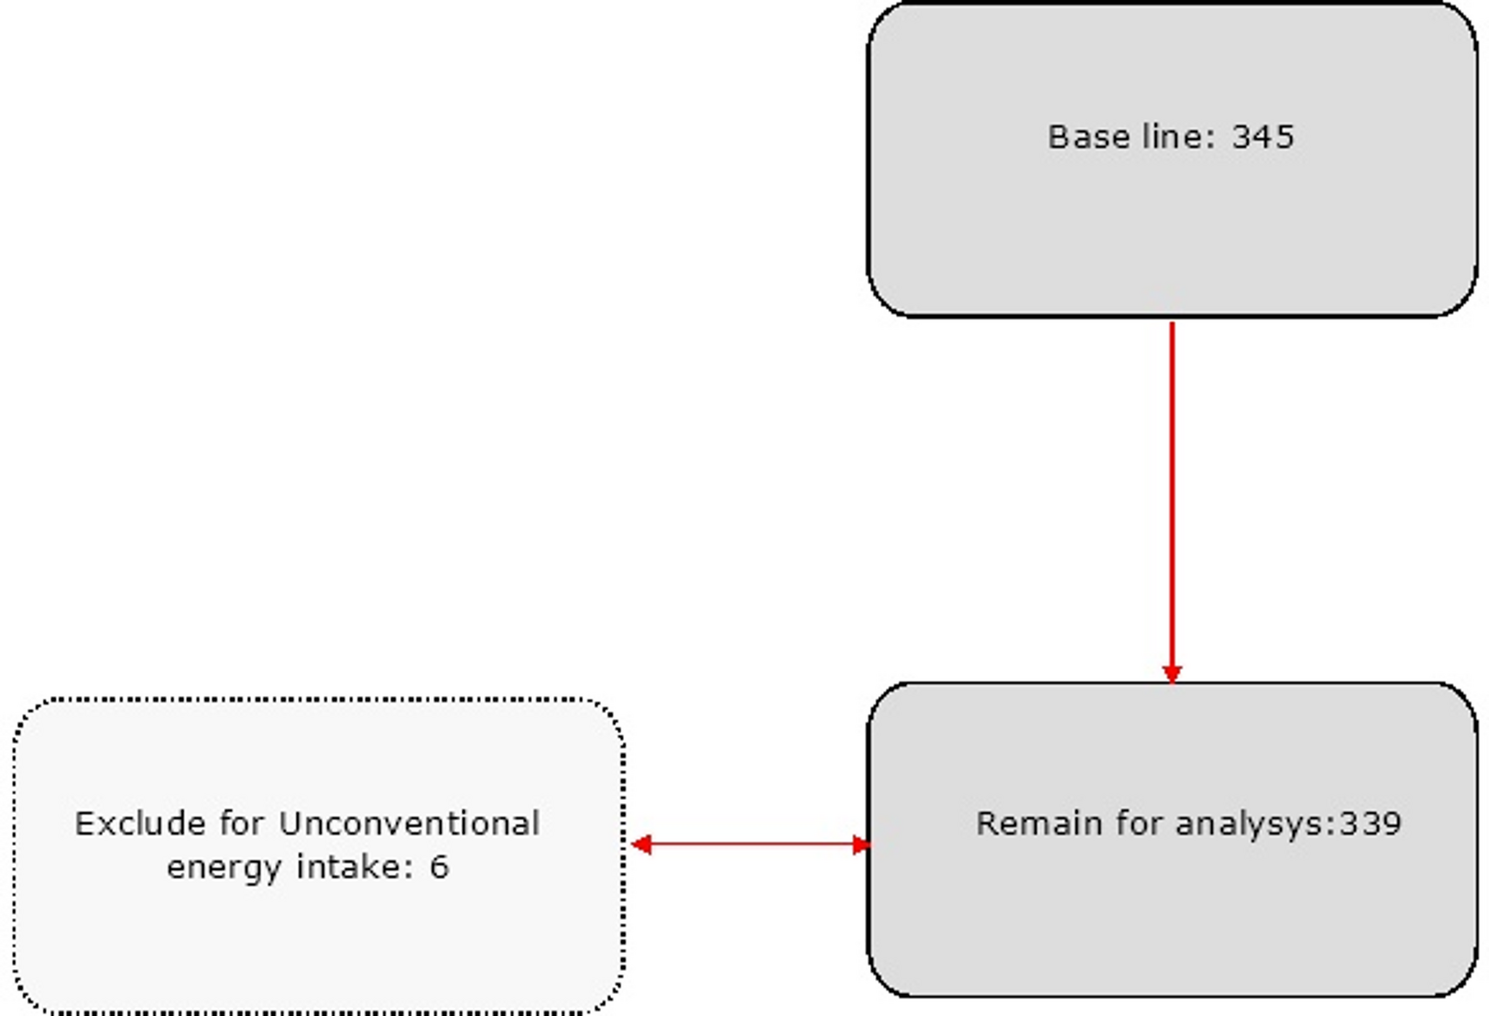
This cross-sectional study was conducted among patients with T2DM referred to the specialized diabetes clinic of Zanjan University of Medical Sciences, Iran. Patients were included in the study if they met the following criteria: (1) diagnosed with T2DM, (2) adults aged between 18 and 70 years, and either receiving oral anti-diabetic medication or not receiving any pharmacological treatment. The diagnosis of T2DM in this study adhered to the criteria set by the American Diabetes Association, which classifies a person as having T2DM if they meet either of the following conditions: a fasting plasma glucose level equal to or higher than 126 mg/dl or an oral glucose tolerance test result equal to or higher than 200 mg/dl [19]. The study excluded pregnant and lactating women, patients using insulin, individuals under special diets within the past year, those with abnormal calorie intake (less than 800 kcal or more than 4200 kcal), individuals with autoimmune diseases such as celiac disease or type 1 diabetes, those who experienced hyperglycemia-induced ketoacidosis within the last month, people with cancer, cognitive diseases like Alzheimer’s or Parkinson’s, individuals with grade 2 obesity (BMI ≥ 35), non-cooperative participants who did not complete the questionnaire, and patients who had used antioxidant and anti-inflammatory supplements in the past three months. The sample size was calculated according to the study by Abaj et al [20]. Based on this, we determined the required sample size by considering a type 1 error of 5% (α = 0.05), the standard deviation of the dietary insulin index equal to 5.38 in diabetic patients, and a 95% confidence interval. According to this calculation, we needed 445 individuals for the present cross-sectional study. However, the current analysis involved data from 500 participants.
Ethics approval
The study was conducted in accordance with the Declaration of Helsinki, and the research protocol received approval from the Ethics Committee of Zanjan University of Medical Sciences (Ethics Code: IR.ZUMS.REC.1402.009). Before collecting data, participants were provided with a detailed explanation of the study’s objectives and methods, and informed consent was obtained from all subjects.
Dietary intake assessment
We assessed participants’ dietary intakes using a reliable block-format 120-item food frequency questionnaire (FFQ) validated for adults in Iran [21, 22]. Specifically designed for Iranian adults, the questionnaire’s reliability and validity have been confirmed by previous studies investigating the links between diet and disease [17, 23, 24]. Each participant had the FFQ completed by an experienced interviewer. Participants provided dietary intake information, specifying whether it was for a day, week, month, or year, and indicated their intake based on the serving size of each food item. To enhance estimate precision, interviewers displayed household measures or serving sizes of each food item to participants. We determined the daily intake in grams for each food item by considering its consumption frequency and serving size. Additionally, we computed the daily nutrient intake for each participant by considering the nutrient content of all consumed foods, relying on the national nutrient databank of the US Department of Agriculture [25].
Dietary insulin index and load
The food insulin index represents the increase in insulin response measured over a 2-hour period when consuming a 1,000-kJ (239 kcal) portion of the test food, relative to the insulin response generated by a 1,000-kJ (239 kcal) portion of the reference food. The insulin index for 68 different food items was gathered from prior studies conducted by Bao et al. (50 items) [26], Bell et al. (13 items) [27], and Holt et al. (5 items) [28]. The insulin index of three food items, namely tea, coffee, and salt, was determined to be zero due to their extremely low levels of energy, carbohydrates, protein, and fat. The insulin index measures how much a particular food item increases insulin levels after consumption. In this case, these three items have a negligible impact on insulin secretion. To account for the 49 food items not included in the referenced studies’ food lists, the insulin index of comparable food items was estimated using their energy, fiber, carbohydrate, protein, and fat content correlation. This approach allowed for an approximation of the insulin index values for those foods based on their nutritional composition similarities. Take dates and raisins as an example, both being dried fruits with comparable energy, carbohydrate, fat, protein, and fiber content. Consequently, we chose to use the insulin index of raisins to estimate the index for dates, given the similarities in nutritional composition between the two fruits. To determine the DIL, the initial step involved calculating the insulin load of each food. This was done by multiplying the insulin index of the food by the energy content per 1 gram of the food and further multiplying it by the amount of that food consumed in grams per day. The DIL for each individual was determined by adding up the insulin load of all the consumed foods. Subsequently, the DII for each participant was computed by dividing their DIL by their total energy intake [29].
Biochemical assessment
For biochemical evaluation, 10 cc of fasting blood was collected from all patients. All experiments were conducted in the central laboratory of Zanjan University of Medical Sciences by a skilled technician. Serum concentrations of blood sugar, total cholesterol, and triglycerides were measured using enzymatic methods with standard kits (Pars Azmoon, Tehran, Iran). HDL-C concentrations were determined by measuring the precipitation of lipoproteins containing apo B using phosphotungstic acid. LDL concentration was calculated using Friedewald’s formula: LDL-c (mg/dL) = TC (mg/dL) − HDL-c (mg/dL) − TG (mg/dL)/5 [30].
To measure the SBP and DBP, patients were initially asked to sit and rest for 10 min. Each patient’s systolic and diastolic blood pressure was then measured twice by an expert, and the average of the two readings was recorded as the systolic or diastolic blood pressure. Blood pressure was measured using a mercury manometer (Micro life AG, 9443 Widnau / Switzerland).
Anthropometric and physical activity evaluation
A questionnaire, assessing physical activity using the Metabolic Equivalent of Task (MET) system, was employed to gauge participants’ engagement in physical activities [31]. Participants’ height and weight were measured using Seca equipment from Germany, with a precision of 0.1 kg for weight and 0.5 cm for height. Measurements were taken while participants were dressed in lightweight clothing, without shoes. Waist circumference was determined with a flexible tape at the midpoint between the lowest rib and iliac crest, with an accuracy of 0.1 cm. Body mass index (BMI) was calculated by dividing weight in kilograms by the square of the height in meters.
Statistical analysis
The patients were categorized into groups based on the quartile thresholds of their DIL and DII scores. To examine variations in quantitative variables across the quartiles of DIL and DII, one-way analysis of variance was used. Additionally, for categorical data, a Chi-Square test was utilized. Binary logistic regression with adjusted models was employed to calculate the odds ratio (OR) and 95% confidence interval (CI) for MetS, considering the quartiles of DIL and DII scores. MetS was determined according to the criteria outlined in the modified Iranian National Cholesterol Education Program for Adults [32, 33], where the presence of MetS was indicated by having at least three of the following components: (1) abdominal obesity (waist circumference ≥ 95 cm for both sexes), (2) low HDL-C levels (< 50 mg/dL [1.293 mmol/L] for women and < 40 mg/dL [1.034 mmol/L] for men), (3) high TG levels (> 150 mg/dL [1.694 mmol/L]), (4) abnormal glucose regulation (FBG ≥ 100 mg/dL [5.550 mmol/L]), and (5) elevated blood pressure (systolic blood pressure > 130 mm Hg and diastolic blood pressure ≥ 85 mm Hg).
Different models of binary logistic regression were used: Model 1, adjusted for age, sex, and energy intake, and Model 2, adjusted for sex, energy intake, BMI, physical activity, and duration of diabetes. In all models, participants in the first quartiles of DIL and DII were considered as the reference group. The categories of DIL and DII were treated as ordinal variables in the binary logistic regression to capture the trend in odds ratios across different quartiles. Statistical analyses were performed using SPSS version 18 (SPSS Inc, Chicago, IL). A significance level of P < 0.05 was used to determine statistical significance.


Comments (0)