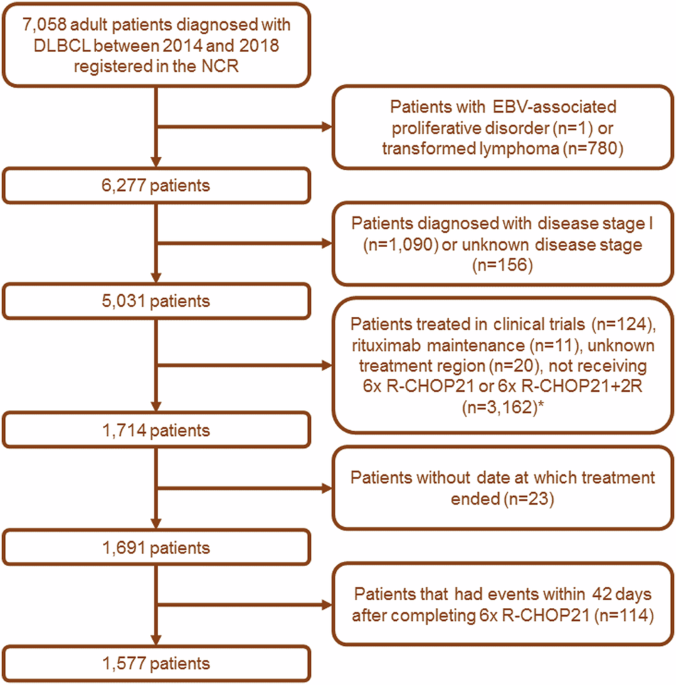
Participants and samples
Participants were enrolled from the Iceland Screens, Treats, or Prevents MM study (iStopMM). The study is a population-based screening study for MM and its precursor diseases, followed by a randomized trial of different follow-up strategies. Briefly, a total of 80 579 Icelanders born before 1975 and who were alive in late 2016 (54.4% of the target population) gave their informed consent. Of them, 75 422 participants were screened for MM and other monoclonal gammopathies (MG) by serum protein electrophoresis (SPEP) and free light chain (FLC) assay. Those who tested positive were randomized to one of three study arms and two thirds called in to a clinical study center for further assessment and follow-up. The design and recruitment of the iStopMM study has been described in detail elsewhere [21]. All diagnosed cases of SMM and MM and a conveniency sample of participants with MGUS were eligible for a flow cytometry sub-study. As of May 2022, a total of 351 EDTA-anti-coagulated BM aspirated samples from 219 individuals had been collected as first pull (n = 204), second pull (n = 117), or paired first and second pull (n = 30 samples in total from 15 individuals) aspirated samples at a target volume of 2–4 mL (Table 1). BM sampling was performed by study nurses that had received specific BM sampling training, both locally and in an accredited facility in the United Kingdom (The Royal Marsden Hospital, London, UK). BM aspirated samples were passed through a 70 µm cell strainer and white blood cell (WBC) count measured using an ABX Micros ES 60 hematological analyzer (Horiba, Kyoto, Japan) before subsequent immunophenotypic analyses. To introduce controlled hemodilution for evaluating the performance of the BMQI, a fraction of the first pull BM samples (n = 12) was diluted with paired blood based on WBC count to obtain samples containing 70% and 30% cellularity of the original BM sample.
Table 1 Characteristics of BM aspirated samples.Immunophenotypic studies
The EuroFlow NGF MM-MRD panel was used for sample staining using antibody kits (Cytognos S.L., Salamanca, Spain) and the drop-in antibodies of CD138-BV421 (BD Biosciences, San Jose, CA, USA) and CD27-BV510 (BioLegend Inc., CA, USA), as described elsewhere [18]. Sample preparation and staining as well as instrument setup and calibration were performed according to the manufacturer’s specifications and the standardized EuroFlow protocols available at www.euroflow.org [22]. Samples were stained within 24 h of collection and measured in a single FACSCanto II flow cytometer (BD Biosciences). Flow cytometry data was analyzed using the Infinicyt software (Cytognos S.L.) based on the automated gating and identification (AG&I) tool and the EuroFlow MM-MRD reference database as recommended by EuroFlow. Results from automatic gating and classification were then manually reviewed. Events from tube 1 of the EuroFlow MM-MRD panel were then used to assess percentage values of myeloid precursors (CD117+, CD38+, CD45lo, and SSCint/hi), nucleated red cells (CD45–, CD38–, CD117–, and SSClo), mast cells (CD117hi and CD45lo), B cell precursors (CD19+, CD45lo, CD38hi, CD81hi, and CD27–), and plasma cells (CD38hi and CD138+) (Supplementary Fig. 1). Because the bulk of tumor plasma cells varies widely in individuals with MM, SMM, and MGUS, non-plasma cell populations were assessed as percentages of total nucleated cells after excluding tumor plasma cells, whereas total plasma cells were assessed as percentages of total nucleated cells. The lower limit of quantification (LLOQ) was set at ≥50 cells per cell population and the LOQ was calculated from tube 1 by the following formula: 50/total number of nucleated cells.
Study design
To investigate the potential relationship between the distribution of BM-associated cell populations and hemodilution, differences in the overall composition of first vs second BM aspirated sample pulls (reference for optimal and suboptimal samples, respectively) were used. As candidate markers for hemodilution we used those cell populations that are largely restricted to the BM and that are readily identified by the combination of markers used in assessing MRD in MM by NGF, including B cell precursors, myeloid precursors, nucleated red cells, and mast cells. In addition, the BM WBC count was also evaluated as an external reference of sample quality, independent of the NGF assay. The percentage of total plasma cells was used as indication of difference in the degree of hemodilution between groups and was evaluated for MGUS, SMM, and MM sample groups separately.
Statistical methods
The Mann-Whitney U test or Wilcoxon signed-rank test were used to assess the statistical significance of differences between unpaired and paired first pull vs second pull BM samples, respectively. For the comparison of plasma cell numbers in our cohort, paired first vs second pull BM aspirated samples collected during the same BM aspiration procedure were used in order to limit donor variability due to the underlying disease/tumor load. In turn, for comparison of B cell precursor, myeloid precursor, nucleated red cell, and mast cell percentages as well as BM WBC count in first vs second pull samples, all BM samples (paired and unpaired) were used.
Receiver operating characteristic (ROC) curve analysis was used to assess the discriminatory power for the different BM-associated cell population percentages evaluated and the BM WBC count between first pull vs second pull samples. Area under the curve (AUC) was used to compare individual predictor variables as hemodilution markers and the DeLong’s test was used to assess statistical differences between ROC curves.
Donor variability is a limiting factor for predicting hemodilution based on cellular distribution. Therefore, we compared the differences in relative variability for predictor variables within the two groups of BM samples (first pull and second pull samples) using the respective coefficient of variation (CV), calculated by dividing the standard deviation (SD) by the mean value and multiply by 100.
For all statistical analysis and graphical presentation of data, the R statistical software (version 4.1.1; including packages pROC, MASS, and ggplot2) was used.
Development and validation of the bone marrow quality index (BMQI)
We aimed to develop a multivariate model to predict the degree of hemodilution in BM aspirated samples. From our analysis of individual cell populations, myeloid precursors and nucleated red cells were chosen for the model due to their strong predictive performance for BM sample pull and comparatively lower relative variability. We employed linear discriminant analysis (LDA) to determine the linear combination of these populations for maximizing the between-group variance of first and second pull BM aspirated samples. Based on the coefficients derived from LDA analysis, the resulting BMQI incorporates the weighted contribution of each population, with higher BMQI values indicating less hemodilution. ROC analysis was used to assess the discriminatory ability of the BMQI, both in comparison to individual cell populations and separately within MGUS, SMM, and MM samples. The Kruskal-Wallis test was used to evaluate statistical significance of differences in BMQI between MGUS, SMM, and MM samples when stratified by pull. Pearson’s correlation analysis was utilized to examine the association between age and the BMQI.
The likelihood ratio (LR) for first vs second samples were used to derive corresponding BMQI values for classifying samples according to the observed probability of belonging to a class of first pull samples in a BMQI scoring system as followed: LR < 0.1: large decrease, LR 0.1–0.2: small to moderate decrease; LR 0.2-1: minimal decrease, LR 1–10: minimal to moderate increase, and LR > 10 large increase. The Kruskal-Wallis rank sum test and the Dunn multiple comparison test was then used to assess the statistical significance of differences observed in the percentage of BM plasma cells in samples grouped by ranges in BMQI, separately for MGUS and SMM groups. The Mann-Whitney U test was used to assess statistical significance of differences observed in the percentage of BM plasma cells in samples grouped according the derived BMQI value corresponding to a LR of 1, separately for MGUS, SMM, and MM groups.
The performance of the BMQI was assessed through three distinct sets of validation experiments using prospectively collected samples. Firstly, using a prospective series of paired first and second pull BM samples, collected during the same aspiration procedure. Secondly, in samples containing different proportions of BM sample-derived cells (100%, 70%, and 30%). These were experimentally diluted with peripheral blood (PB) based on cellularity (i.e., diluted samples contained pre-defined number of nucleated cells derived from the BM and blood samples). Lastly, in virtually diluted BM samples, simulated based on a pre-determined number of nucleated cells from flow cytometry data files of paired BM and PB samples (Supplementary methods). The pairwise Mann-Whitney U test and the Friedman test followed by the Nemenyi post hoc test were used to assess the statistical significance of differences observed between two and three groups in the validation series, respectively. Linear regression analysis was used to assess the relationship between the relative change in BMQI (independent variable) and the relative change in the percentage of total plasma cells (dependent variable) with dilution.


Comments (0)