2.1 Study Population
The present analyses are part of the extensive COCKTAIL study (NCT02386917), an open, non-randomized, three-armed, controlled study performed at Vestfold Hospital Trust in Norway, investigating the effect of an RYGB and non-surgical calorie restriction on the pharmacokinetics of a cocktail of probe drugs (caffeine [CYP1A2], losartan [CYP2C9], omeprazole [CYP2C19], midazolam [CYP3A], rosuvastatin [organic anion transporting polypeptide 1B1], and digoxin [P-gp]) [21]. Data on CYP1A2, CYP2C9, CYP2C19, CYP3A, and organic anion transporting polypeptide 1B1 activities have been published previously [6, 7, 12]. Patients with severe obesity scheduled for weight loss treatment with an RYGB or non-surgical calorie restriction based on clinical indications were included and followed for 2 years. A cross-sectional group of mainly normal weight individuals scheduled for a cholecystectomy was also included. As described in detail previously, patients aged 18 years and older with a body mass index ≥18.5 kg/m2 and a stable body weight over the last 3 months were eligible for inclusion [21]. Key exclusion criteria included previous bariatric or upper gastrointestinal surgery, estimated glomerular filtration rate (eGFR) ≤30 mL/min/1.73 m2, or treatment with substances that may influence the pharmacokinetics of the probe drugs in close approximation to the investigations.
2.2 Study Procedures
The present analyses included pharmacokinetic data from all three groups at baseline (week 0), and from the weight loss groups at the follow-up visits at week 3, week 9, and year 2. Proteomics data from liver and jejunal biopsies (only RYGB) obtained at the time of surgery in the patients undergoing an RYGB (week 3) or cholecystectomy (week 0) were also included in the analyses [22]. The two weight loss groups started a 3-week low-energy diet (LED; <1200 kcal/day) immediately after the pharmacokinetic investigation at baseline. The RYGB was performed at week 3, after the pre-operative LED. Between weeks 3 and 9, both groups followed a 6-week strict caloric regimen consisting of <800 kcal/day induced by an RYGB or a very-low-energy diet (VLED). The patients followed local treatment guidelines between the follow-up visits at week 9 and year 2.
The pharmacokinetic investigational days have been described in detail previously [21]. In short, patients abstained from food and drugs from 10:00 p.m. the evening before the investigations. On the study day, patients first met for baseline blood sampling (07:30 a.m.) followed by administration of the cocktail of probe drugs. Oral digoxin (0.5 mg) was administered at 09:00 a.m. Blood samples for the analysis of digoxin were collected from a peripheral venous catheter at 0.25, 0.5, 1, 1.5, 2, 3, 4, 4.25, 4.5, 5, 5.5, 6, 8, 10, 12, 23, and 24 hours. Blood samples were drawn in K2-EDTA vacutainer tubes and centrifuged for 10 minutes at 4 °C (1800 g). Plasma was then separated into Cryovials and frozen within 1 hour at −70 °C until analysis.
2.3 Bioanalytical Assay and Clinical Chemistry Analyses
Plasma concentrations of digoxin were determined by Covance Laboratories (Madison, WI, USA) using validated liquid chromatography followed by tandem mass spectrometry methods. The standard curve ranged from 0.05 to 10.0 ng/mL. The inter-run precisions, assessed as coefficients of variation, were 5.8%, 3.6%, and 10.1% at 0.150 ng/mL, 3.00 ng/mL, and 7.50 ng/mL, respectively (n = 120). The inter-run accuracies ranged between 99.3 and 97.6%.
Standard clinical chemistry analyses were performed in fresh blood samples at the Department of Laboratory Medicine, Vestfold Hospital Trust, Tønsberg, Norway. Plasma levels of high-sensitivity C-reactive protein were measured using immunoturbidimetry (Advia Chemistry XPT Systems; Siemens, Erlangen, Germany) at Fürst Medical Laboratory, Oslo, Norway. Body weight (kg) and body composition were measured with the Inbody 720 Body Composition Analyzer (Biospace, Seoul, South Korea).
2.4 Quantification of ABCB1 (P-gp) in Hepatic and Jejunal Biopsies
Proteins were extracted from liver and jejunal biopsies in a SDS-containing (2% w/v) lysis buffer and quantified as previously described [22]. In short, samples were digested using multi-enzyme digestion in a filter-aided sample preparation protocol with LysC and trypsin. A proteomics analysis was performed with Q Exactive HF or Q Exactive HF-X. MS data were processed with MaxQuant using the human UniProtKB, and spectral raw intensities were normalized with variance stabilization. The protein levels were calculated using the total protein approach [23].
2.5 Population Pharmacokinetic Modeling
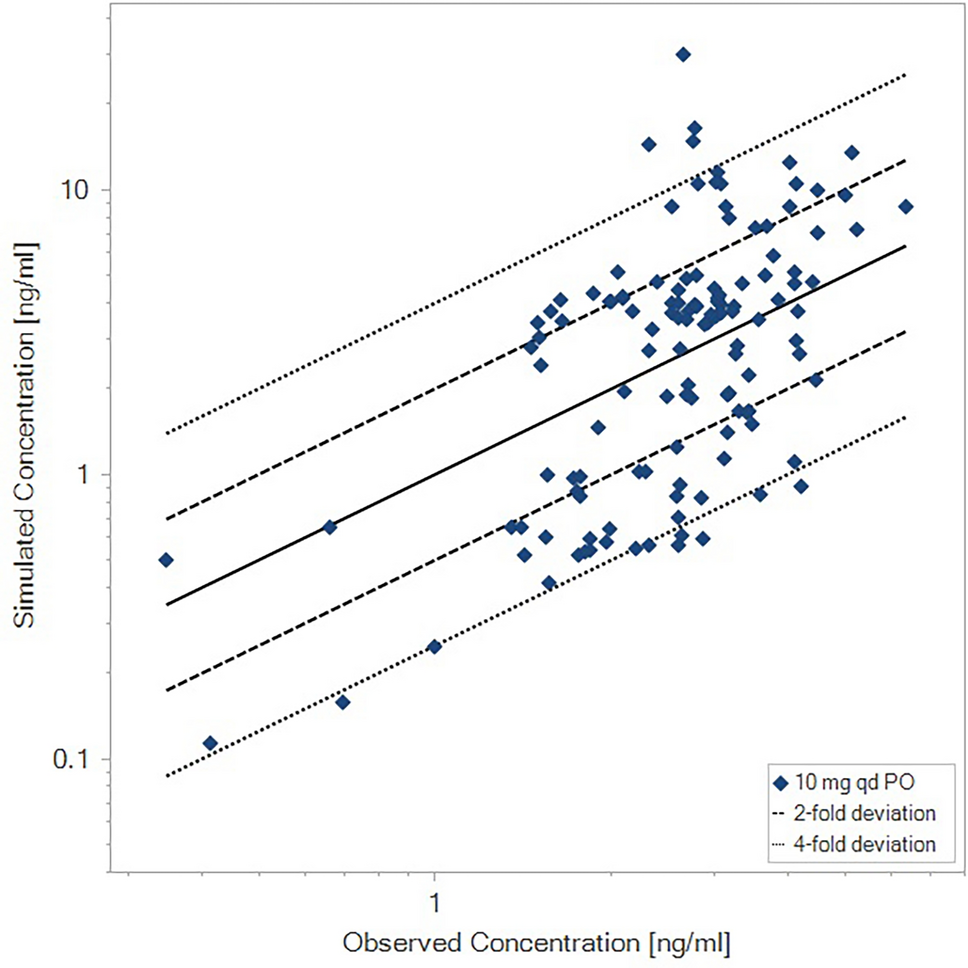
A population pharmacokinetic model was developed to estimate individual digoxin pharmacokinetics at the different study visits. In short, a non-parametric adaptive grid approach implemented in Pmetrics 1.9.4 for R 4.2.3 was used [24, 25]. A total of 3410 digoxin concentrations across 308 pharmacokinetic profiles from 98 patients were included, of which 197 and 111 were 8-point and 18-point profiles, respectively. The rich data from all patients allowed the model to make accurate individual predictions without the need for covariates, making it fit for purpose in combination with the linear mixed models (see below). The model was internally validated on 25% of the dataset, which comprised solely 8-point pharmacokinetic profiles. A full description of the model development and metrics is available in the Electronic Supplementary Material (ESM).
2.6 Pharmacokinetic Calculations
Posterior individual parameter values, as well as posterior individually predicted concentrations obtained from the final population pharmacokinetic model run with the complete dataset, were used for all pharmacokinetic calculations. Predictions were made in 1-min intervals, including each sample point. Area under the concentration–time curve from zero to infinity (AUC0–∞) was calculated with the trapezoidal approximation from individual posterior-predicted concentrations implemented in the ‘makeAUC’ function in the Pmetrics [24] package for R [25]. Maximum plasma concentration (Cmax) and time to reach Cmax (Tmax) were obtained directly from the individual predictions.
2.7 Data and Statistical Analyses
Linear mixed models were used in the longitudinal analysis to estimate within-group changes and between-group differences (RYGB vs diet). The pharmacokinetic parameter was treated as a dependent variable, whereas time (visit), group (RYGB and diet), and their interaction (time × group) were treated as fixed effects. The unique patient identifier was used as a random effect (individual intercepts). Contrast analyses were performed for parameters of interest. In the cross-sectional analyses, the Welch two-sample t-test was used to compare patients with obesity (RYGB plus diet) and the mainly normal weight individuals (cholecystectomy). To describe the relationship between variables of interest, linear regression analyses were performed. Estimated glomerular filtration rate was calculated using the CKD-EPI formula [26]. The NAFLD liver fat score was calculated as suggested by Kotronen et al. and values greater than −0.640 were indicative of NAFLD [27]. Data are presented as mean ± standard deviation or mean [95% confidence interval (CI)] unless otherwise stated. Confidence intervals from linear mixed models were adjusted with Tukey’s method. With the preetermined α = 0.05, 95% CIs not including zero and p-values <0.05 were considered statistically significant. All statistical analyses were performed using R 4.2.3 [25].


留言 (0)