Ethics statement
This study complied with the 1975 Declaration of Helsinki (revised in 2008) and the Japanese Ethical Guidelines for Medical and Health Research Involving Human Subjects. All procedures involving human participants were approved by the Ethics Committee of the University of Occupational and Environmental Health, Japan (approval number: UOEHCRB21-057). Written informed consent was obtained from all the participants. To protect patient privacy, anonymous identification numbers were assigned to each patient.
Participants
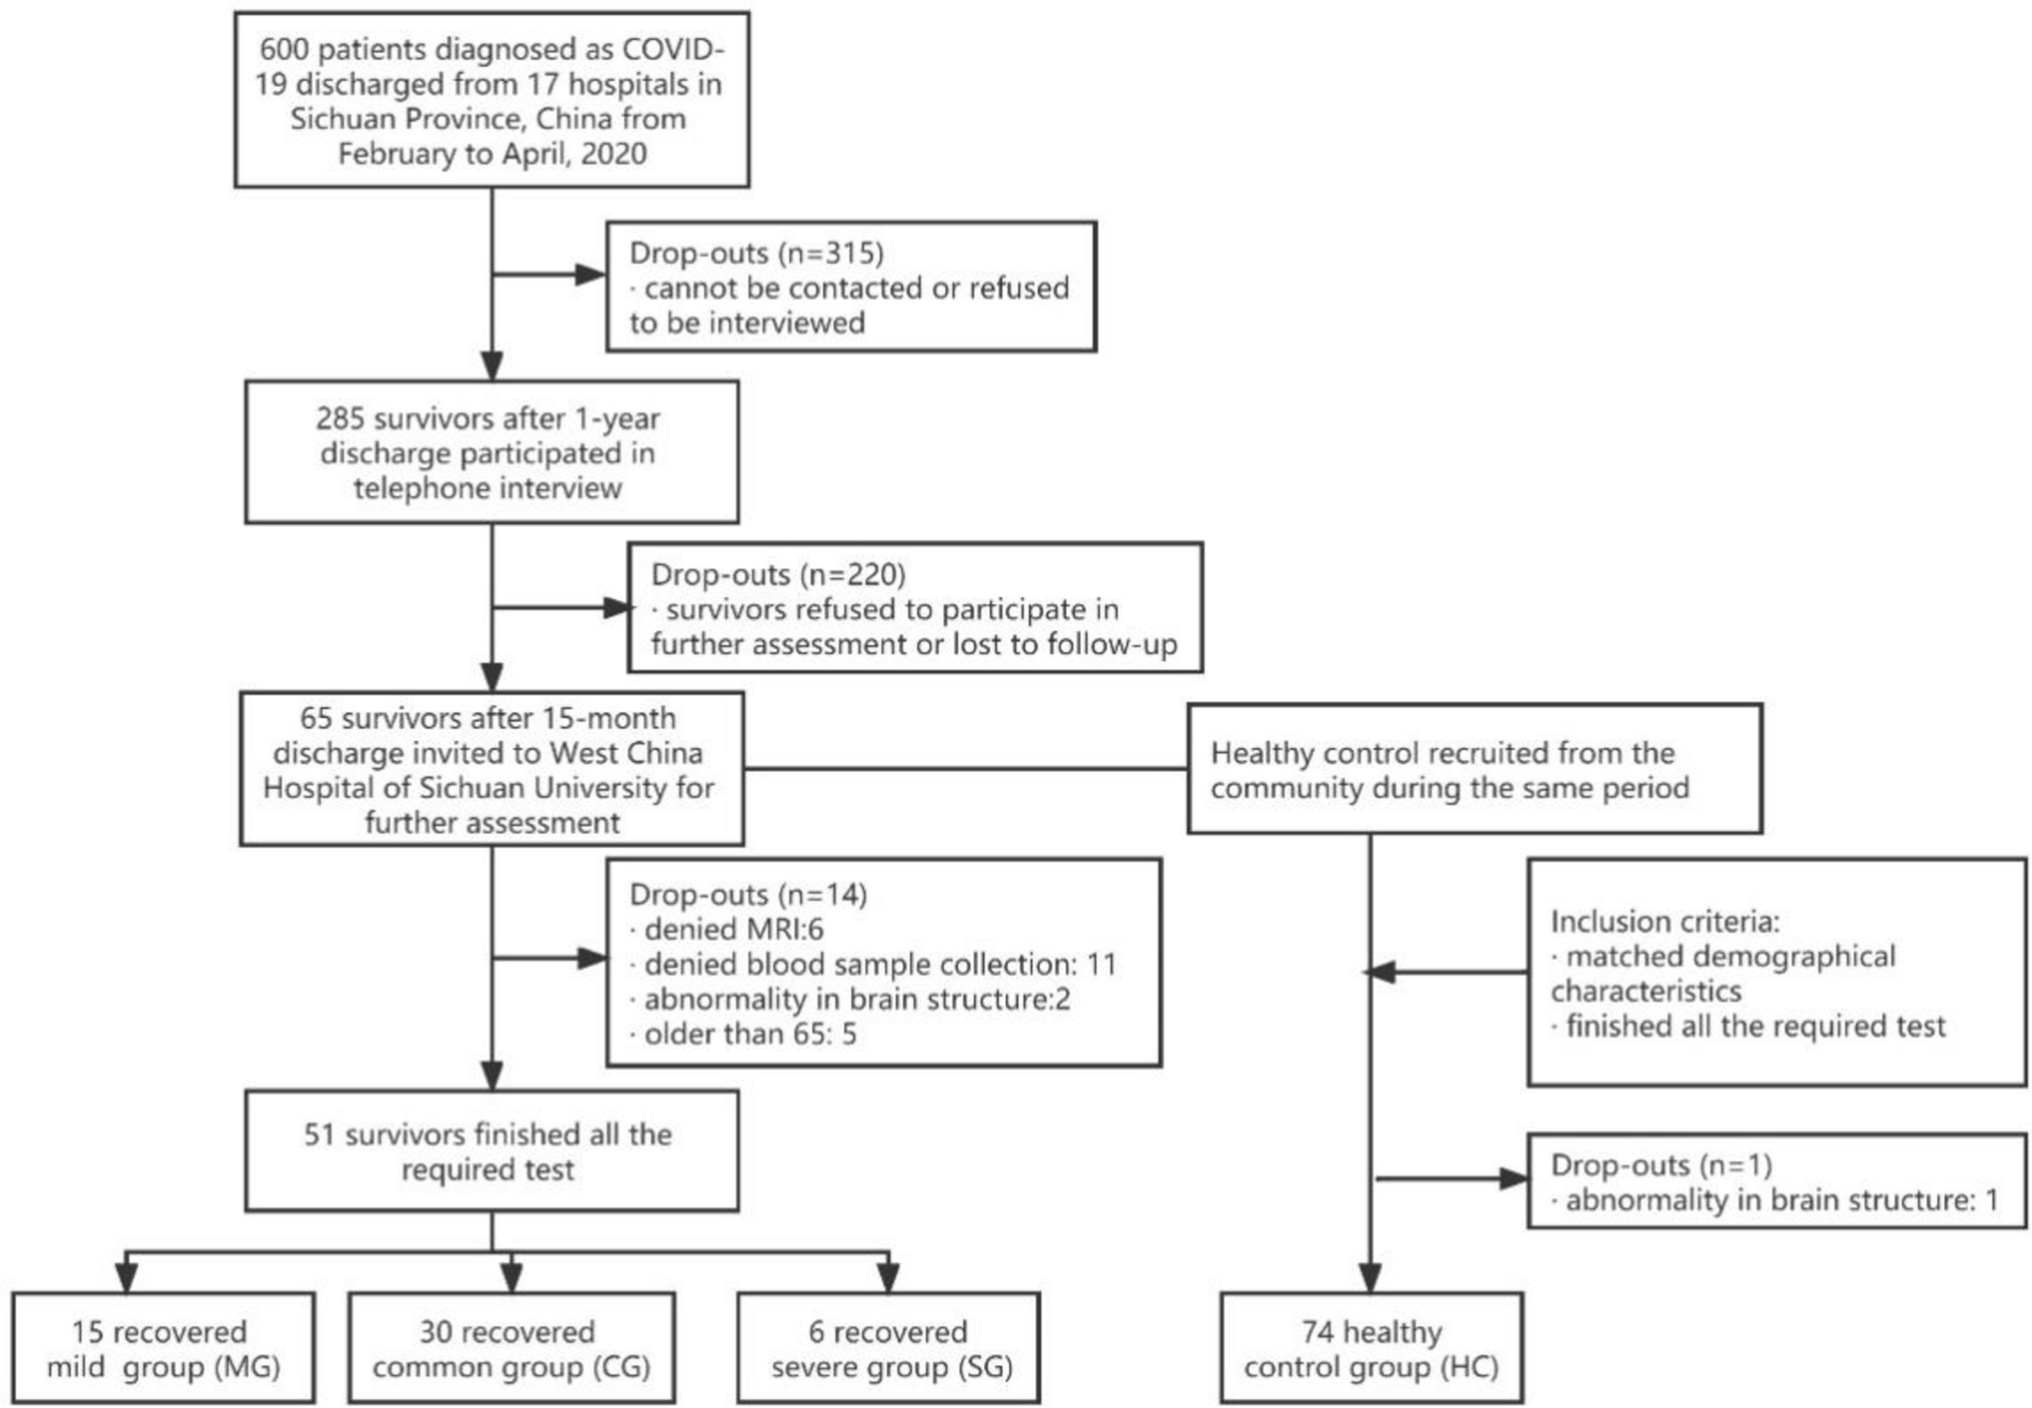
We recruited 40 patients with MDD diagnosed according to the Diagnostic and Statistical Manual of Mental Disorders, Fifth Edition from the Hospital of the University of Occupational and Environmental Health in Japan [27]. No patient had psychiatric comorbidities other than MDD. The exclusion criteria included a history of major neurological disease, epilepsy, cerebrovascular accident, head trauma with cognitive sequelae, and intellectual disability. T2DM was diagnosed according to the relevant Japan Diabetes Society criteria (i.e., fasting blood glucose levels ≥ 126 mg/dL and hemoglobin A1c (HbA1c) levels ≥ 6.5%); alternatively, if a patient was currently taking diabetes medication, then they were diagnosed accordingly. Psychiatrists and internists diagnosed MDD and T2DM respectively.
Clinical assessment and blood sampling
We assessed the clinical symptoms of patients with MDD using the Hamilton Depression Rating Scale (HAMD) [28]. Non-fasting blood samples were collected, and serum samples were randomly collected. Blood samples were collected in plain blood tubes at the University of Occupational and Environmental Health Japan, separated by centrifugation at 2000 × g for 20 min, and stored at –80 °C in silicone-coated tubes until analysis.
Measurement of inflammatory cytokines
TNF-α and IL-6levels were determined by SRL Inc. (Kitakyushu, Japan) using a sandwich enzyme immunoassay. The microplate was coated with a human monoclonal antibody as a capture antibody. Standards and samples were subsequently added to the wells, allowing the immobilized antibody to bind to any TNF-α and IL-6 present in the samples. After thorough washing to remove any unbound substances, a biotinylated polyclonal antibody specific to humans was introduced to the wells. After another round of washing to remove any unbound antibody-biotin reagent, an enzyme-linked streptavidin was added. Subsequently, any unbound streptavidin-enzyme reagent was washed away, and a substrate solution was added to initiate a color reaction that was directly proportional to the amount of TNF-α and IL-6 initially bound. The color development process was terminated, and the intensity of the resulting color was measured.
Measurement of kynurenine and serotonin pathway metabolites
We performed metabolomics analysis to measure tryptophan metabolites. To perform the analysis, serum samples were sent to Human Metabolome Technologies, Inc. (HMT, Tsuruoka, Japan). Metabolites were measured using capillary electrophoresis (CE) coupled with Fourier transform mass spectrometry (CE-FTMS), following the procedure outlined in HMT’s ω Scan package. The CE-FTMS analysis was performed using specific equipment and software. An Agilent 7,100 CE system equipped with a Q Exactive Plus mass spectrometer (Thermo Fisher Scientific, Inc., Waltham, MA, USA) was used. The system also included an Agilent 1,260 isocratic HPLC pump, Agilent G1603A CE-MS adapter kit, and Agilent G1607A CE–ESI–MS sprayer kit (Agilent Technologies Inc., Santa Clara, CA, USA). The operation and control of these components were performed using the Agilent Mass Hunter workstation software version B.08.00 for the 6,200 series TOF/6,500 series Q-TOF (Agilent Technologies Inc., Santa Clara, CA, USA) and Xcalibur software (Thermo Fisher Scientific, Inc). A fused silica capillary with an internal diameter of 50 μm and a total length of 80 cm was used for the connections.
Commercial electrolytes from HMT were used as electrophoresis buffers, specifically H3301-1001 for cation analysis and I3302-1023 for anion analysis. The spectrometer scanned a mass range of 50–1,000. Peaks were analyzed using the Master Hands automatic integration software (Keio University, Tsuruoka, Yamagata, Japan) to obtain m/z, peak area, and migration time (MT) data. Signal peaks corresponding to isotopomers, adduct ions, and other product ions of known metabolites were excluded, and the remaining peaks were annotated according to the HMT metabolome database based on their m/z values and MTs. The areas of the annotated peaks were subsequently normalized to those of the internal standards and sample volumes to obtain the relative levels of each metabolite of the kynurenine pathway. Among these metabolites, we extracted the relative levels of tryptophan, N-formylkynurenine, kynurenine, kynurenic acid, 3-hydroxykynurenine, 3-hydroxyanthranilic acid, quinolinic acid, picolinic acid, xanthurenic acid, pretonine, serotonin, and N-methylserotonin.
Data analysis
All statistical analyses were performed using Stata 17 (Stata Corp., College Station, TX, USA). Figures were created using Python 3.0 (Python Software Foundation, Wilmington, DE, USA). The normality of the data was assessed using histograms. In descriptive statistics, demographic data were expressed as the mean (standard deviation) or median [interquartile range] based on normality. The Mann–Whitney U test and multiple regression analysis were used to test for differences between the two groups. Spearman’s rank-sum test and multiple regression analysis were performed for each group to test for correlation. An interaction analysis was also performed by multiple regression analysis to assess for correlations that were statistically significant for one of the groups in the multiple regression analysis.
Interaction analysis between the effects of inflammatory cytokines on the kynurenine and serotonin pathways were measured by comparing the differences in the slopes of each regression line. The multiple regression analysis was adjusted for potential covariates including age, sex, and body mass index (BMI). The choice of covariates was based on sample size considerations and the three basic demographic datasets, which were preselected prior to performing the analysis. Missing data were excluded from the analysis. To avoid the influence of outliers, all data are expressed as medians [interquartile ranges] in the inferential statistics section, and nonparametric tests were selected. Multiple regression analysis and figure creation were performed after removing outliers using scatterplots, which were approximately two times the interquartile range. The validity of the model of multiple regression analysis was assessed by the normality of the residual histograms. P-values were calculated using two-tailed tests, and p < 0.05 was considered statistically significant.


留言 (0)