
Remember me


The convenience sampling method was used to recruit patients with T2DM from the endocrinology departments of three tertiary hospitals in China from March to September 2022 for this cross-sectional descriptive study. The inclusion criteria were as follows: T2DM patients who (1) met the 1999 WHO diagnostic criteria for diabetes; (2) had a course of disease ≥6 months; (3) had an age ≥18 years old; (4) had good verbal communication and understanding skills; (5) had normal vision or corrected vision, no color blindness or color asthenia; (6) had normal finger function and ability to do key reactions; (7) had a MoCA score ≥25; and (8) had given informed consent and were willing to participate in the study. Patients who (1) had a history of cerebrovascular disease or other central nervous system injury and (2) had difficulty completing the questionnaire or the computer-based cognitive measurement tasks were excluded. As effect size was 0.3, test level α was 0.05, and power was 0.80, the minimal number of patients was 82 patients.
Data collection consisted of two phases. In the first phase, the questionnaire data were collected. First, the researchers explained the purpose and significance of the study to participants using uniform instructions in a face-to-face manner and obtained their written informed consent. Then, the cognitive screening of the participants was completed in a quiet and comfortable environment. It took 8–10 min for the participants to complete the MoCA scale in question–answer form. During this process, the researchers scored the participants’ answers according to the instructions. Finally, it took approximately 10–15 min to complete the remaining questionnaires, including a sociodemographic questionnaire, BRIEF-A, and the Dietary Behavior Adherence Scale for Patients with Type 2 Diabetes Mellitus. In order to minimize possible common method biases, questionnaire items were randomly arranged in this study. After receiving the questionnaires, the researchers scrutinized all items of each questionnaire to ensure that there were no omissions or errors. If there was any omission or error, the participants were asked to complete or modify it.
In the second phase, inhibitory control was objectively measured. A total of 108 of the participants who completed the questionnaire were willing to continue to participate in the next two objective inhibitory control tasks, i.e., SST and Stroop task. First, the researchers introduced the rules and precautions of the experiment to the patients until they understood and then guided the patients into the experimental practice part to familiarize themselves with the specific operation process for the entire experiment. Formal trials were independently performed by the patients without any investigator guidance. This study was approved by the Ethics Committee of Air Force Medical University (No. 202206-02).
MeasuresDemographic and clinical variables Sociodemographic questionnaireThe questionnaire was self-designed by the investigators for the purpose of the study. The content of the questionnaire included age, gender, education level, monthly family income, course of diabetes, history of hypoglycemia in the past year, diabetic complications, treatment method, and BMI.
Cognitive screening Montreal Cognitive Assessment (MoCA)The MoCA is an internationally recognized standard examination tool for screening cognitive impairment. “Expert Consensus on Cognitive Impairment in Diabetic Patients” recommends the MoCA as a screening tool for mild cognitive impairment in diabetic patients [28]. The scale contains 11 items in 8 cognitive domains, such as visuospatial structure, executive ability, attention, memory, language function, abstract thinking, calculation and orientation, and can quickly screen mild cognitive function. The total score is 30 points, and higher scores indicate better cognitive function. A MoCA score ≥25 indicates a normal cognitive level [29].
Dietary adherence The Dietary Behavior Adherence Scale for Patients with Type 2 Diabetes MellitusThe questionnaire was developed by a Chinese scholar, Zhao Qiuli, and colleagues [30], through literature review and interviews in combination with the “Dietary Guidelines for Chinese Residents” and “Guidelines for the Prevention and Treatment of Type 2 Diabetes in China.” It is mainly used to measure the dietary behavior adherence of T2DM patients. Considering the differences in diet culture within and outside of China, this scale was suitable for this study. The scale includes the following 5 dimensions, comprising 23 items: diet self-regulation (5 items), carbohydrate and fat adherence behavior (5 items), oil and salt adherence behavior (4 items), fruit and vegetable adherence behavior (5 items) and cooking and eating habits (4 items). A 5-point Likert scoring method was used for each item: never = 1, rarely = 2, sometimes = 3, often = 4, and always = 5. The total score of the scale and the scores of each dimension were calculated; higher scores indicated better dietary behavior adherence. In this study, the overall Cronbach’s α coefficient of the scale was 0.891 (95% CI, 0.875–0.906), and the Cronbach’s α coefficients of the five dimensions ranged from 0.729 (95% CI, 0.684–0.769) to 0.830 (95% CI, 0.801–0.855).
Inhibitory controlSubjective measure The Behavior Rating Inventory of Executive Function-Adult Version (BRIEF-A)The inhibitory control subscale in BRIEF-A was used to measure the level of inhibitory control. The BRIEF-A is a standardized self-report questionnaire that measures individuals’ everyday executive function by assessing the behaviors associated with executive function deficits in everyday life in adults [31]. The scale included the following nine subscales: inhibitory control (8 items), shift (6 items), emotional control (10 items), self-monitoring (6 items), initiative (8 items), working memory (8 items), plan/organize (10 items), task monitor (6 items) and organization of materials (8 items). The BRIEF-A contains 75 items, of which five infrequency items are designated to detect atypical responses, and 70 items assess executive function. All items were rated on a three-point scale from 1 to 3. The total points of each subscale and index were transformed into age-appropriate standard scores (T-scores) based on normative data [31]. Higher T-scores reflect greater impairments in executive function. It has been proven that the BRIEF-A has good validity and reliability in China [32]. According to the purpose of the current study, the inhibitory control subscale was statistically analyzed, and the Cronbach’s α coefficient was 0.797 (95% CI, 0.765–0.826).
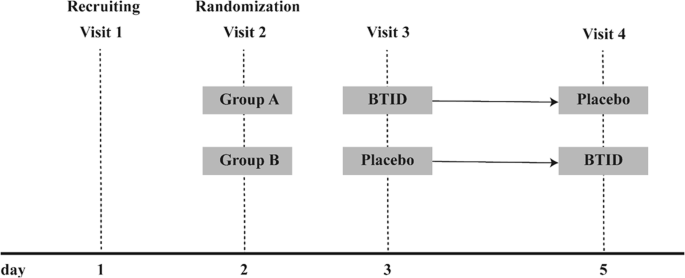
Objective measures Stop signal task (SST)The SST is a classical experimental paradigm to evaluate response inhibition ability [33]. The basic experimental process consists of two types of tasks: the go task and the stop task. The go task required the subjects to quickly make a selective key response after seeing the go signal (such as pressing the “F” key with the left index finger when “f” appeared and pressing the “J” key with the right index finger when “j” appeared). During the stop task, an obvious red dot appeared at a certain time interval (stop signal delay, SSD) after the stop signal appeared, at which time the subject was required to inhibit the impulse to press the key and stop the button reaction. The stop task appeared randomly throughout the experiment and usually accounted for 20–30% of the total task [34]. In this study, the proportion of stop signal trials in the task was set to 30% to obtain more inhibition trials [35]. The task consisted of a total of 200 trials, including 140 go signal trials and 60 stop signal trials. Stimuli were presented in the center of the screen, with a fixation point (+) appearing 250 ms before each stimulus and a 1000 ms time interval after each response keystroke. In the go task, the maximum presentation time of the go signal was 1250 ms, and if the participant did not press the button in time, the screen reminded them that their response was “too slow.” In the stop task, the stop signal appeared slightly later than the go signal, and if the inhibition was successful (no key pressed), the stimulus presentation time was also a maximum of 1250 ms. The initial value of the SSD in this task was set to 250 ms, and the SSD was automatically adjusted by the tracking method. If key impulse inhibition was successful, the SSD in the next stop task was increased by 50 ms. If key impulse suppression failed, the SSD in the next stop task was reduced by 50 ms to ensure that the successful inhibition rate of the participant was approximately equal to 50% (Fig. 1).
Fig. 1
Schematic representation of the stop signal task.
The go response time (GoRT) of the go task and SSD were recorded, and the stop signal response time (SSRT) was calculated according to the independent race model as an evaluation index of response inhibition ability [36]. The specific calculation method is as follows: SSRT = average GoRT − average SSD. A smaller SSRT indicates a greater response inhibition ability.
Stroop taskThe Stroop task is a classic paradigm for assessing individual interference inhibition ability [37]. The color-word Stroop task was used in this study. The experimental materials were composed of four color words, including “red,” “blue,” “green,” and “yellow.” There were two conditions: the congruent condition and the incongruent condition. The congruent condition indicates that the word meaning and the ink color were congruent, including “red” in red ink, “green” in green ink, “yellow” in yellow ink, and “blue” in blue ink. The incongruent condition indicates that the word meaning and the ink color were incongruent, such as “blue” in green ink. There were a total of 256 trials, which were randomly presented in the center of the screen. The ratio of consistent trials to inconsistent trials was 3:1. The subjects were asked to press the corresponding key according to the actual color of the word (press the “F” key for red, the “G” key for blue, the “J” key for green, and the “K” key for yellow). The corresponding key fingers were the left middle finger, left index finger, right index finger and right middle finger, respectively (Fig. 2).
Fig. 2
Schematic representation of the Stroop task.
The reaction times of congruent and incongruent trials were recorded, and the Stroop effect or conflict effect (the difference in reaction time between congruent trials and incongruent trials) was calculated to evaluate the interference inhibition ability. A smaller Stroop effect indicates greater interference inhibition ability.
Statistical analysesThe collected data were entered by Epidata Version 3.0 software and analyzed by SPSS Version 23.0. We performed descriptive statistical analyses for sociodemographic characteristics, dietary adherence, and inhibitory control based on subjective and objective measures. With the data meet the normal distribution, an independent t test or one-way ANOVA was performed to compare dietary adherence among different sociodemographic subgroups. Pearson correlation analysis and hierarchical regression analysis were performed to analyze the relationship between inhibitory control and dietary adherence. A p level of <0.05 was considered statistically significant.
Comments (0)