
記住我


Orthokeratology (ortho-k) is an optical process that could reshape the corneal and create peripheral myopic defocus on the retina, and it has been shown to be an effective treatment for children to slow the myopia progression.1–8 Ortho-k can reduce axial elongation by approximately 50% over 2 years.3 The treatment-zone size and decentration,7,8 corneal power shift5,6 and epithelial thickness of certain sectors9 caused by ortho-k lenses have been associated with axial length growth. Some studies have found that different lens designs can result in various peripheral refractions,10 corneal optical modifications,11,12 and myopia progress control.12 Refractive changes are mainly caused by the remodelling of the epithelium.13,14 Changes in stromal thickness after wearing the ortho-k lenses were inconsistent in different studies,15–17 and the anterior and posterior stromal curvature radii did not change significantly.18 Therefore, the shape of the epithelium after ortho-k treatment is important for evaluating the efficacy of lenses.
Optical coherence tomography (OCT) is an in vivo noncontact high-resolution imaging system for biological tissue scanning. RTVue XR OCT (Optovue, Inc., Fremont, CA) is a commercially available spectral-domain OCT (SD-OCT) system with a wide-field pachymetry pattern scan designed specifically for a 9-mm diameter corneal and epithelial thickness map. Liu et al. and Huang et al. first used the 9-mm widefield SD-OCT to analyze the epithelial thickness changes with ortho-k treatment.19,20 Using this approach, Ma et al. and Lu et al. reported excellent repeatability and reproducibility for corneal and epithelial measurements in normal eyes and eyes with different corneal conditions.21,22 An epithelial thickness map up to 9 mm in diameter can be used to evaluate peripheral corneal epithelial thickness changes induced by an ortho-k lens.
This study aimed to evaluate changes in the epithelial thickness map and corneal topography at different times for children fitted with two different designs of commercially available ortho-k lenses. In addition, we explore the correlation between topographic data and epithelial changes.
METHODS SubjectsAll subjects were recruited from the outpatient clinic of the Eye Hospital of Wenzhou Medical University. Fifty-six myopic subjects were enrolled, and all of them and their legal guardians signed informed consent forms with detailed explanations of the nature of this study. The study was approved by the institutional review board of the Eye Hospital of Wenzhou Medical University and followed the tenets of the Declaration of Helsinki.
We exclusively enrolled normal subjects without any history of ocular surgeries, diseases (except for refractive errors), or systemic diseases that may affect contact lens use. Subjects who had previously worn contact lenses were excluded from the study. All subjects were between 8 and 15 years old, with spherical error between −1.0 and −5.0 D, cylindrical error of at most 2.0 D, and a corrected distance visual acuity of 20/20 or better.
Contact LensesSubjects were randomly divided into the VST group (fitted with Dreamlite lenses [Procornea B.V., Netherlands]) and the CRT group (fitted with Paragon 100 lenses [Paragon Vision Science, AZ]). For the VST group, we used the diameter of the lenses ranged from 10.2 to 11.0 mm. The lens consisted of a central base curve with a 6.0-mm optical zone, 0.6-mm wide reverse curve, 1.0 to 1.4-mm wide alignment curve, and 0.5-mm wide peripheral curve. For the CRT group, the lenses consisting of a base curve, a reverse curve, and a noncurving alignment curve. In our study, the total diameter ranged from 10.0 to 11.0 mm, with a 6.0-mm back optic zone diameter and a 1.0-mm-wide reverse zone. The Jessen factor is 0.75 D in both groups. Both types of lenses are made of high-oxygen-permeability material. The same ophthalmologist provided an optimally-fitted ortho-k lens. Clinically, the lenses with toric peripheries were used when the difference of elevation at the 8-mm ring in two principal meridians reached 30 μm and more. The corneal diameter measure on the topographic map was multiplied by 0.95 to determine the total lens diameter. The initial alignment curve of lens was selected based on flat-K and corneal eccentricity measured using corneal topography. Usually, for each 0.05 increase in the average eccentricity, that is, (e_Min+e_Max)/2, the alignment curve should be flatter than the flat K by 0.25 D. Before the fitting evaluation, each subject wore the lens for 1 hr. A good fitting was determined by a centering of the lens on the cornea (a slight decentration without lens edge going beyond the limbus is acceptable) and a blink lens movement of less than 1 mm. The overall fluorescein pattern revealed a classic “bull's eye” and an edge zone of approximately 0.5 mm. The lens prescription included target power, diameter, and alignment curve power in the VST group and return zone depth and landing zone angle in the CRT group. The other parameters were not adjusted. The target power was the sum of the subjective refraction power and trial lens power after cycloplegic conditions. We performed over-refraction to identify the target power plus 0.75 dioptres as the final order. The treatment zone decentration on Medmont Corneal Topography (International Pty. Ltd, Victoria, Australia) was fitted using a custom Matlab function (MathWorks, Natick, WA) as described in our previous study.7 At the first follow-up visit, if there was a lens decentration greater than 1.0 mm, new lenses would be ordered until a good lens fit and centration were achieved. Once the response of the lenses was acceptable, the same lenses were used throughout the treatment period. All subjects were taught to apply and remove their contact lenses and wear the lenses every night, with a recommended time of 6 to 8 hr.
Ocular examinations were performed, including slitlamp biomicroscope, uncorrected distance visual acuity (UDVA), corrected distance visual acuity, corneal topography (Medmont, International Pty. Ltd), corneal refractive power (autorefractometer, KR880, Topcon, Japan), corneal epithelial thickness (OCT; RTVue XR). The examinations were taken between 8 and 10 am, approximately 2 to 4 hr after the lenses were removed. Follow-up examinations were performed at 1 day, 1 week, and 1 month after the commencement of lens wear.
Data from the right eye were collected for analysis if the subjects were fitted with ortho-k lenses in both eyes. If only one eye was fitted with a lens, only one eye was enrolled.
Corneal TopographyMedmont corneal topography (International Pty. Ltd) was assessed at baseline and every follow-up visit. At least three topographic maps were captured on each occasion, and the map with the best image quality was selected for analysis. A difference map obtained by subtracting the 1-month postfit tangential map from the baseline map was used for analysis. The treatment zone was defined as an area where the cornea is flattened by more than 0.00 D on the difference tangential map. The high convex zone (HCZ) represents a steeper corneal area, which generates a positive corneal power on the difference tangential map. The treatment zone diameter (TZD; vertical and horizontal) and the HCZ (superior, inferior, temporal, and nasal) width and power were measured using the two-dimensional sectional representation graph of difference tangential map in respective regions of the cornea. The mean TZD defined as the average of vertical and horizontal TZDs was used to analyze in our study. The details of the calculation were based on the methods previously described by Marcotte-Collard et al.11
Optical Coherence TomographyCorneal and epithelial thickness maps were obtained using a spectral-domain optical coherence tomography (SD-OCT) system (RTVue XR, Optovue Inc) with a wide-field pachymetry pattern. The RTVue XR SD-OCT with a corneal anterior module (CAM) was used to image the cornea by focusing on the pupil center. Subjects were asked to focus on the internal light ahead. A 9-mm diameter radial scan was performed (eight radials, 1,536 A-scans/line, B scan four frames average) for both eyes of each subject. Each eye was scanned three times at each visit, and if the eyelid or eyelashes were blocking or shadowing a portion of the image in a 7-mm diameter circle, the scan was excluded. The remaining images were averaged for analysis.
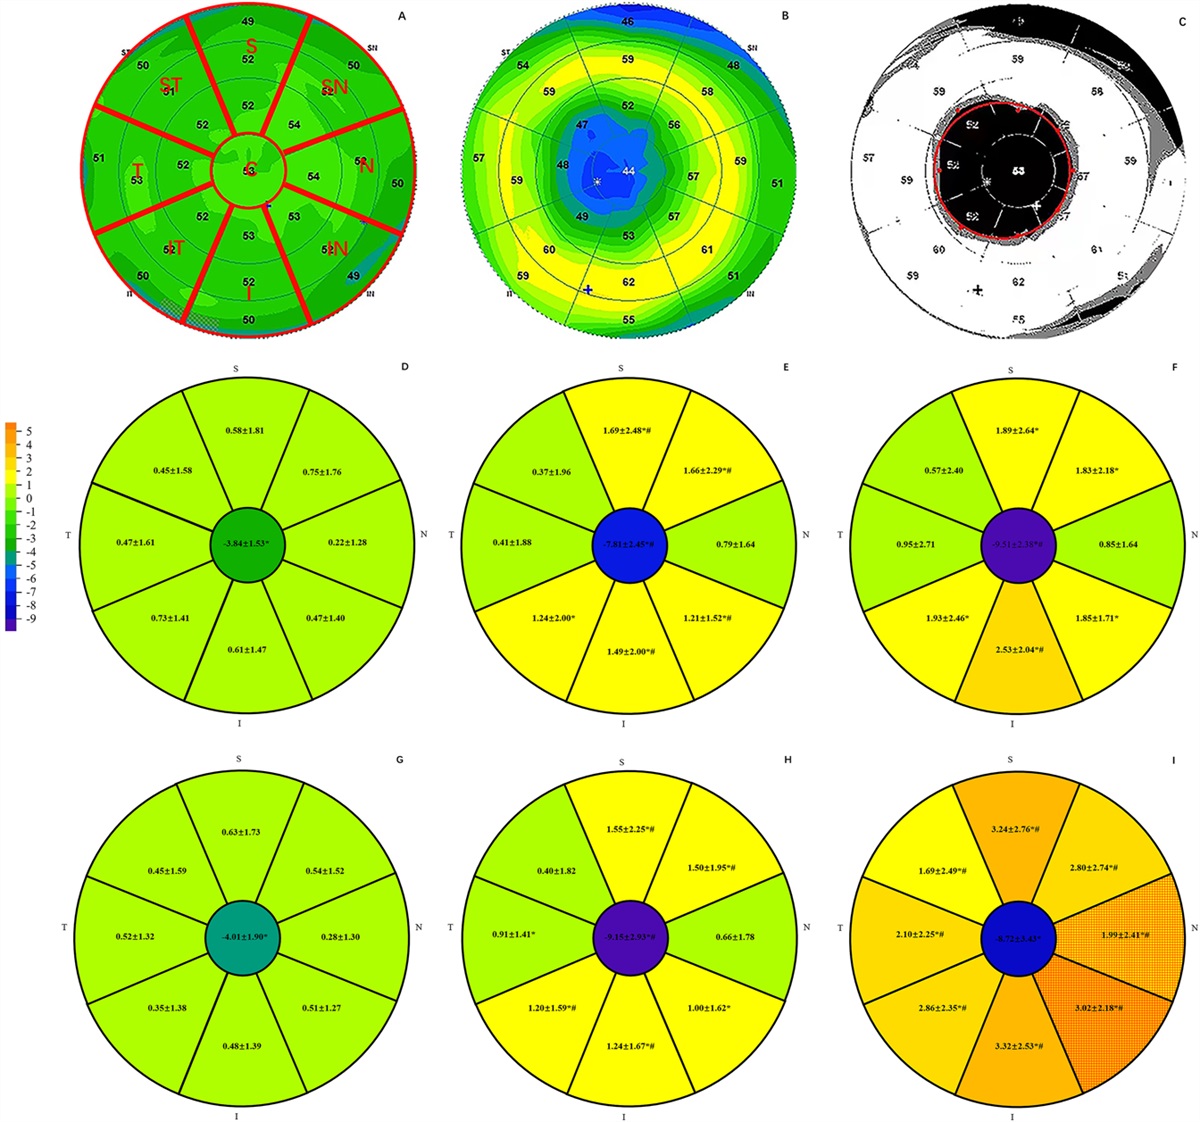
A 9-mm diameter thickness map was automatically divided into two zones by diameter: 2 mm central (C), 2 to 9 mm peripheral (P). P were further divided into eight zones: the superior (S), superior nasal (SN), nasal (N), inferior nasal (IN), inferior (I), inferior temporal (IT), temporal (T), and superior temporal (Fig. 1A). The epithelial and corneal thicknesses of each zone were obtained using a built-in software. The epithelial thickness changes (△ET) induced by ortho-k were calculated between postorthokeratology and the baseline.
 FIG. 1.:
 The simulation of treatment zone area, and epithelial thickness changes of each zone. (A) An epithelial thickness map at baseline; (B) An epithelial thickness map at the 1-month visit; (C) A difference map between baseline and postorthokeratology. The red circle represents the treatment zone; (D–F) Difference map (1 day-baseline, 1 week-baseline, 1 month-baseline) in the VST group; (G–I) Difference map (1 day-baseline, 1 week-baseline, 1 month-baseline) in the CRT group. *Significant difference between baseline and postorthokeratology. #Significant difference between two adjacent postorthokeratology epithelial changes. The red grid indicates a significant difference between the VST and CRT groups at a time point in that location. CRT, corneal reshaping therapy; VST, vision shape treatment.
The epithelial thickness difference map was then calculated using the baseline and postorthokeratology epithelial thickness maps. The treatment zone was defined as the central flattening zone, in which the postorthokeratology epithelial thickness was thinner than the baseline in the epithelial thickness difference map. Eight uniformly distributed points were plotted automatically to surround the treatment zone using our self-developed algorithm based on the Open-Source Computer Vision (OpenCV) library. These points were simulated as the best-fitting circle by a least-squares method circle-fit function (Fig. 1C). The diameter of the fitted circle was calculated as the TZD. For each subject, one baseline epithelial thickness map and one postorthokeratology epithelial thickness map were randomly selected to calculate the epithelial thickness difference map and treatment zone size. The selection and calculation were performed twice for each subject. Repeatability tests were conducted for the two calculated treatment zone sizes.
Statistical AnalysisThe normality of the data was assessed using the Shapiro–Wilk test. A chi-square test, independent t test, or Mann–Whitney U test was used to compare the demographic variables and ocular parameters between the two groups. A two-way repeated measures analysis of variance (ANOVA) was performed to assess the epithelial thickness and corneal topography changes because of time and lens design. Post-hoc Bonferroni t-tests were performed for multiple comparisons. Pearson or Spearman correlation test was used to analyze the associations between different variables. All tests were two-tailed, and statistical significance was defined as a P-value < 0.05.
RESULTSThe VST group included 26 eyes of 26 patients and the CRT group included 30 eyes of 30 patients. Before ortho-k, no significant differences were found between the two groups in demographic and refraction data (Table 1). At 1 month, the UDVA of all subjects was 20/20 or better.
TABLE 1. - Demographic and Ortho-K Lens Treatment Data for Study Groups Characteristic VST Group CRT Group P (Two-Tailed) n 26 30 — Sex, n male (%) 16 (61.5) 11 (36.7) 0.107 Age, years (IQR) 10.0 (3.0) 10.0 (2.0) 0.626 Sphere, D (IQR) −1.75 (1.00) −2.13 (2.75) 0.914 Cylinder, D (IQR) −0.50 (0.75) −0.50 (0.44) 0.879 Spherical equivalent, D (IQR) −2.13 (1.13) −2.39 (2.84) 0.547 K flat, D (mean±SD) 43.08±1.15 42.32±1.21 0.904 K steep, D (mean±SD) 43.76±1.37 43.39±1.13 0.379 e_Min 0.63±0.09 0.64±0.11 0.706 e_Max 0.505±0.14 0.49±0.15 0.739 Pupil diameter (mm) 4.79±0.84 4.45±0.98 0.175 Axial length, mm (mean±SD) 24.68±0.86 24.75±0.71 0.734 Target power, D (IQR) −2.00 (1.25) −2.13 (1.00) 0.571 Astigmatism-design lens, eye (yes: no) 10:16 5:25 0.066 Overall lens diameter, mm (mean±SD) 10.67±0.25 10.68±0.28 0.805 Alignment curve radiusa, mm (mean±SD) 7.73±0.26 NA — Return zone deptha, μm (IQR) NA 525 (25) — Landing zone anglea, º (IQR) NA −32.5 (0.50) —aAstigmatism prescription using average Alignment curve radius, Return zone depth, or Landing zone angle for calculation.
CRT, corneal reshaping therapy; IQR, interquartile range; NA, not assessed; Ortho-k, orthokeratology; VST, vision shape treatment.
In the VST group, the superior and inferior HCZ width and the superior HCZ power were larger at 1 week than 1 day (P≤0.04), and stable after 1 week. In the CRT group, the superior, nasal, and temporal HCZ power was larger at 1 week than 1 day (P≤0.004), and the inferior HCZ width further widened after 1 week (P≤0.02; Fig. 2). The HCZ width and power remained stable after 1 day of ortho-k lens wear in other regions.
 FIG. 2.:
 The changes of HCZ width (A-D) and power (E-H) in VST and CRT group. The red or blue asterisks indicate a significant difference between two adjacent postorthokeratology changes. The black asterisk indicates a significant difference between the VST and CRT groups at a point in time. CRT, corneal reshaping therapy; HCZ, high convex zone; VST, vision shape treatment.
At 1 month, the nasal HCZ power in the CRT group was larger than that in the VST group (P=0.003, Fig. 2D,F). The HCZ width in the CRT group was equivalent to that in the VST group at any time of lens wear (Fig. 2A,C).
In the VST group, the TZD in the corneal topography map increased from 1 day (2.96±0.39 mm) to 1 month (3.26±0.31 mm), and the TZD at 1 month was significantly larger than that at 1 week (P=0.001). In the CRT group, the TZD in the corneal topography map increased from 1 day (3.47±0.27 mm) to 1 week (3.58±0.34 mm). At 1 month, the TZD for the CRT group was 3.56±0.42 mm, which was identical to the value at 1 week (P=0.254). The VST group showed smaller TZD than the CRT group at any time points (P≤0.01, Fig. 3A). In both groups, the TZDs were smaller than pupil diameters at 1 month (P<0.001).
 FIG. 3.:
 The changes of treatment zone diameter in difference tangential map (A) and in difference epithelial thickness map (B) in VST and CRT group. The red or blue asterisks indicate a significant difference between two adjacent postorthokeratology changes. The black asterisk indicates a significant difference between the VST and CRT groups at a point in time. CRT, corneal reshaping therapy; VST, vision shape treatment.
Epithelial Thickness Changes After Different Types of Lenses WearIn both groups, the postorthokeratology central epithelial thickness decreased significantly compared with that of baseline. In the VST group, the central △ET was further decreased after 1 week (P=0.002) (Fig. 1D,F); however, in the CRT group, the △ET at 1 week and 1 month were identical. The central △ET in the VST group was equivalent to that in the CRT group at any time point of lens wear (Fig. 1G,I).
In the VST group, the epithelial thickness in five zones of S, SN, IN, I, and IT increased with time (P≤0.006). The △ET of these zones became thick at 1 day to 1 week, except in the inferior zone, where it became much thick after 1 week (P≤0.017; Fig. 1D,F). In the CRT group, the epithelial thicknesses of all zones of 2 to 9 mm peripheral increased with time and kept increasing after 1 week (P≤0.003). At 1 month, △ET in the CRT group was larger than that in the VST group for N and IN (P≤0.036) (Fig. 1G,I).
Measurement of the TZD in epithelial thickness difference map at 1 day, 1 week, and 1 month showed good repeatability, with ICC values of 0.797, 0.897, and 0.912 (all P<0.01), respectively. For the VST group, TZD kept increasing after 1 week (P=0.003), and it reached 3.70±0.56 mm at 1 month. For the CRT group, TZD reached 3.45±0.49 mm at 1 month, which was the same at 1 week (P=0.169). At 1 month, TZD of the two groups were identical (P=0.053; Fig. 3B), and for each group, the TZD was smaller than the pupil diameter (P<0.001).
Correlations Between Optical Effects and Epithelial ThicknessAt 1 month, in the corneal topography map, the location of the center of the treatment zone was 0.32±0.26 mm temporally in the VST group and 0.37±0.35 mm temporally in the CRT group. Vertically, the treatment zone was decentered 0.49±0.31 mm inferiorly in the VST group and 0.50±0.28 mm inferiorly in the CRT group. There was no significant difference between the two groups.
The results of correlations based on topographic corneal variations and their respective corresponding △ET were presented in Table 2. In the VST group, a positive correlation was found between the HCZ power and △ET in inferior and temporal zones (P≤0.013). In the CRT group, a positive correlation was found between inferior HCZ power and the corresponding △ET (P=0.049). No significant correlation was found between HCZ width and epithelial thickness in both groups. A significant positive correlation was found between the two methods of measuring TZD measured by the epithelial thickness map and corneal topography map in the CRT group (P=0.026).
TABLE 2. - Correlations Between Topographic Corneal Variations and its Respective Corresponding Zone of Epithelial Thickness Changes at 1 Month VST Group CRT Group Correlation coefficient P Correlation coefficient P HCZ width vs. 2- to 9-mm zone epithelial thickness changes Superior −0.319 0.113 0.037 0.849 Inferior 0.97 0.638 0.251 0.190 Temporal 0.345 0.084 0.001 0.998 Nasal −0.226 0.268 −0.155 0.423 HCZ power vs. 2- to 9-mm zone epithelial thickness changes Superior 0.310 0.123 0.127 0.512 Inferior 0.634 ≤0.001 0.369 0.049 Temporal 0.480 0.013 0.044 0.821 Nasal 0.170 0.933 0.071 0.713 TZD in difference tangential map vs. epithelial thickness difference map 0.118 0.564 0.426 0.026CRT, corneal reshaping therapy; HCZ, high convex zone; TZD, treatment zone diameter; VST, vision shape treatment. Bold entries: Statistically significant result.
Ortho-k lens can temporarily, but quickly and effectively reshape the surface of the cornea. This study analyzed changes in epithelial thickness map and corneal tomography at different time points after ortho-k.
In the VST group, the central epithelial thickness was 52.43±2.39 μm at baseline, and it decreased to 42.91±2.65 μm at 1 month. In the CRT group, the central epithelial thickness was 53.54±2.84 μm at baseline, and it decreased to 44.83±3.58 μm at 1 month. These results were consistent with the study of Qu and Zhou,23 which showed about 8.42 mm decrease of the central epithelial thickness from the baseline to 1 month. Zhang et al.17's study also showed similar results, which indicated that the central epithelial thickness decreased from the 52.04±2.35 μm at the baseline to 47.53±3.44 μm at 1 month using the same SD-OCT instrument. We observed that the mean epithelial thickness for both groups increased in the 2- to 9-mm peripheral zone after wearing the lenses for 1 month. Previous studies also showed that the epithelial thickness significantly increased in the midperipheral region.14,15,23,24 As suggested by Lu et al.25 and Zhou et al.,26 differences in corneal thicknesses between different subjects or studies depend on corneal malleability or toricity. In our study, there was no significant difference in corneal astigmatism and astigmatism-design lens selection between the two groups. In this study, the changes in epithelial thickness reinforced with the fact that the central epithelia were compressed and the midperipheral epithelia appeared inflated under reverse-geometry lenses as a result of ortho-k lens-induced pressure.27–29
Some authors found that most changes in the epithelial thickness as a result of ortho-k lens wear occurred within 1 month.14,17,24 In the study of Lian et al.,24 the epithelial thicknesses were measured at the horizontal and vertical meridians and all epithelial thicknesses remained stable after 1 week of ortho-k lens (E&E Optics Ltd, Hong Kong, China) wear. Zhang et al.17 also found that the epithelium of the central and reverse curve zones became stable after wearing the ortho-k lens (Autek China, Inc., Hefei, China) for 1 week. In this study, the corneal epithelial map was divided into the central 2 mm and the peripheral 2 to 9 mm depending on the measurement of the minimum TZD on the corneal topography, which was 2.50 mm. After 1 week, there was no further change in epithelial thickness in most zones of the VST group, except that the central epithelial thickness further decreased until 1 month. However, in the CRT group, △ET of all zones of 2 to 9 mm peripheral became much thicker after 1 week. On the topography map, the time HCZ and TZD became stable was similar to the time ΔET became stable in the epithelial thickness map. It was further confirmed that epithelia and topography change quickly and simultaneously after ortho-k.
At 1 month, the central ΔET was identical in two groups, although in the 2 to 9 mm zones, △ET in the CRT group was higher than that in the VST group. Especially in the N and IN regions, ΔET were significantly different. Similarly, we found that the nasal HCZ power was larger in the CRT group than in the VST group at 1 month. Marcotte-Collard et al.11's study also observed a higher HCZ power trend in the superonasal quadrant of patients wearing VST-type lenses (Dream Lens; Polymer Technology) than in those wearing CRT-type lenses (Paragon CRT, Paragon). This may be because of different designs of lenses with varied volumes of tears pooling in the reverse curve coverage area,30 and the CRT type lens demonstrated a lesser central thickness and a lower rigidity than VST type lens. The CRT type lens may have a greater tension in the reverse curve zone and less pressure in the central cornea of the base curve zone. The epithelial thickness after reshaping was identical or greater in the CRT group than in the VST group, which may explain the fewer incidences of corneal staining with CRT type lens than that with VST type lens in the previous study.31 The back optic zone diameter of two types of lenses was 6.0 mm, and there was no difference about TZD between the two groups on epithelial thickness maps. By measuring the difference tangential map, our findings indicated that the VST group showed a smaller treatment zone size than the CRT group, and this is consistent with the studies by Marcotte-Collard et al.11 and Yang et al.12 A smaller TZD and more area and power of HCZ within the pupil was better for myopia progression control.5,12 These results suggested that the difference of geometric design, not only the size of zones, between the two types lenses played an important role in the effect of lens wear on corneal epithelial and optical changes.
Most of the reports on the refractive changes induced by ortho-k concluded that the epithelium plays a major role in this effect, and that it is dependent on lens design.13,14,29,32 Our results investigated the association between the epithelium and corneal refractive in the reverse curve zone. We found a positive correlation between the HCZ power and the corresponding △ET in the inferior and temporal regions for the VST group, and in the inferior region for the CRT group. Some zones demonstrated no significant correlation, may be because of the asymmetric distribution of epithelia and bias introduced by the larger treatment zone contained in the peripheral 2- to 9-mm zone. In previous studies, the treatment zone moved from central to inferotemporal, and the epithelia of 2 to 5 mm, inferior temporal zones were thinner.9,14 This asymmetric epithelial thinning and thickening may be related to the lens with slight inferotemporal decentration. The ortho-k lens decentring toward the inferotemporal quadrant of the cornea was commonly reported by corneal topography.33,34 In our study, the decentration points of treatment zone showed no difference between the two groups. Previous studies mainly focused on the association between target refraction and central epithelial thickness changes, whereas this study examined the association between optical changes in the reverse curve zone and epithelial thickness in the peripheral zone. Therefore, this study performed a more detailed observation about the effects of changes in epithelial thickness correlated to the changes in refraction.
This study had certain limitations. First, although RTVue XR SD-OCT is one of the most commonly used instruments to measure corneal and epithelial thickness, it averages the measured thickness within each measurement zone and cannot accurately locate the reverse curve region. Consequently, subtle changes or differences in the thickness induced by different lens designs may be masked. Second, in addition to lens design, the asymmetric epithelial thinning and thickening could be attributed to many factors. For example, eyelid pressure related to lens decentration may have contributed to epithelial steepening in the inferotemporal region. And the SD-OCT was manually centered on the pupil center. Therefore, we did not precisely measure the decentration magnitude in the epithelial thickness map. Finally, the oxygen transmissibility (DK/t) is different because of the different thicknesses of the two lens types, although both materials have a high-oxygen-permeability coefficient of approximately 100 (DK). Therefore, the possible effects of different oxygen transmissibilities cannot be excluded when assessing the effect of lens design on epithelial changes.
In conclusion, at the early stage of ortho-K, epithelia and topography change quickly and simultaneously. The positive correlation between the HCZ power and the corresponding △ET in both groups is consistent with the view that epithelial changes seem to play a major role in corneal topography changes induced by ortho-K. The epithelial and optical remodelling varied between two geometric designs of lenses. The detailed analysis of the design and articulation of various curves on different lenses may optimize the efficacy of the ortho-K lens.
ACKNOWLEDGMENTSThe authors would like to acknowledge the fund by Tianjin Key Medical Discipline (Specialty) Construction Project.
REFERENCES 1. Kakita T, Hiraoka T, Oshika T. Influence of overnight orthokeratology on axial elongation in childhood myopia. Invest Opthalmol Vis Sci 2011;52:2170–2174. 2. Cho P, Cheung SW. Retardation of myopia in orthokeratology (ROMIO) study: A 2-year randomized clinical trial. Invest Opthalmol Vis Sci 2012;53:7077–7085. 3. Vanderveen DK, Kraker RT, Pineles SL, et al. Use of orthokeratology for the prevention of myopic progression in children: A report by the American academy of ophthalmology. Ophthalmology 2019;126:623–636. 4. Hiraoka T, Kakita T, Okamoto F, et al. Influence of ocular wavefront aberrations on axial length elongation in myopic children treated with overnight orthokeratology. Ophthalmology 2015;122:93–100. 5. Hu Y, Wen C, Li Z, et al. Areal summed corneal power shift is an important determinant for axial length elongation in myopic children treated with overnight orthokeratology. Br J Ophthalmol 2019;103:1571–1575. 6. Lee EJ, Lim DH, Chung TY, et al. Association of axial length growth and topographic change in orthokeratology. Eye Contact Lens 2018;44:292–298. 7. Lin W, Li N, Gu T, et al. The treatment zone size and its decentration influence axial elongation in children with orthokeratology treatment. BMC Ophthalmol 2021;21:362. 8. Wang A, Yang C. Influence of overnight orthokeratology lens treatment zone decentration on myopia progression. J Ophthalmol 2019;2019:1–7. 9. Kuo YK, Chen YT, Chen HM, et al. Efficacy of myopia control and distribution of corneal epithelial thickness in children treated with orthokeratology assessed using optical coherence tomography. J Pers Med 2022;12:278. 10. Kang P, Swarbrick H. The influence of different OK lens designs on peripheral refraction. Optom Vis Sci 2016;93: 1112–1119. 11. Marcotte-Collard R, Simard P, Michaud L. Analysis of two orthokeratology lens designs and comparison of their optical effects on the cornea. Eye Contact Lens 2018;44:322–329. 12. Yang X, Bi H, Li L, et al. The effect of relative corneal refractive power shift distribution on axial length growth in myopic children undergoing orthokeratology treatment. Curr Eye Res 2021;46:657–665. 13. Nieto-Bona A, González-Mesa A, Nieto-Bona MP, et al. Short-term effects of overnight orthokeratology on corneal cell morphology and corneal thickness. Cornea 2011;30:646–654. 14. Qian Y, Xue F, Huang J, et al. Pachymetry map of corneal epithelium in children wearing orthokeratology contact lenses. Curr Eye Res 2014;39:263–270. 15. Kim WK, Kim BJ, Ryu IH, et al. Corneal epithelial and stromal thickness changes in myopic orthokeratology and their relationship with refractive change. PLoS One 2018;13:e0203652. 16. Wan K, Yau HT, Cheung SW, et al. Corneal thickness changes in myopic children during and after short-term orthokeratology lens wear. Ophthalmic Physiol Opt 2021;41:757–767. 17. Zhang J, Li J, Li X, et al. Redistribution of the corneal epithelium after overnight wear of orthokeratology contact lenses for myopia reduction. Cont Lens Anterior Eye 2020;43:232–237. 18. Ran Z, Moore J, Jiang F, et al. A new approach for quantifying epithelial and stromal thickness changes after orthokeratology contact lens wear. R Soc Open Sci 2021;8:211108. 19. Liu CF, Lee JS, Sun CC, et al. Correlation between pigmented arc and epithelial thickness (COPE) study in orthokeratology-treated patients using OCT measurements. Eye 2020;34:352–359. 20. Huang PW, Yeung L, Sun CC, et al. Correlation of corneal pigmented arc with wide epithelial thickness map in orthokeratology-treated children using optical coherence tomography measurements. Cont Lens Anterior Eye 2020;43:238–243. 21. Ma JX, Wang L, Weikert MP, et al. Evaluation of the repeatability and reproducibility of corneal epithelial thickness mapping for a 9-mm zone using optical coherence tomography. Cornea 2019;38:67–73. 22. Lu NJ, Chen D, Cui LL, et al. Repeatability of cornea and sublayer thickness measurements using optical coherence tomography in corneas of anomalous refractive status. J Refract Surg 2019;35:600–605. 23. Qu D, Zhou Y. Post-ortho-k corneal epithelium changes in myopic eyes. Dis Markers 2022;2022:1–5. 24. Lian Y, Shen M, Jiang J, et al. Vertical and horizontal thickness profiles of the corneal epithelium and bowman's layer after orthokeratology. Invest Opthalmol Vis Sci 2013;54:691–696. 25. Lu F, Simpson T, Sorbara L, et al. Malleability of the ocular surface in response to mechanical stress induced by orthokeratology contact lenses. Cornea 2008;27:133–141. 26. Zhou J, Xue F, Zhou X, et al. Thickness profiles of the corneal epithelium along the steep and flat meridians of astigmatic corneas after orthokeratology. BMC Ophthalmol 2020;20:240. 27. Choo JD, Caroline PJ, Harlin DD, et al. Morphologic changes in cat epithelium following continuous wear of orthokeratology lenses: A pilot study. Cont Lens Anterior Eye 2008;31:29–37. 28. Cheah PS, Norhani M, Bariah MA, et al. Histomorphometric profile of the corneal response to short-term reverse-geometry orthokeratology lens wear in primate corneas: A pilot study. Cornea 2008;27:461–470. 29. Ding H, Pu A, He H, et al. Changes in corneal biometry and the associated histology in rhesus monkeys wearing orthokeratology contact lenses. Cornea 2012;31:926–933. 30. Tahhan N, Du Toit R, Papas E, et al. Comparison of reverse-geometry lens designs for overnight orthokeratology. Optom Vis Sci 2003;80:796–804. 31. Lu W, Ning R, Diao K, et al. Comparison of two main orthokeratology lens designs in efficacy and safety for myopia control. Front Med (Lausanne) 2022;9:798314. 32. Nieto-Bona A, González-Mesa A, Nieto-Bona MP, et al. Long-term changes in corneal morphology induced by overnight orthokeratology. Curr Eye Res 2011;36:895–904. 33. Chen Z, Xue F, Zhou J, et al. Prediction of orthokeratology lens decentration with corneal elevation. Optom Vis Sci 2017;94:903–907. 34. Gu T, Gong B, Lu D, et al. Influence of corneal topographic parameters in the decentration of orthokeratology. Eye Contact Lens 2019;45:372–376.
留言 (0)