Bacterial strains, plasmids, and bacteriophages
E. coli MG1655 strain, its derivatives, bacteriophages, and plasmids are presented in Table 1.
Table 1 Bacterial strains, bacteriophages, and plasmids used in in vivo experimentsThe deletion mutant of Φ24B phage, lacking the sequence of the region located between exo and xis genes, was constructed as described previously (Licznerska et al. 2016), by using E. coli MG1655 (Φ24B) strain and the Quick and Easy E. coli Gene Deletion Kit (Gene Bridges, Heidelberg, Germany). Plasmid pUC18 (Thermo Fisher Scientific Inc., Waltham, MA, USA) was employed as a control variant in all experiments presented in this work. For construction of the plasmid pUC18_exo-xis_Φ24B, nucleotide sequences of all orfs and genes localized between exo and xis genes from the genome of phage Φ24B were amplified by the PCR method with primers F_Φ24B_exo-xis_HindIII (5′GTC AAG CTT GAA GGC GGT TGT TAG) and R_Φ24B_exo-xis_EcoRI (5′TGA GGA TCC GTA TAT GGG GAG CAA TG). Specific oligonucleotide primers were developed by Primer3web version 4.1.0 and synthesized by GENOMED S.A. (Warsaw, Poland). Phage DNA was isolated by using MasterPure™ Complete DNA and RNA Purification Ki (Biosearch Technologies, Hoddesdon, Great Britain). Following digestion with HindIII and BamHI restriction endonucleases (Thermo Fisher Scientific Inc., Waltham, MA, USA), the Φ24Bexo-xis region was ligated with the HindIII-BamHI fragment of plasmid pUC18 bearing an ampicillin-resistant gene and the plac promoter. Ligation was conducted by using the T4 DNA ligase (Thermo Fisher Scientific Inc., Waltham, MA, USA) according the manufacturer’s protocol. The construction of the pUC18_exo-xis_Φ24 was confirmed by DNA sequencing (GENOMED, Warsaw, Poland).
Bacterial growth media and cultures
Bacteria were routinely cultured in the Luria-Bertani (LB) medium (BioShop, Burlington, ON, Canada), supplemented with 10 mM CaCl2 (Chempur, Piekary Śląskie, Poland) and 10 mM MgSO4 (Chempur, Piekary Śląskie, Poland). Where appropriate, the following antibiotics were added: chloramphenicol up to 2.5 μg/ml (BioShop, Burlington, ON, Canada) or ampicillin up to 50 μg/ml (BioShop, Burlington, ON, Canada). The LB broth supplemented with 1.5% agar (LA; BTL, Łódź, Poland) was used as a bottom agar for pouring the Petri dishes. Top agar consisted of LB medium and 0.7% bacteriological agar (BTL, Łódź, Poland). The host bacteria were grown under aeration conditions, achieved by shaking, at 30 °C (most experiments) or 37 °C (preparation of phage lysate). The Petri dishes with bacterial strains were incubated overnight at 37 °C.
Propagation of bacterial viruses
Bacteria lysogenic with tested bacteriophages, Φ24B or Φ24BΔexo-xis, were grown in LB medium to OD600 of 0.1. Prophage induction was provoked by addition of mitomycin C (BioShop, Burlington, ON, Canada) to a final concentration of 1 μg/ml. The mixture was incubated at 37 °C with shaking until lysis occurred. The obtained lysate was treated with 4% chloroform for 15 min (Chempur, Piekary Śląskie, Poland) and cleared of cellular debris by centrifugation (2000 × g, 10 min, 4 °C). In the next step, polyethylene glycol 8000 (PEG8000; BioShop, Burlington, ON, Canada) was added to a final concentration of 10% and stirred overnight at 4 °C. The precipitate was collected by centrifugation (8000 × g, 20 min, 4 °C) and suspended in TM buffer (10 mM Tris-HCl, 10 mM MgSO4; pH 7.2). To recover virions, the suspension was treated with equal volume of chloroform and centrifuged (2000 × g, 10 min, 4 °C). The extraction procedure was repeated until no white interface between the aqueous and organic phases was visible. Finally, the upper phase with phage particles was collected and the titer of the phage lysate was determined by using a plaque assay described below.
Bacteriophage lysate titration
Bacteriophage titration procedure was performed using standard Petri dishes filled with 25 ml of LA medium. Soft agar (0.7%), supplemented with 10 mM CaCl2 and 10 mM MgSO4, was maintained at 60 °C before use. The top layer was prepared by mixing 1 ml of an overnight bacterial host culture with 2 ml of the soft agar. The tube with the mixture was slowly rotated for 10–15 s and then immediately poured onto LA bottom agar supplemented with 2.5 μg/ml of chloramphenicol. To determine the number of phage particles per 1 ml of suspension (plaque forming units per ml, PFU/ml), the obtained phage lysate was serially 10-fold diluted in TM buffer (10 mM Tris-HCl, 10 mM MgSO4; pH 7.2) and then 2.5 μl of each dilution was spotted on the surface of the top agar. The Petri dishes were incubated at 37 °C for 20 h. The next day, single plaques were counted, and the phage titer was calculated.
One-step growth experiment
To assess the kinetics of intracellular phage development, one-step growth experiment was performed according to the previously described procedure (Bloch et al. 2014). Briefly, host bacteria were grown in LB medium at 30 °C to an OD600 of 0.2. Then, 10 ml of bacterial culture was centrifuged (2000 × g, 10 min, 4 °C) and the pellet was suspended in 1 ml of LB medium supplemented with 3 mM sodium azide (Merck, Darmstadt, Germany), 10 mM CaCl2, and 10 mM MgSO4. Then, phage lysate was added to the sample to multiplicity of infection (m.o.i.) of 0.05 and allowed to adsorb on the bacterial cells surface for 10 min at 30 °C. After incubation, unadsorbed phages were removed by 3-times washing in LB medium with 3 mM sodium azide and centrifugation (2000 × g, 10 min, 4 °C). In the next step, 25 μl of the mixture was transferred to the flask filled with 25 ml of fresh, pre-warmed to 30 °C LB medium (time 0). The infected bacterial cultures were aerated in an incubator shaker at 30 °C. The number of infective centers was estimated from nine samples taken in the interval of 0–15 min after the dilution and plating at the permissive conditions. Samples withdrawn at later times were shaken vigorously with equal volume of chloroform and cleared by centrifugation (2000 × g, 5 min, RT). The number of intracellular progeny phages was estimated by plating on appropriate indicator E. coli MG1655 strain. Plates were incubated overnight at 37 °C and then burst size was estimated as a ratio of phage titer at particular time points to the titer of infection centers.
Efficiency of lysogenization
To estimate the efficiency of lysogenization, the procedure described earlier (Dydecka et al. 2017) was used, with some modifications. Briefly, host bacteria were cultivated in LB medium with shaking at 30 °C to OD600 of 0.2. Then, 1 ml of the sample was centrifuged (2000 × g, 10 min, 4 °C) and the bacterial pellet was washed 2 times with TCM buffer (10 mM Tris-HCl, 10 mM MgSO4, 10 mM CaCl2; pH 7.2). Finally, the obtained pellet was suspended in 1 mL of TCM buffer and phage lysate was added to the mixture to an m.o.i. of 5. After incubation of the sample at 30°, the serial 10-fold dilutions in TCM buffer (10 mM Tris-HCl, 10 mM MgSO4, 10 mM CaCl2; pH 7.2) were prepared and 20 μl of each dilution was plated on LA plates. Following overnight incubation at 37 °C, 96 bacterial colonies were cultivated in a multi-well plate containing 200 μl of LB. Each plate was shaken at 37 °C until OD600 reached 0.1. Then, the putative lysogens were treated with ultraviolet light at 50 J/m2 for 20 s and cultivated with shaking for the next 2 h at 37 °C. Afterward, 10 μl of chloroform was added to each well, the plates were centrifugated (2000 × g, 10 min, 4 °C) and 2.5 μL of the supernatant was spotted onto double-layer LB agar plates with 2.5 μg/ml of chloramphenicol. Plates were incubated overnight at 37 °C, and then, the efficiency of prophage formation was calculated as a percentage of lysogens among all tested 96 bacterial colonies.
Survival of host bacteria after phage infection
To determine the survival of host bacteria after phage infection, the procedure described earlier (Dydecka et al. 2017) was used. Briefly, bacteria were grown in LB medium at 30 °C to OD600 of 0.2. Sample of 4 ml was centrifuged (2000 × g, 10 min, 4 °C) and the obtained bacterial pellet was washed (2000 × g, 10 min, 4 °C) twice with cold 0.85% sodium chloride (Chempur, Piekary Śląskie, Poland). Finally, the bacterial pellet was suspended in 1 ml of LB medium supplemented with 10 mM CaCl2 and 10 mM MgSO4 and then phage lysate was added to an m.o.i. of 5. After incubation at 30 °C, serial dilutions in 0.85% sodium chloride were prepared and 40 μl were spread onto Petri dishes filled with the solid LA medium. Plates were incubated overnight at 37 °C. Percentage of survivors was calculated relative to bacterial sample in which TM buffer was added instead of phage virions.
Efficiency of phage adsorption
The rate of adsorption of virions on the surface of host cells was determined according to the procedure described previously (Bloch et al. 2013), with some modifications. Briefly, host bacteria were grown in LB medium at 30 °C until OD600 reached 0.1. Sample of 1 ml was centrifuged (2000 × g, 10 min, 4 °C) and the pellet was washed 2 times with 0.85% sodium chloride (2000 × g, 10 min, 4 °C). Finally, the bacterial pellet was suspended in 150 μl of LB medium supplemented with 10 mM CaCl2 and 10 mM MgSO4. Tested bacteriophages were added to the bacterial samples to an m.o.i. of 0.05, and these mixtures were incubated at 30 °C for 20 min. During incubation, the phage titer was determined at indicated times. Petri dishes were incubated at 37 °C for 18 h. A bacterial sample withdrawn immediately after addition of phage virions to bacterial host suspension (time 0) was considered as 100% of non-adsorbed bacteriophages and other values were calculated relative to them.
Bacteriophage infection procedure
Infection of host bacteria with tested phages was prepared according to the procedure described previously (Bloch et al. 2014). Briefly, E. coli MG1655 was grown in LB medium with aeration at 30 °C to OD600 of 0.3. After centrifugation of 120 ml of bacterial culture (2000 × g, 10 min, 4 °C), the obtained pellet was suspended in 36 ml of LB medium with 10 mM CaCl2 and 10 mM MgSO4. Then, phage lysate was added to the sample to an m.o.i. of 5. Following incubation on ice, infected host bacteria were cultivated with shaking at 30 °C. At indicated times, bacterial cells were harvested and treated with the killing buffer (200 mM NaN3, 50 mM MgCl2, 200 mM Tris-HCl; pH 8.0) to stop their growth. After centrifugation (2000 × g, 10 min, 4 °C), bacterial pellet was frozen in liquid nitrogen and then stored at −80 °C for further analysis.
Isolation of total RNA from bacterial cells for microarray analysis and RT-qPCR
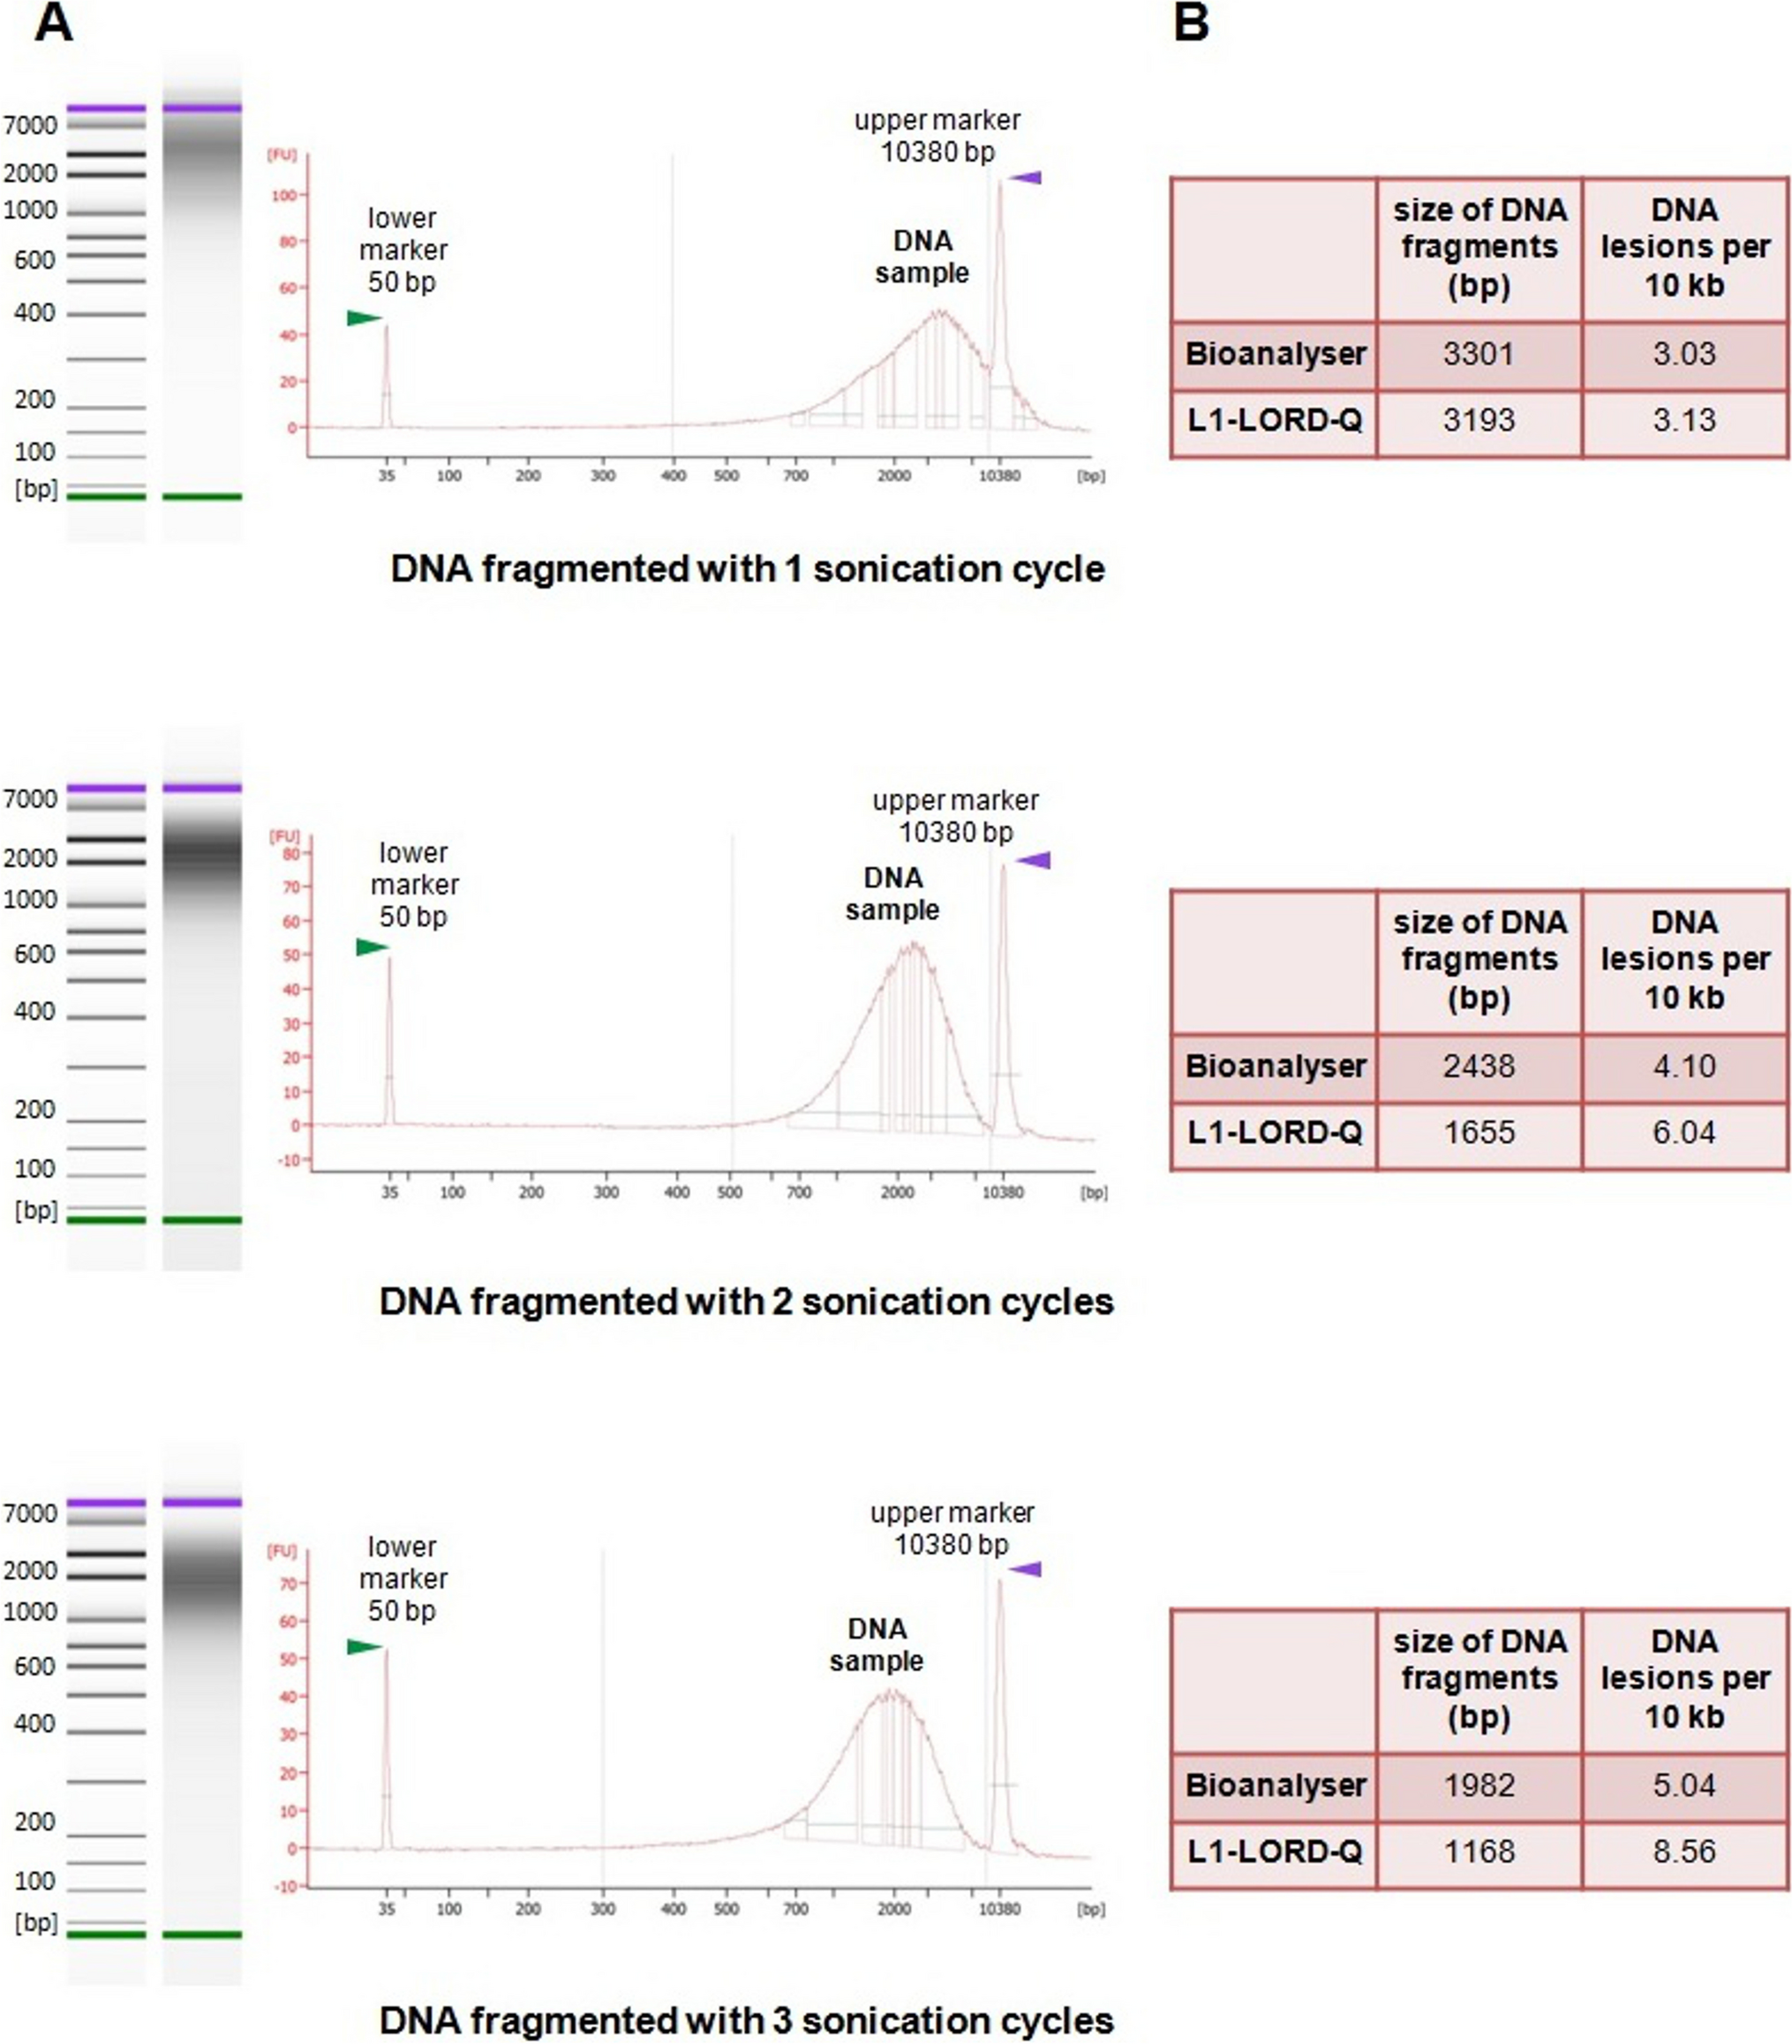
For microarray analysis, total RNA was isolated from 7.5 × 10⁸ bacterial cells harvested at 30 min after phage infection. RNA used for RT-qPCR was the same RNA sample as for the microarray analysis; however, to determine the expression patterns of particular genes during the infection process of host bacteria with tested phages, RNA was also extracted from cells at additional time points: 0, 7.5, 15, 45, and 60 min. Ribonucleic acids were isolated using the RNeasy Mini kit (Qiagen, Hilden, Germany). To remove DNA contaminants, the TURBO DNA-free™ Kit (Thermo Fischer Scientific, Waltham, MA, USA) was employed. The quality of the obtained RNA samples was tested with the Nano Chips RNA kit (Agilent Technologies, Santa Clara, CA, USA) using the Agilent 2100 Bioanalyzer System.
Microarray analysis
Gene expression microarray analyses were carried out commercially by the Agilent Technologies, Inc. (Santa Clara, CA, USA) using Agilent’s E. coli Microarray Kit 8x15K, P/N G4813A (Agilent Microarray Design ID 020097). Two-color (Cy3 and Cy5) RNA spike-ins were added to the RNA samples from the Two-Color RNA Spike-In kit (P/N 5188-5279). The labeling and hybridizations of target RNAs were performed by employing the Two-Color (Cy3 and Cy5) Low Input Quick Amp Gene expression kit and the Gene Expression Hybridization kit according to patented protocol of the Agilent Technologies, Inc. Each microarray was composed of 15,208 probes representing the complete genomes of four E. coli strains: K-12 MG1655, O157:H7 VT2-Sakai, CFT073, and EDL933 (Guernec et al. 2013). The biological replicates of prepared samples were randomly separated onto two microarray slides. The slides were scanned with the Agilent High Resolution C Scanner (G2656CA) according to the two-color microarray assay scanning protocol (Agilent Technologies, Inc.) and raw microarray image files were generated. Agilent Feature Extraction Image Analysis Software (Version 10.7.3) was involved to extract raw microarray data image files. The microarray data were analyzed for gene expression using the Gene Expression workflow in GeneSpring GX (Version 13.0) Software. Default flag settings were used to make the detection calls. Signal intensities for each probe were normalized to the 75th percentile without baseline transformation. Dye swap arrays were identified for the control vs. treated experiments. The software was used to visualize QC metrics, and the signal values were transferred to SpotFire for correlation analysis. Analysis was carried out an entity list consisting of “detected” probes only. The analysis was carried out using this filtered entity list, using a t-test unpaired statistical method with Benjamini Hochberg FDR method. The p-values were computed asymptotically. Statistical significance was assessed at FDR < 0.05 and p < 0.05.
Relative RT-qPCR and data analysis
Preparation of cDNAs from 1.25 μg of RNA samples for RT-qPCR was performed with Transcriptor Reverse Transcriptase (Roche Diagnostics International, Rotkreuz, Switzerland) and random hexamer primers (Roche Diagnostics International, Rotkreuz, Switzerland), according to the manufacturer’s instructions. All obtained cDNAs were 10-fold diluted in DEPC-treated water (Thermo Fischer Scientific, Waltham, MA, USA) and tested in RT-qPCR. Gene expression patterns were determined by RT-qPCR as described previously (Bloch et al. 2014). All experiments were performed by using the LightCycler® 480 Real-Time PCR System (Roche Diagnostics International, Rotkreuz, Switzerland). Each reaction mixture consisted of 2× SYBR Green I Master Mix, 6.25 ng/μl of cDNA, and 200-nM specific oligonucleotide primers. Amplification was performed according to following program: 95 °C for 5 min, 55 cycles of 95 °C for 10 s, 60 °C for 15 s, and 72 °C for 15 s. All primers (Table 2), amplifying 100–150 nt of target genes, were designed by Primer3web version 4.1.0 and synthetized by GENOMED S.A. (Warsaw, Poland). To confirm the specificity of created primers, melting curve for each product was analyzed. The housekeeping gene icdA was employed as a reference for normalization of samples. The samples harvested before addition of phage particles (time point 0) were applied as a calibrator. The relative changes in the level of gene expression were determined with LinRegPCR using the E-Method with efficiency correction (Bloch et al. 2014).
Table 2 Oligonucleotide primers used for RT-qPCRProteome analysis using two-dimensional electrophoresis (2D-PAGE)
Samples for proteomic analyses were prepared according to the manual provided by the Kendrick Laboratories (Madison, USA). Following 30-min incubation at 30 °C with tested bacteriophages, 5 × 10¹⁰ bacterial cells were harvested by centrifugation (4500 × g, 5 min, 4 °C). Then, bacterial pellet was deeply frozen in liquid nitrogen and washed 2 times (4500 × g, 5 min, 4 °C) with a buffer containing 10 mM Tris-HCl, pH 8.0 (Merck, Darmstadt, Germany), 1 mM KH2PO4 (Avantor Performance Materials Poland S.A., Gliwice, Poland), 68 mM NaCl (Chempur, Piekary Śląskie, Poland), and 9 mM NaH2PO4 (Avantor Performance Materials Poland S.A., Gliwice, Poland). Finally, the obtained bacterial pellet was resuspended in 1 ml of a buffer containing 10 mM Tris-HCl, pH 8.0, 1.5 mM MgCl2, 10 mM KCl (Chempur, Piekary Śląskie, Poland), 0.2% SDS (Merck, Darmstadt, Germany), supplemented with 1× Halt Protease Inhibitor Cocktail, EDTA-Free (Thermo Fisher Scientific Inc., Waltham, MA, USA). Cells were then disrupted by ultrasonication for 10 min in Omni-Ruptor 4000 apparatus (OMNI International, Kennesaw, USA), in an ice bath. In the next step, the mixture was incubated at 4 °C for 15 min with DNase (Merck, Darmstadt, Germany) and RNase (Merck, Darmstadt, Germany), added to the final concentration of 100 μg/ml and 50 μg/ml, respectively. Sample was diluted in the proportion 1:1 in boiling buffer containing 5% SDS (Merck, Darmstadt, Germany), 10% glycerol, and 60 mM Tris-HCl, pH 6.8, and then incubated at 95 °C for 10 min. The soluble protein fraction was separated from cell remnants by centrifugation (20,000 × g, 30 min, 20 °C). Afterward, the concentration of proteins was determined by using the Pierce™ BCA Protein Assay kit (Thermo Fisher Scientific Inc., Waltham, MA, USA) as recommended by the manufacturer. All prepared samples were deeply frozen in liquid nitrogen and analyzed commercially by the Kendrick Laboratories (Madison, USA).
Proteins that were separated by SDS-PAGE/2D-PAGE and stained by Coomassie dye were excised, washed, and the proteins from the gel were treated according to previously published protocols (Shevchenko et al. 1996; Darie et al. 2011; Sokolowska et al. 2012). Briefly, the gel pieces were washed in high-purity, high-performance liquid chromatography HPLC-grade water; dehydrated and cut into small pieces; and destained by incubating in 50 mM ammonium bicarbonate, 50 mM ammonium bicarbonate/50% acetonitrile, and 100% acetonitrile under moderate shaking, followed by drying in a speed-vac concentrator. The gel bands were then rehydrated with 50 mM ammonium bicarbonate. The procedure was repeated twice. The gel bands were then rehydrated in 50 mM ammonium bicarbonate containing 10 mM DTT and incubated at 56 °C for 45 min. The DTT solution was then replaced by 50 mM ammonium bicarbonate containing 100 mM iodoacetamide for 45 min in the dark, with occasional vortexing. The gel pieces were then re-incubated in 50 mM ammonium bicarbonate/50% acetonitrile, and 100% acetonitrile under moderate shaking, followed by drying in speed-vac concentrator. The dry gel pieces were then rehydrated using 50 mM ammonium bicarbonate containing 10 ng/μl trypsin, and incubated overnight at 37 °C with low-intensity shaking. The resulting peptides were extracted twice with 5% formic acid/50 mM ammonium bicarbonate/50% acetonitrile and once with 100% acetonitrile under moderate shaking. Peptide mixture was then dried in a speed-vac, solubilized in 20 μl of 0.1% formic acid/2% acetonitrile.
The peptide mixture was analyzed by reversed phase nanoliquid chromatography (LC) and MS (LC-MS/MS) using a NanoAcuity UPLC (Micromass/Waters, Milford, MA) coupled to a Q-TOF Xevo G2 mass spectrometer (Micromass/Waters, Milford, MA), according to published procedures (Shevchenko et al. 1996; Darie et al. 2011; Sokolowska et al. 2012). Briefly, the peptides were loaded onto a 100 μm × 10 mm NanoAquity BEH130 C18 1.7-μm UPLC column (Waters, Milford, MA) and eluted over a 60-min gradient of 2–80% organic solvent (ACN containing 0.1% FA) at a flow rate of 400 nl/min. The aqueous solvent was 0.1% FA in HPLC water. The column was coupled to a Picotip Emitter Silicatip nanoelectrospray needle (New Objective, Woburn, MA). MS data acquisition involved survey MS scans and automatic data-dependent analysis (DDA) of the top six ions with the highest-intensity ions with the charge of 2+, 3+, or 4+ ions. The MS/MS was triggered when the MS signal intensity exceeded 250 counts/s. In survey MS scans, the three most intense peaks were selected for collision-induced dissociation (CID) and fragmented until the total MS/MS ion counts reached 10,000 or for up to 6 s each. The entire procedure used was previously described (Shevchenko et al. 1996; Darie et al. 2011; Sokolowska et al. 2012). Calibration was performed for both precursor and product ions using 1-pmol GluFib (Glu1-Fibrinopeptide B) standard peptide with the sequence EGVNDNEEGFFSAR and the monoisotopic doubly-charged peak with m/z of 785.84. The raw data were processed using ProteinLynx Global Server (PLGS, version 2.4) software. The following parameters were used: background subtraction of polynomial order 5 adaptive with a threshold of 30%, two smoothings with a window of three channels in Savitzky-Golay mode, and centroid calculation of top 80% of peaks based on a minimum peak width of 4 channels at half height. The resulting pkl files were submitted for database search and protein identification to the in-house Mascot server (http://www.matrixscience.com, Matrix Science, London, UK) for database search using the following parameters: databases from NCBI (bacteria and viruses), parent mass error of 0.5 Da with 1 13C, product ion error of 0.8 Da, and enzyme used: trypsin, three missed cleavages, propionamide as cysteine fixed modification, and methionine oxidized as variable modification. To identify the false negative results, we used additional parameters such as different databases or organisms, a narrower error window for the parent mass error (1.2 and then 0.2 Da) and for the product ion error (0.6 Da), and up to two missed cleavage sites for trypsin. In addition, the pkl files were also searched against in-house PLGS database version 2.4 (http://www.waters.com) using searching parameters similar to the ones used for Mascot search. The Mascot and PLGS database search provided a list of proteins for each gel band. To eliminate false positive results, for the proteins identified by either one peptide or a mascot score lower than 25, we verified the MS/MS spectra that led to identification of a protein. Additionally, image analysis was performed with the use of the DECODON Delta 2D software, version 4.0 (DECODON), which is based on the dual-channel image analysis technique (Bernhardt et al. 1999).
Extraction and quantification of endogenous metabolites
Samples for endogenous metabolite analyses were prepared according to the procedure described for bacteriophage infection. Following 30-min incubation at 30 °C with tested bacteriophage, 1 × 10⁹ bacterial cells were harvested by centrifugation (2000 × g, 10 min, 4 °C). To release metabolites from E. coli cells, the cold methanol extraction method (Maharjan and Ferenci 2003) was used with some modifications. Briefly, the obtained pellet was suspended in 1 ml of 50% cold (−20 °C) methanol (Merck, Darmstadt, Germany). After rapid mixing, the sample was frozen in liquid nitrogen, and then thawed on a dry ice. The freeze-thaw cycle was performed 3 times in order to permeabilize the cells, and then the mixture was centrifuged (16,000 × g, 10 min, 4 °C). The supernatant was transferred to a new tube and stored in dry ice. The pellet was suspended in 0.5 ml of 50% cold (−20 °C) methanol, intensively mixed, frozen in liquid nitrogen, and then thawed on a dry ice. The procedure of freeze-thawing was repeated 3 times. Following the centrifugation (16,000 × g, 10 min, 4 °C), the first and second extracts were combined in a new tube. Finally, the samples were concentrated for 4–6 h in the vacuum centrifugation at 30 °C to approximately 40 μl. Finally, samples from three biological replicates were pooled into two groups.
Absolute IDQ® p180 kit plates (Biocrates Life Science, Innsbruck, Austria) were used for the quantification of amino acids, biogenic amines, acylcarnitines, and hexoses in prepared samples. The analysis has been carried out commercially by Biocrates Life Science (Innsbruck, Austria). The fully automated assay was based on phenylisothiocyanate (PITC) derivatization in the presence of internal standards, followed by flow injection analysis-tandem mass spectrometry (FIA-MS/MS; for the analysis of acylcarnitines and hexoses) and liquid chromatography-tandem mass spectrometry (LC-MS/MS; for the analysis of amino acids and biogenic amines) using 4000 QTRAP® (AB Sciex, Darmstadt, Germany) and a Xevo TQ-S micro (Waters, Vienna, Austria) instrument with an electrospray ionization (ESI) source. The experimental metabolomic measurement technique was described previously (Ramsay et al. 2005a, 2005b). Data were quantified using a mass spectrometry software (Sciex Analyst® and Waters MassLynx™) and imported into Biocrates MetIDQ™ software for further analysis.
Statistical analyses
Each experiment was repeated 3 or 4 times. Variation among biological replicates was presented as error bars indicating the standard deviation (SD). Comparison of two average values was performed by using Student’s t-test and the significance differences were marked by asterisks as follows: p < 0.05 (*), p < 0.01 (**), or p < 0.001 (***).
Data availability
Row data of transcriptomic (microarray), proteomic, and metabolomic analyses are presented in the supplementary materials, as Table S1, Table S2, and Table S3, respectively.


留言 (0)