
記住我


Aggression is commonly defined as deliberate behavior aimed at causing harm to another person who seeks to avoid such action, including physical or psychological injury (1). It is more explicitly defined as “any behavior directed towards another individual that is carried out with the immediate purpose of causing harm” to better distinguish between particular subtypes (2). Specifically, aggression refers to observable behavior that is intentional and carried out with the intent of causing harm to another individual. It involves interactions between people, not inanimate objects, and the victim must be motivated to evade harm. As one of the most pervasive and destructive issues, aggression is widespread worldwide, affecting individuals and society. At the individual level, aggression puts victims in danger of posttraumatic stress disorder (PTSD), anxiety, depression, substance abuse, and even suicide (3). Health care workers also experience anger, anxiety, and higher levels of burnout after aggressive incidents (4). Aggressive behavior detrimentally affects the physical and mental health, academic success, personality development, and social adjustment of adolescents (5). At the societal level, aggressive behavior presents a seriously prevalent problem. For example, in the period from 2018 to 2019, there were a total of 28,372 homicides among US residents (6). In Mexico, the homicide rates in 2019 were 16.68 homicides per 100,000 women and 67.41 homicides per 100,000 men (7). According to the World Health Organization, homicide is expected to claim more lives than diseases, such as Alzheimer disease and breast cancer, in 2030 (8). Violence also imposes significant economic costs because it necessitates the allocation of manpower and financial resources to alleviate or address its consequences when it occurs. The estimated societal and economic damage caused by violent behavior in 2015 amounted to approximately 20.4 billion euros in the Netherlands alone (9).
As a complex psychological and social phenomenon, human aggression is affected by a wide range of causes (10), including personality traits, temper (11), or the environment (12). Its mechanisms have been thoroughly investigated regarding biological (13), psychological (14), and social variables (12). Within the realm of physiological mechanisms, hormones, particularly sex steroid hormones, such as androgens (15) and estrogens (16), have been identified as crucial players in influencing human aggression. Although the relationship between testosterone and aggression in humans has been extensively investigated (17,18), with a meta-analysis revealing a small but significant association between the two (19), there has been comparatively less research conducted on estradiol, which is the most abundant and predominant circulating estrogen in humans (20).
Estrogens, a vital class of sex steroid hormones derived from precursor cholesterol, consist mainly of estrone (E1), estradiol (E2), estriol (E3), and estretrol (E4). They exert a significant influence on human physiology throughout all stages of life. Among these, E1 is typically found at elevated levels during menopause, whereas E3 and E4 are primarily present during pregnancy in female individuals (20). In addition, as the most potent bioactive estrogen, E2 is primarily synthesized from testosterone in the ovarian follicles in female individuals, whereas in male individuals, it is produced by the testes and extraglandular conversion of androgens (21). Plasma E2 concentrations elevate early in puberty, continue to increase linearly throughout the pubertal period, fluctuate during the menstrual cycle, and undergo a sharp decline with menopause in women (22). In men, E2 levels remain relatively stable across the life course (23). E2 exhibits significant neuroprotective effects (24) and can freely cross the blood-brain barrier to affect the central nervous system, participating in the regulation of emotional processing, cognitive performance, and social behavior states, including aggression (25,26) Moreover, the biological effects of E2 are mediated through estrogen receptor subtypes α and β, primarily located in the limbic areas of the brain, including the cingulate gyrus, hippocampus, amygdala, hypothalamus, and prefrontal cortex (27), which have been shown to be responsible for the occurrence of the rage reactions when stimulated (28).
Despite the biological expectations, the relationship between E2 and human aggression remains elusive because of inconsistent findings in published studies. Some authors have reported a positive relationship between E2 levels and aggressive behavior in boys and girls (29). Others have found this correlation only in girls (30), which aligns with the conclusions of another study showing a positive relationship between high E2 levels and aggression in prepubescent girls, whose aggression levels resemble those of their male peers (31). However, there is a study that suggests a contrasting result, indicating a positive relationship between estradiol levels and aggression in men but a negative relationship in women (32). On the other hand, a longitudinal study of children has reported that boys who exhibit the greatest increase in aggression from ages 8 to 10 years also experience the greatest decline in E2 levels (33). In addition, some studies have found a curvilinear relationship between them (34). Overall, the inconsistency of existing findings makes it challenging to establish a definitive and conclusive relationship between E2 and human aggression. Further research is needed to clarify these discrepancies and gain a better understanding of the complex interplay between them.
To analyze the relationship between estradiol and aggression accurately, in addition to the overall meta-analysis, seven study characteristics were tested on their potential influence on the overall effect size. These characteristics included participants’ sex, age, methods of sampling, time of sampling, the measures of aggression, sample size, and literature quality. First, it is important to acknowledge potential sex differences, as previous evidence suggests that the relationship between hormones and aggression may vary between girls and boys (35). However, the exact impact of these differences on the effect size remains uncertain. Second, age differences should be taken into account. E2 levels and aggression levels undergo changes throughout development. For instance, in women, plasma E2 levels rise during early puberty and decline significantly during menopause (22), whereas they remain largely unchanged in men (23). Besides, the age-aggression curve for violent offenses typically starts during preadolescence, peaks during adolescence, and then modestly declines (36). Third, the methods of sampling can potentially influence the effect size. Although blood-derived sampling is considered the criterion standard for quantifying E2 levels owing to its accuracy (37), salivary-derived sampling is a feasible and convenient alternative for monitoring E2 levels (38). The accuracy discrepancy between them should be considered as a potential influencing factor. Fourth, the time of sampling is another crucial factor. Because E2 concentrations are subject to endogenous circadian regulation (39), fluctuating from hour to hour in the peripheral blood of women (40), the sampling time may impact the effect size. Fifth, there are reasons to believe that the measures of aggression might contribute to variations in results, as it is reported that different tools used to assess aggression may yield different outcomes (41). Lastly, both sample size and literature quality might influence the effect size. Studies with larger sample sizes enhance statistical power and generalizability. Moreover, the quality of the literature assessed, as higher-quality articles provide more reliable conclusions (42), was also examined for its impact on the overall effect size. By considering these seven study characteristics, we aimed to comprehensively assess the potential influences on the relationship between E2 and human aggression.
In summary, the relationship between E2 and human aggression remains poorly understood and elusive because of inconsistent outcomes in the existing literature. To address this gap, we conducted a meta-analysis to offer a comprehensive and quantitative overview that identifies the overall causal effect of estradiol on human aggression. By synthesizing the available evidence, we aimed to contribute to a better understanding of this complex relationship.
METHODSThis meta-analysis was conducted according to the Preferred Reporting Items for Systematic Reviews and Meta-Analyses guidelines (43).
Search StrategyA comprehensive literature search was conducted to identify relevant studies for our meta-analysis. The search covered five databases, including PubMed, Web of Science, EMBASE, Cochrane Library, and CINAHL, from their inception until June 5, 2023. See the Supplemental Digital Content, https://links.lww.com/PSYMED/A967, for a detailed keyword strategy. Furthermore, the reference lists of the included articles were examined to identify any additional relevant studies that may have been missed in the initial search.
Inclusion CriteriaInclusion criteria were as follows: a) studies investigating the relationship between estradiol and aggression; b) studies with cross-sectional, case-control, or longitudinal design (using baseline data) in humans; c) studies reporting data on the correlation between the estradiol and aggression, including Spearman or Pearson correlation coefficient (r) and/or mean (standard deviation)/median (interquartile range)/median (range)/mean (range) of the hormone level for all participants; d) studies measuring estradiol and aggression with validated assessment tools, such as the Direct and Indirect Aggression Scale (DIAS) and the enzyme-linked immunosorbent assay technique (Salimetrics, State College, Pennsylvania); and e) studies published in English.
Exclusion CriteriaExclusion criteria were as follows: a) meta-analyses, reviews, case reports, qualitative studies, meeting or conference abstracts, comments, or editorial letters; b) nonhuman investigation; c) studies without full-text availability; d) duplicated articles and repetitive data (if the same sample from the same unit was used in multiple articles, the most recently published article was chosen to avoid redundancy); and e) studies with ambiguous or unclear data descriptions that made it difficult to extract relevant information.
Data Extraction and Quality AssessmentThe literature screening and data extraction process were conducted by two authors (Y.W. and W.Y.). They independently reviewed the titles and abstracts of the identified studies, and full-text reviews were conducted when necessary. After confirming the inclusion of a study, data were independently extracted by both authors. The extracted data included information such as the first author, year of publication, country, sample size, sex, age, control of the cycle, method of sampling, time of sampling, measure of aggression, mean (standard deviation)/median (interquartile range)/median (range)/mean (range) of E2 and aggression, and Pearson or Spearman correlation coefficient (r) between E2 and human aggression.
The Agency for Healthcare Research and Quality (AHRQ) guidelines were used for the assessment of literature quality (44). The evaluation criteria consisted of 11 items, each with the options “yes,” “no,” or “unclear” as answers. If the answer was “no” or “unclear,” the item was assigned a score of “0,” and if the answer was “yes,” the item was assigned a score of “1.” This resulted in a total score range of 0 to 11. Literature with a score of 8 to 11 was considered high-quality, 4 to 7 as medium-quality, and 0 to 3 as low-quality. In cases of any disagreement between the two authors (Y.W. and W.Y.), a third author (J.C. or H.W.) facilitated discussion and provided adjudication to resolve.
Statistical AnalysisThe meta-analysis was conducted using Review Manager software (version 5.4) (45). Given the high heterogeneity (I2 > 50%) observed across studies, the random-effects model was used to synthesize the correlation coefficients (r) and continuous variables.
For correlation coefficients (r), Spearman r values were initially converted to Pearson r (46). Subsequently, Fisher exact test r-to-z transformation was used to calculate the pooled estimate of Pearson r. Because the variance of r strongly depends on r itself (47), it was transformed into Fisher z using the following formula (48):
Z=0.5×ln1+r1−r
The variance of Fisher z was calculated using the following equation (49):
VZ=1n−3
Because Fisher z was more challenging to interpret than the correlation, it was transformed back into r for reporting (47). Therefore, Fisher z was used in the analyses, whereas the correlation was reported. It was followed to interpret the correlation effect sizes, with values of 0.10, 0.30, and 0.50 indicating small, medium, and large effect sizes, respectively (50).
We also did subgroup analysis to explore sources of heterogeneity based on the following factors: a) sex (man, woman), b) age (adolescence, adulthood), c) sample size (<100, ≥100), d) methods of sampling (saliva, blood), e) time of sampling (morning, afternoon), f) measurements of aggression (e.g., Buss and Durkee Hostility Inventor [BDHI], DIAS, Olweus Multifaceted Aggression Inventory [OMAI], and others), and g) score of quality assessment of included studies (score ≥8, <8).
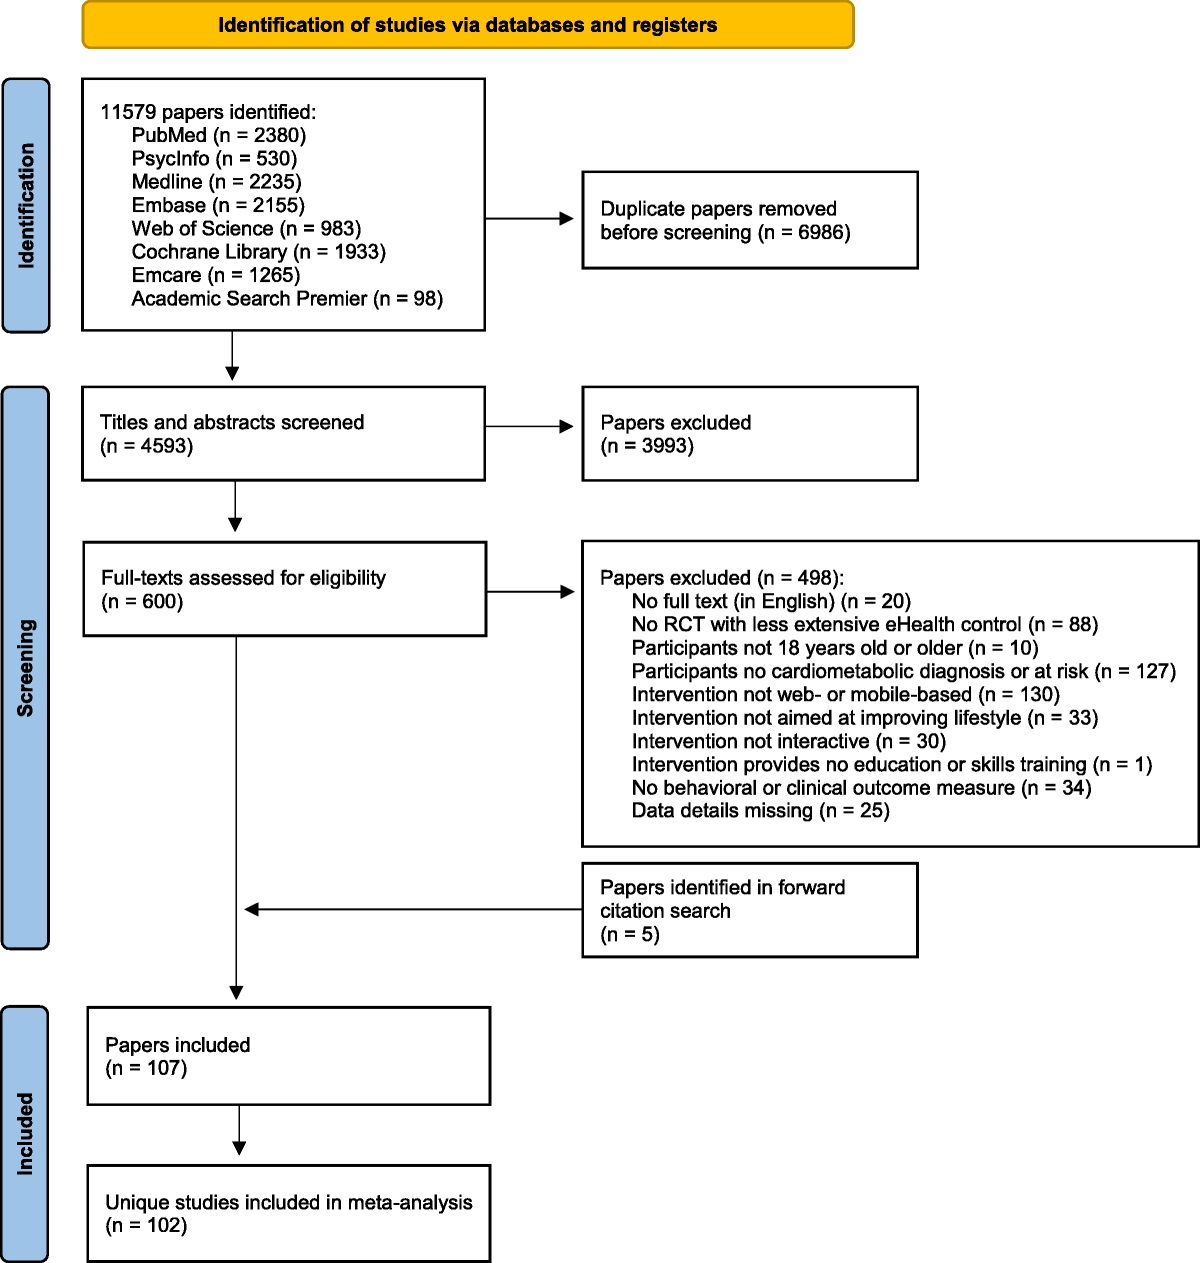
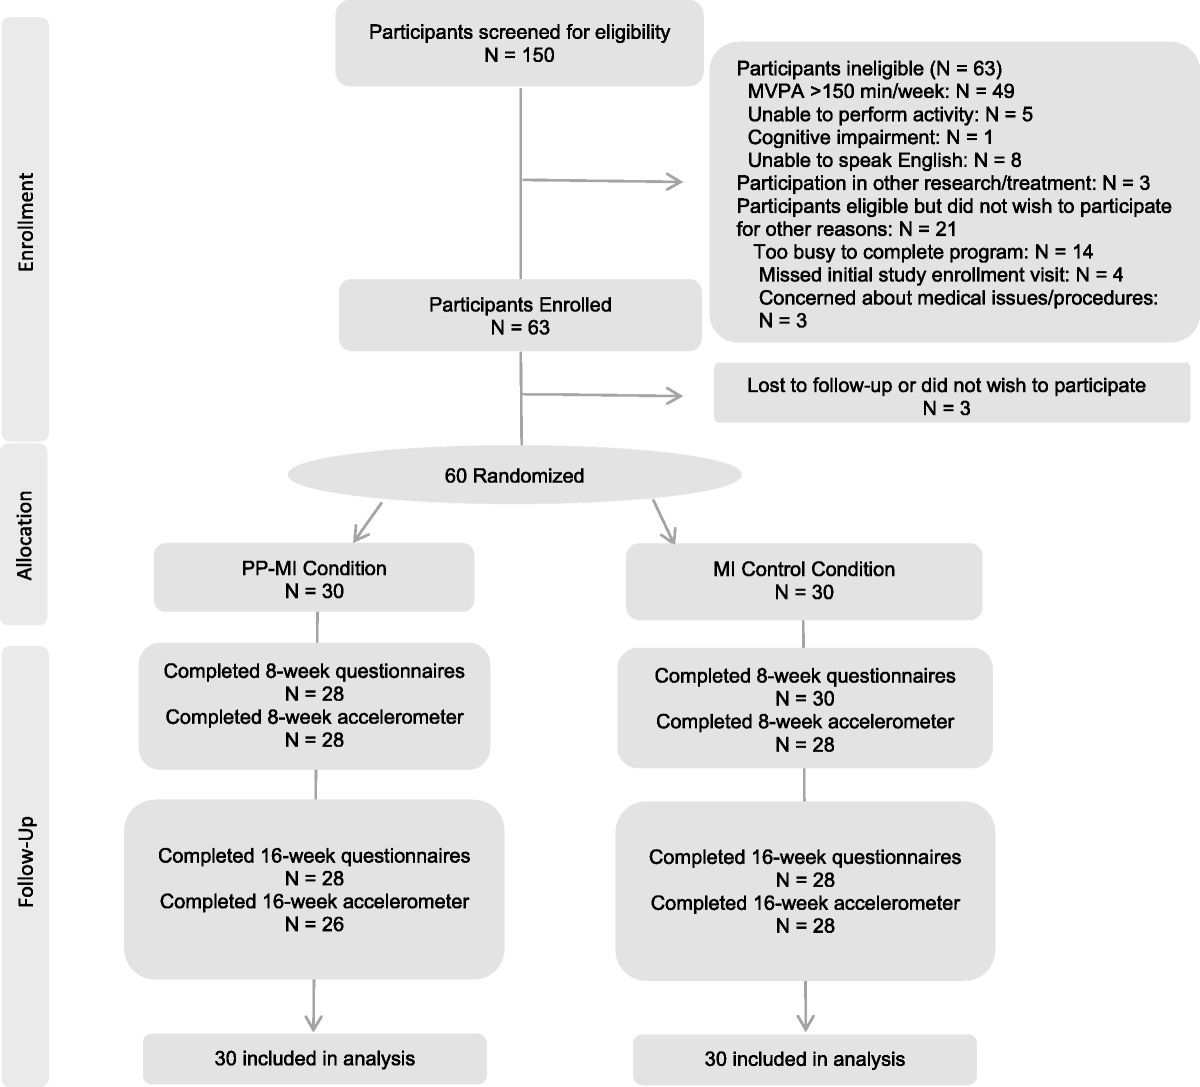
RESULTS Study SelectionA total of 2385 records were initially identified from the five databases searched. After removing duplicates, there were 1746 studies remaining for screening. Upon reviewing the titles and abstracts, two authors excluded 1719 studies, resulting in 27 studies eligible for full-text review. Finally, based on the inclusion and exclusion criteria, 14 studies were included in the quantitative analysis. Figure 1 shows the flowchart of the study selection process.
 FIGURE 1:
 Flowchart of article selection. CINAHL = Cumulative Index to Nursing and Allied Health Literature.
Study CharacteristicsTable 1 displays study characteristics. We included 14 studies involving 1820 participants, published between 1991 and 2019. A majority of the studies were conducted in America (n = 3) (32,60,61), followed by Belgium (n = 2) (52,56) and Spain (n = 2) (54,58). Only one study was performed in Canada (51), Austria (53), the Netherlands (55), Germany (57), Finland (59), Ukraine (63), and Italy (62). Hormone concentration was measured using blood samples in nine articles, whereas saliva samples were used in five articles. Aggression was assessed using various methods, including the BDHI, the DIAS, the OMAI, a Dutch language self-report instrument, and others. Seven studies had large sample sizes (≥100 cases), and seven studies had small sample sizes (<100 cases). After assessment by the AHRQ, nine studies were deemed medium-quality (AHRQ score ≥4 points), and five studies were considered high-quality (AHRQ score ≥8 points). All studies included in the analysis were cross-sectional. Table 2 presents the quality assessment of the included studies.
TABLE 1 - Study Characteristics for All Included Articles Study Country N (Men, Women) Age, y Control of Cycle Method of Sampling Time of Sampling Results of Estradiol, pg/ml Measure of Aggression Results of Aggression r Geniole et al. (51) Canada 201 (104, 97) 20.0 (2.5) NA Saliva samples Between 12:00 pm and 6:00 pm Baseline:N = sample size; NA = not available; M = man; W = woman; PSAP = Point Subtraction Aggression Paradigm; TE2 = total estradiol; FE2 = free estradiol; NART = nonaggressive risk-taking; ART = aggressive risk-taking; BDHI = Buss and Durkee Hostility Inventory; BPAQ = Buss Perry Aggression Questionnaire; DIAS = Direct and Indirect Aggression Scale; HT = heterosexual; HS = homosexual; CTS2 = Conflict Tactics Scale; YSR, Youth Self-Report; PRF, Personality Research Form.
Values were mean (standard deviation) or median (standard deviation).
1. Define the source of information (survey, record review).
2. List inclusion and exclusion criteria for exposed and unexposed subjects (cases and controls) or refer to previous publications.
3. Indicate the period used for identifying patients.
4. Indicate whether or not subjects were consecutive if not population based.
5. Indicate if evaluators of subjective components of the study were masked to other aspects of the status of the participants.
6. Describe assessments undertaken for quality assurance purposes (e.g., test/retest of primary outcome measurements).
7. Explain any patient exclusions from the analysis.
8. Describe how confounding was assessed and/or controlled.
9. If applicable, explain how missing data were handled in the analysis.
10. Summarize patient response rates and the completeness of data collection.
11. Clarify what follow-up, if any, was expected and the percentage of patients for which incomplete data or follow-up was obtained.
Figure 2 demonstrates that 14 studies reported the correlation (r) between E2 and human aggression, with two of the studies providing separate correlations for men and women (32,58). The correlation coefficients (r) ranged from −0.37 to 0.75, and the pooled Fisher z value was calculated as 0.16 (95% confidence interval = 0.05–0.26; I2
留言 (0)