
記住我


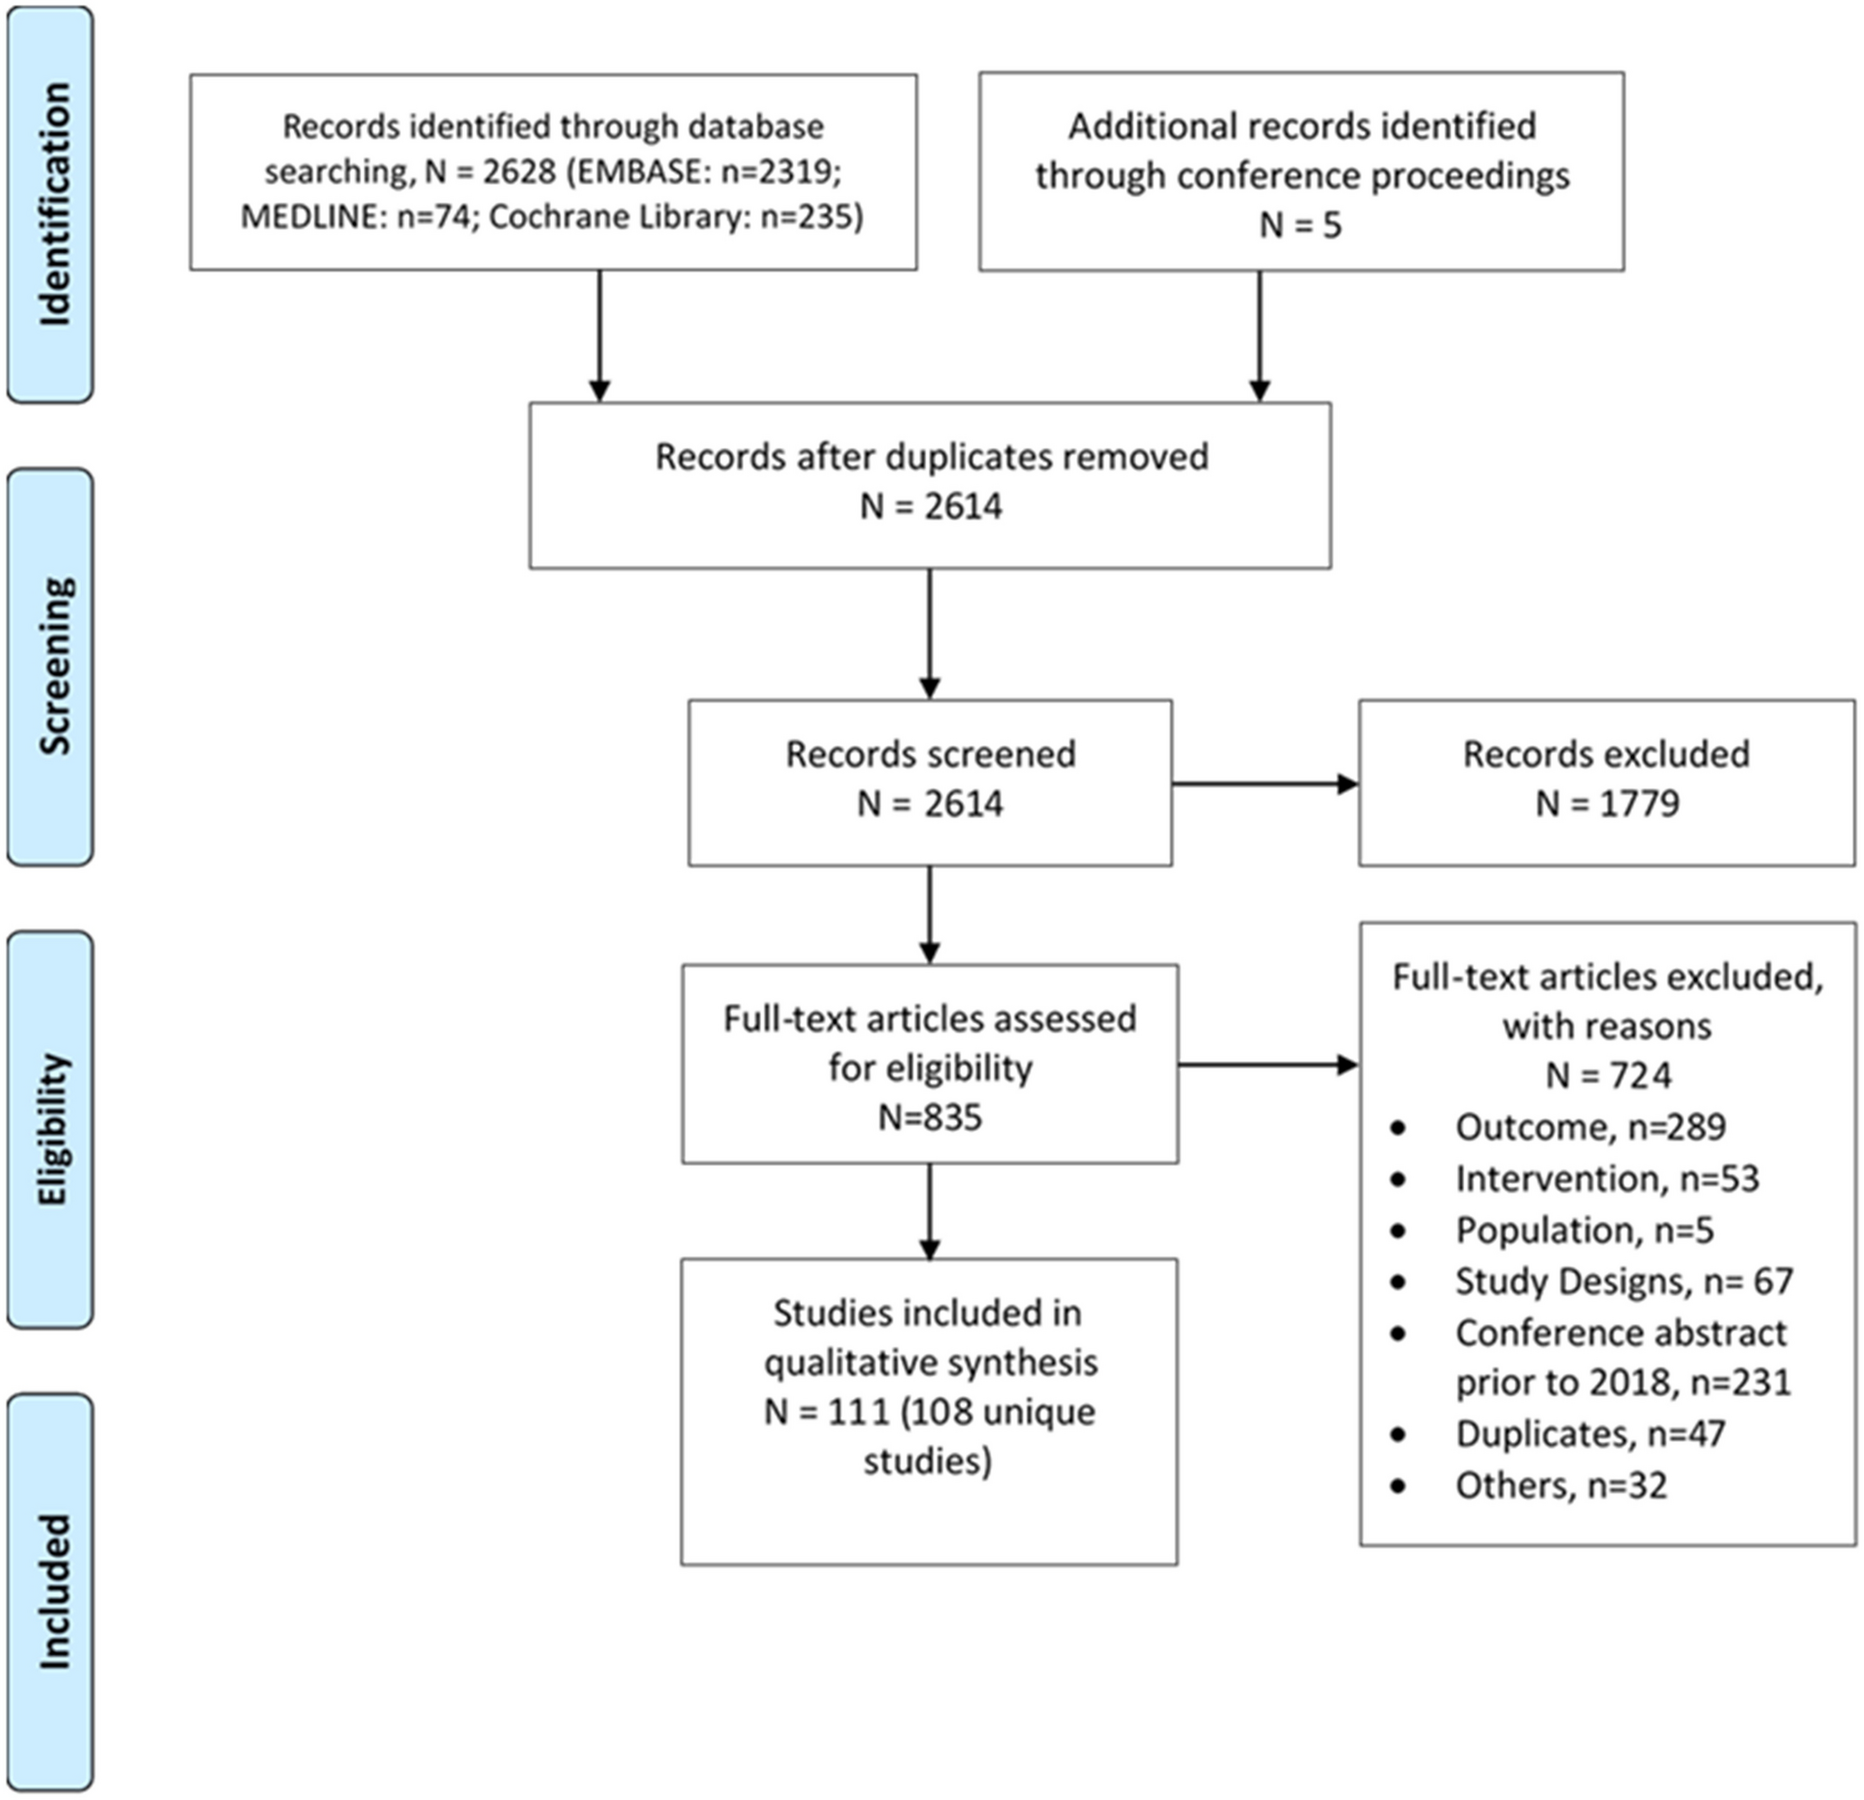
The literature search and screening process is illustrated in Fig. 1. A total of 718 articles were retrieved from the literature, and after removal of duplicate articles (n = 38), 615 were excluded during the title and abstract screening. Following full-text screening, an additional 53 articles were excluded. Ultimately, 12 studies met the inclusion criteria and were included in this systematic review.
Fig. 1
Flowchart following the PRISMA statement. CNKI China National Knowledge Infrastructure, NIHR The National Institute for Health and Care Research, HTA International Health Technology Assessment
Quality of ReportingQuality assessment of the included studies is shown in Fig. 2. The overall quality of the studies was modest, with a mean quality score of 19.8 (Supplementary Table S3). Most of the studies (7/12, 58.3%) were rated as moderate quality [15,16,17,18,19,20,21], only four studies were ranked as high quality (4/12, 33.3%) [22,23,24,25], and one was poor quality [26].
Fig. 2
Quality assessment following the CHEERS 2022 checklist. The CHEERS 2022 statement includes 28 items that were rated as “Yes” (fully met), “Partly” (partly met), or “NA” (not applicable)
According to the CHEERS 2022 evaluation standard, the average score for each item was 0.71. Five evaluation items fully satisfied the checklist, including item 3 (Background and objectives), item 6 (Setting and location), item 7 (Comparators), item 9 (Time horizon), item 11 (Selection of outcomes), and item 23 (Summary of main results). However, there were three quality assessment items that no study met: item 19 (Characterizing distributional effects), item 21 (Approach to engagement with patients and others affected by the study), and item 25 (Effect of engagement with patients and others affected by the study).
Characteristics of Included StudiesThe characteristics of the included studies are summarized in Table 1.
Table 1 Characteristic of eligible studiesStudy TypeThe studies included in the review included CUA and CEA. Five studies (41.7%) conducted CUA with cost and QALYs as the outcome measures [15, 18, 20, 21, 26], while seven studies (7/12, 58.3%) performed CEA [16, 17, 19, 22,23,24,25].
Setting and LocationFive studies were in a primary healthcare setting [17, 18, 20, 22, 24], and two were in a tertiary healthcare [16, 26]. Two studies were performed in the US Veterans Affairs Health System [19, 23], and two were in the community pharmacies [15, 25]. One study did not specify its setting [21].
Six studies were conducted in high-income countries (Australia [15], USA [19, 22, 23], Canada [18], Singapore [20]), three were in upper-middle-income countries (Brazil [17], Malaysia [24], China [26]), and three in lower-middle-income countries (Nigeria [16], Jordan [21], Iran [25]).
PerspectiveFrom the perspective of economic analysis design, the payer perspective was most commonly used (3/12, 25%) [18, 21, 22, 25], and other perspectives included those of the healthcare system (2/12, 16.7%) [15, 17], healthcare providers (2/12, 16.7%) [20, 24], and patients (1/12, 8.3%) [16]. One study used multiple perspectives, including those of the healthcare system, healthcare providers, and payers [23], while two studies did not specify any perspective [19, 26].
Study DesignSeven studies were designed as RCTs, four of which were multicenter [15,16,17,18], and two were single-center [24, 26]. The remaining three were retrospective cohorts [19, 22, 23], and two were based on published literature [21, 25]. Half of the studies (6/12, 50%) used models to simulate long-term outcomes; four were based on Markov models [21, 22, 24, 25], and two on Archimedes models [19, 23].
Sensitivity AnalysisSensitivity analyses were conducted in all articles except for two [17, 26]. Four of these studies exclusively performed deterministic sensitivity analysis (DSA) [15, 19] or probabilistic sensitivity analysis (PSA) [18, 20], while the remaining six studies employed both DSA and PSA [16, 21,22,23,24,25]. Regarding the DSA variables mentioned above, all studies included the cost of pharmacist intervention. Nevertheless, only three studies performed DSA on indicators of intervention effectiveness [19, 23, 25].
CostNone of the studies included a social perspective, leading to the exclusion of indirect costs due to productivity loss. Direct medical costs reported mainly comprised pharmaceutical care, healthcare resources, medications, laboratory tests, and diabetic complications.
The cost of pharmaceutical care was considered by most of the included studies (11/12, 91.7%), except for one study [16] (Table 2). Half of these studies were estimated by labor costs, which refers to the remuneration for pharmacists providing pharmaceutical care. Labor costs were calculated by multiplying the pharmacist’s hourly wage by the number of hours. However, there was a significant disparity in hourly wages for pharmacists across countries. Upon converting the reported wages to 2023 US dollars (USD), the hourly wages for pharmacists ranged from 48.9 to 71.5 USD per hour in high-income countries such as Australia, Canada, and the USA [15, 18, 22], while it was only 6.3 USD per hour in upper-middle-income countries like Malaysia [24]. The other two studies from China [26] and the USA [19] did not report specific wages.
Table 2 Cost components of eligible studiesBesides, some studies used either the cost of a single visit by a pharmacist or the hourly cost of pharmacist visits as indicators for estimating the cost of pharmacist-led interventions. In Singapore, the cost of the pharmacist-led intervention was 7.5–14.1 USD per visit [20]; in Jordan and the USA, it was 25.2–67.3 USD per hour [21] and 77.7 USD per hour [23], respectively. The Iranian study did not disclose the specific fees charged for pharmacist services [25]. A study from Brazil showed that the average cost per patient for a pharmacist appointment was 3.9 USD (undiscounted) [17].
There were six long-term studies based on model simulations that included complication costs. Of these studies, three considered only coronary heart disease and stroke [21, 22, 24], while the remaining three employed Archimedes modeling to consider common macrovascular and microvascular complications of diabetes [19, 23, 25].
EffectivenessHemoglobin A1c (HbA1c) was the commonly used effectiveness measurement to evaluate the cost-effectiveness of pharmacist-led interventions in diabetes (Table 3). Short-term studies (less than 1 year) have shown that the pharmacist-led care group exhibited a significantly greater improvement in HbA1c levels compared to the standard care group (mean difference 0.43%, 95% CI 0.34–0.52) [15]. This intervention not only resulted in a higher proportion of patients achieving HbA1c improvement (HbA1c reduction ≥ 0.1% from baseline) [20] but also achieved higher rates of HbA1c compliance (49.53% vs 72.88%, p < 0.01) [26].
Table 3 Base case analysis of eligible studiesThe other two studies utilized LYG and predicted 10-year cardiovascular disease risk [calculated using the United Kingdom Prospective Diabetes Study (UKPDS) Risk Engine] as the measure of long-term effect in the cost-effectiveness analysis, respectively. Pharmacist-led care resulted in a statistically significa
留言 (0)