Study design and participants
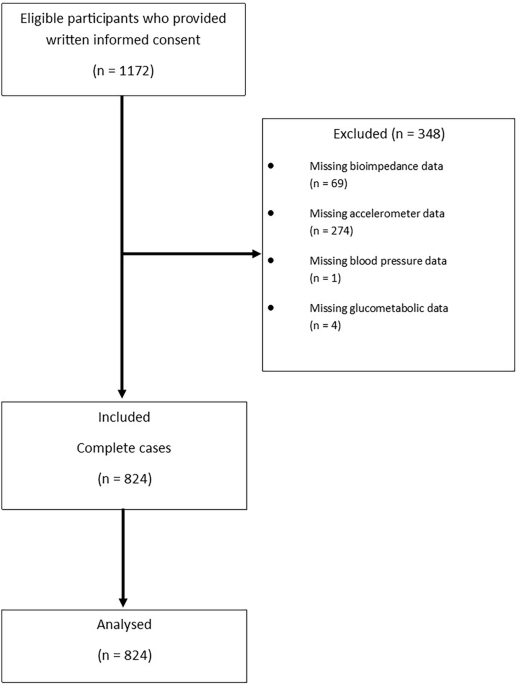
The current study is a post-hoc, secondary analysis of data from the PERHIT study. In the PERHIT trial, the effect of using an interactive web-based system for self-management of hypertension in primary health care was evaluated [17]. In total, 949 patients with hypertension were included. Details of the trial have previously been published [18, 19]. In brief, the trial was conducted at 31 primary health care centres in southern Sweden. The patients were informed about the study by their nurse or physician, or through posters in the waiting areas at the primary health care centre. If eligible and willing to participate, the patients were randomised 1:1 to the intervention or control group, respectively. Inclusion criteria were Swedish-speaking adult patients with a diagnosis of hypertension and treatment with at least one antihypertensive drug, regardless of BP level. The participants took part in a baseline clinical assessment and returned for a follow-up visit after eight weeks and 12 months. Baseline and follow-up visits included measurement of BP (mmHg), heart rate (beats/min), height (m), weight (kg), and blood tests (total cholesterol, creatinine, HbA1c and cystatin C). The participants also filled out different questionnaires about demographic details, medication beliefs and adherence, participation in care, quality of life, and self-efficacy.
The participants in the intervention group of the PERHIT study received a BP monitor and installed a program called CQ (developed by Circadian Questions AB, Sweden) on their mobile phone. For eight consecutive weeks, patients in the intervention group measured their BP and heart rate every evening and reported their values in their mobile phone. They also reported lifestyle factors such as physical activity, stress, well-being, and hypertension-related factors, such as medication intake, side effects, and symptoms. The reported values were stored in a secure database, and by logging into a webpage the participants could get visual feedback of their reported values as graphs. The participating primary care physicians and nurses were encouraged to view and discuss the visual feedback together with the patient at the follow-up visit after eight weeks.
Blood pressure measurement
The office BP was measured by the patient’s nurse or physician during the visits to the primary health care centre. The involved professionals had been instructed by the research team to ensure a standardized measurement technique. The office BP was measured with the patient in a sitting position and the mean of three consecutive measurements (mmHg) was recorded. A validated BP monitor (Microlife BP A6 BT, Switzerland) was used, and the patients were given the same type of monitor for home use during the intervention period.
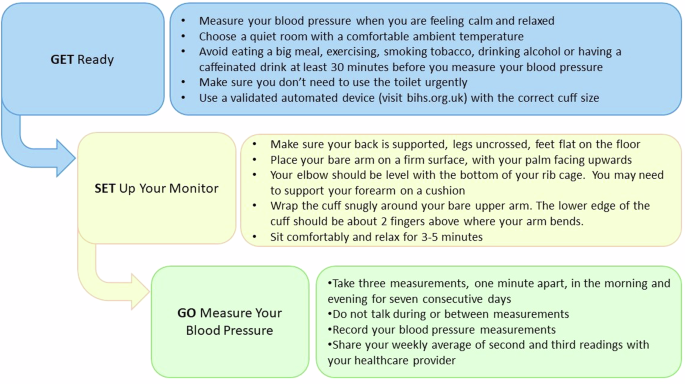
The participants were instructed on BP measurement techniques to apply at home and had access to supporting instructive video films on the study web page.
Blood pressure variability
There is no consensus regarding the preferred index for day-to-day BPV, but since BPV is strongly related to average BP level, it is recommended to incorporate mean BP [1, 5]. Standard deviation (SD) is commonly used, though it does not adjust for mean BP, thus is not recommend as a sole index. Coefficient of variation (CV) is the extent or variability in relation to the mean, expressed as SD/mean * 100. It is easily calculated and adjusts to some extent for mean BP level, but there can still be a correlation. To minimize correlation with mean BP, variation independent of the mean (VIM) was created. VIM is calculated with the formula SD/meanx, where x is obtained by a fitting curve through a plot of SD against mean using the model SD = a*meanX [20]. VIM is impractical to use in a clinical setting since it is derived from the distribution of BP in the given population and cannot be compared across populations. Average real variability (ARV) is the average absolute difference between consecutive BP readings and has the advantage of considering the sequential order of BP readings [21].
Statistical analysis
In this study, CV of home systolic BP was chosen as the primary parameter. Results for SD, VIM and ARV are also reported.
Participants were stratified according to fifths of CV of home systolic BP. Continuous variables are presented as means with standard deviations, and categorical variables as number and percentage.
We tested for a linear trend in the baseline characteristics by fitting the baseline characteristics as the dependent variable in a linear regression for continuous variables or a logistic regression for categorical variables, with the fifths of BPV as a continuous independent variable. The trend analysis was adjusted for age and sex.
Self-reported variables including lifestyle factors and symptoms from the CQ system are presented as the mean (SD) of the individuals mean of up to 57 consecutive readings. As for the baseline data, the self-reported variables were tested for a linear trend by fitting the self-reported variables as the dependent variable in a linear regression for continuous variables, or a logistic regression for categorical variables with the fifths of BPV as a continuous independent variable. The analysis was also adjusted for age and sex.
Pulse pressure and eGFR were used as indicators of TOD. Estimated glomerular filtration rate was calculated from baseline creatinine and cystatin C using the CAPA and LMrev equations, and the average value of the two equations was used as eGFR [22]. The LMrev and CAPA equations were chosen as they are developed in a Swedish population and have been shown to outperform other GFR estimations in similar settings [23]. Pulse pressure was calculated by subtracting the patients´ daily reported diastolic BP from the daily reported systolic BP. To test if there was a significant association between BPV and pulse pressure and eGFR, a linear regression analysis was conducted with the CV of SBP used as a continuous dependent variable and the pulse pressure and eGFR as independent variables, respectively. The model was adjusted for age, sex, smoking, BMI, cholesterol level, HbA1c, reported alcohol consumption at baseline and mean physical activity. The linear regression model for eGFR was also adjusted for baseline SBP. As pulse pressure is derived from SBP and DBP, the model for pulse pressure was not adjusted for SBP.
The association of CV of SBP and pulse pressure was also analysed in subgroups of participants based on antihypertensive treatment, with CV of SBP as a dependent variable and pulse pressure as an independent variable, adjusted for age, sex, smoking, BMI, cholesterol level, HbA1c, reported alcohol consumption at baseline and mean physical activity.
Odds ratios for high pulse pressure and low eGFR by fifths of CV were calculated using logistic regression model. High pulse pressure was defined as greater than or equal to 60 mmHg2, and low eGFR as less than 60 mL/min/1.73 m2. Statistical significance was tested with a logistic regression model adjusted for age, sex, smoking, BMI, cholesterol level, HbA1c, a reported alcohol consumption at baseline and mean physical activity and baseline SBP (only eGFR). Statistical significance was indicated by P < 0.05.
All statistical analyses were done in R version 4.1.2 and RStudio version 2022.2.2.485 (R Core Team (2021). R: A language and environment for statistical computing. R Foundation for Statistical Computing, Vienna, Austria. URL https://www.R-project.org/. RStudio Team (2022). RStudio: Integrated Development Environment for R. RStudio, PBC, Boston, MA URL http://www.rstudio.com/).


Comments (0)