
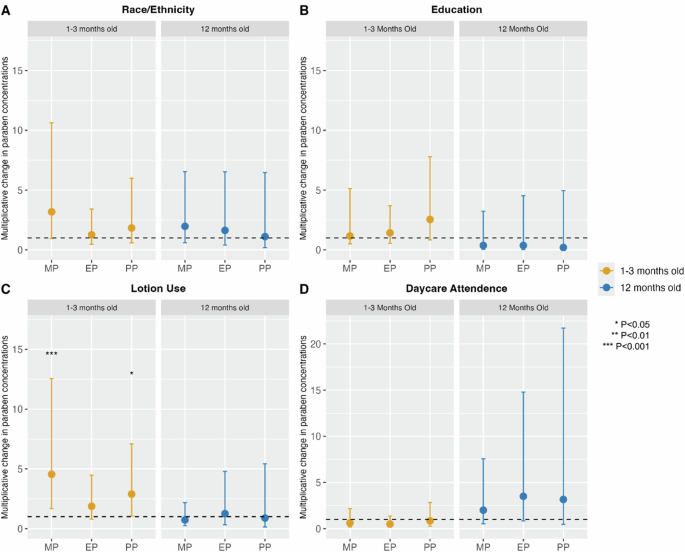
Remember me


An online survey was conducted of the general population in the United States of America. The objective of the survey was to quantify the amount of sunscreen consumers use per sunscreen application. The questionnaire (see Appendix S1) queried participants about their general sunscreen habits, if any, and how much sunscreen they typically apply to the face and both arms. A previous study was conducted using an online survey in Korea to identify common chemicals contained in household and personal care products and how much the respondents use of each product with the goal of conducting an aggregate human exposure assessment [14]. For this research, the survey method was refined with the addition of visual reference photos (Fig. 1) to aid participants in selecting the amount of sunscreen they typically apply per application.
Fig. 1: Visual reference used in novel web-based consumer questions.
The visual reference includes photos of a measured mass of sunscreen in a hand plus food examples to aid respondents in choosing an estimated sunscreen application amount to their face and both their arms.
The panel included adults between 18–70 years old that reside in the United States of America. Data from the United States Census Bureau were used to determine quotas for participant genders, ethnicities, ages, and states of residence. Participant ethnicities were included to address possible cultural differences in sunscreen usage among subpopulations. Non-Caucasian ethnicities may be under-studied in sunscreen-related research. To account for this, the present study intentionally over-sampled for African American participants (up to 35%) and balanced the remaining participant ethnicities according to US Census data (see Table S1).
The questionnaire consisted of multiple-choice questions regarding demographic characteristics, sunscreen usage behaviors, reasons for usage, etc. Participants were asked if they applied sunscreen in the last 12 months. If the answer was yes, the participant was directed to a set of sunscreen user questions. If the answer was no, the participant was directed to a set of sunscreen non-user questions.
Candidates were invited to participate in the online self-administered survey hosted by Qualtrics (www.qualtrics.com). Qualtrics uses a mixed-method to recruit individuals. Respondents that previously registered with Qualtrics received a generic email invitation to participate in this study. If the participant agreed to participate, the link in the invitation email directed them to a detailed informed consent form. The participant was asked to review the informed consent and select “agree” to continue with the questionnaire or “disagree” to stop completion of the questionnaire. Double opt-in systems help to ensure data quality by screening out marginally-interested participants. This survey relied on participant self-reporting as the research team had no interaction with them.
After reviewing the results from the initial survey, a second follow-up survey was also conducted with an improved questionnaire. Improvements included refined instructions and reduced survey length to lessen the risk of survey fatigue. The objective of this follow-up survey was to refine the face application thickness estimation due to the observed variance of the initial survey. The follow-up survey was conducted in the United States to test the hypothesis that improved instructions would provide a better-quality (i.e., less varied) dataset. In addition, the instructions for selecting the representative sunscreen amount for application to their face and both their arms had clarified language and pictures added to indicate the application area of interest (see SI Appendix S2). This was done to remove possible ambiguity in the question being asked and clarify that the application site of interest was only the facial area and should not include the participant’s ears, neck, top of head, chest, etc. This survey was sent via SurveyMonkey to the general population but was screened for face sunscreen users, unlike the initial, larger survey. The platform provider was different for this study due to contract changes; however, the questions were programmed so they would be presented to the participants in the same format as the initial study. Two questions were added to qualitatively assess the participants’ facial sunscreen use.
Ethics approval was obtained from the University of Cincinnati Institutional Review Board (IRB) before each survey was initiated (UC IRB #2021-1118 & UC IRB# 2022-0310).
Application thickness estimationThe data collected from the survey method was used to estimate a single sunscreen application thickness value per participant. The questions related to sunscreen application thickness were narrowed to the face and both arms. Instead of estimating sunscreen application to the entire body, it was thought that it would be easier for participants to separately consider and visualize specific application areas. Habits and practices of face sunscreen use have been changing in the past few years [15]; therefore, face application was one application area of interest. Application to both arms was included as a representative site for body application from the neck down.
The survey questionnaire was used to collect two key data points: (1) the amount of sunscreen typically applied to an individual’s face and both arms using a reference image and (2) each participant’s height and weight. These data were then combined to estimate each participant’s applied sunscreen amount and body surface area (BSA). Taken together, a face and body application thickness can be calculated (mg/cm2).
Each participant was asked to review the reference image (Fig. 1) and indicate how much sunscreen they typically apply to their face and to both arms in two separate questions. In addition to a reference amount of sunscreen, common/easily recognizable food items were included in the reference image to further aid participants in estimating and recalling previous sunscreen applications. The amounts used in each picture were weighed prior to the survey and correspond to each food item: small candy = 0.75 g; blueberry = 1.25 g; almond = 2 g; raspberry = 5 g; and two grapes = 10 g. The height (recorded in feet and inches) and weight (recorded in pounds) of each individual participant were noted and were inputted into the BSA calculation from the United States Environmental Protection Agency’s (US EPA) equation [16], BSA = 0.0239 × (H^0.417) × (W^0.517). The resultant BSA value was calculated in centimeter squared for further analysis. The surface area of the participant’s face was estimated to be 5.5% of their total BSA (4.5% face plus 1% accounting for application with fingers) and both arms were estimated to be 18% of the participant’s total BSA [17].
Participants’ body weights were collected in 10-pound increments. The lower value in the weight range was used for the BSA range because this would provide the most conservative estimate of application thickness (i.e., amount applied to a smaller surface area gives a higher mg/cm2 estimate). And while some participants might under-report their actual weight due to not being weighed recently or possible societal stigmas, using the lower value in the weight range results in a higher estimated application thickness amount. The conservative nature of the application thickness estimation adds a margin of safety when used in both environmental exposure estimates and possible human health exposure assessments.
Literature reviewA literature review was conducted to serve as a test of validity of the survey results [18] and searched for all previously published studies quantifying sunscreen application thickness. A review of several websites using a set of keywords was used to identify a base set of papers. The initial search was conducted with Science Direct, PubMed, and Google Scholar using a combination of the following keywords: sunscreen application, sunscreen use/usage, consumer sunscreen application rate. Only papers published in English were searched.
Once the base set of papers was curated, inclusion and exclusion criteria were applied to identify the most relevant papers. Only those studies conducted with adults (>18 years old) were included. Studies that included measurements of the sunscreen application thickness to volunteers’ face and body were included. In addition, only studies that used lotion type products were included; therefore, studies measuring application of spray products, make-up, or lip products were excluded from the review. There were no geographic exclusion criteria.
After applying inclusion and exclusion criteria, a snowballing technique [19] was used on the core set of papers. For each paper, the text (forward snowballing) and the reference list (backward snowballing) were reviewed for further research to include in this literature review. Additionally, to ensure inclusion of the greatest number of relevant studies, the most frequently cited papers were selected for additional searching using Connected Papers (https://www.connectedpapers.com/). This website connects publications based on their similarity and allows the identification of additional relevant publications.
Each paper was reviewed, and the reported application thickness amounts were collected along with the year of the study, details of the study population, geographic location, the method of measurement, and the study aim.
Statistical analysisAfter each individual sunscreen application thickness was estimated, a logarithmic multiple variable regression analysis was conducted using IBM SPSS Statistics (version: 28.0.0.0 (190)) software to determine if any of the independent variables were significant predictors of sunscreen application thickness to the face or both arms. For this analysis, the statistical significance level used is 0.05. Non-numeric independent variables were transformed to numeric values (Table S4). Summary statistics were also calculated for each data set using IBM SPSS Statistics.
Comments (0)