
Remember me


A total of 11,963,886 cases of seven RIDs were reported in the mainland of China between 2017 and 2021. Of these, 7,941,892 (66.38%) were clinically diagnosed cases, while 4,021,994 (33.62%) were laboratory-confirmed cases. The five-year average incidence rate for all seven RIDs combined was 170.73 cases per 100,000 population. The highest incidence rate was recorded in 2019, reaching 343.18 cases per 100,000 (Fig. 1). Examining the individual RIDs, the highest five-year average incidence rate was observed for seasonal influenza (94.14 per 100,000), followed by PTB (55.52 per 100,000), mumps (15.16 per 100,000), scarlet fever (4.02 per 100,000), pertussis (1.10 per 100,000), rubella (0.59 per 100,000), and measles (0.21 per 100,000) (Fig. 1).
Fig. 1
The incidence cases and rates of seven RIDs during 2017–2021. Notes: Seven RIDs includes seasonal influenza, PTB, mumps, scarlet fever, pertussis, rubella and measles
Population distributions of RIDsAcross all seven RIDs, males exhibited higher incidence cases and rates compared to females, particularly notable for PTB, mumps, and scarlet fever, as evident in both clinically diagnosed and laboratory-confirmed cases (Fig. 2). Age distribution revealed that the 0–4 and 5–14 age groups experienced the highest incidence rates, a pattern consistent across laboratory-confirmed and clinically diagnosed cases (Fig. 3A). Notably, seasonal influenza predominantly affected the 5–14 age group, with the highest incidence rate occurring in the 0–4 age group (Fig. 3B). For PTB, the highest incidence rate was observed among those aged 65 years and older (Fig. 3C). The 40–64 age group accounted for the highest number of PTB cases (39.62–41.82% during 2017–2021), followed by the 15–39 age group (30.20–33.31%). The 5–14 age group showed the highest incidence rates and cases for mumps and scarlet fever (Fig. 3D, E). Pertussis primarily affected children in the 0–4 age group, with the highest incidence rates and cases in that group (Fig. 3F). Rubella cases were concentrated in the 15–39 age group, with the highest incidence rate observed in the 5–14 age group (Fig. 3G). Measles cases were most frequent in the 0–4 age group, followed by the 15–39 age group (Fig. 3H).
Fig. 2
The incidence cases and rates of seven RIDs by gender during 2017–2021
Fig. 3
The incidence cases and rates of seven RIDs by age groups during 2017–2021
Occupational distribution of populationsAnalyzing twenty occupational categories based on NNDRS classification (Fig. 4), students, farmers, diaspora children and preschool care children emerged as the predominant populations, accounting for 26.90%, 24.58%, 14.71% and 13.07% respectively, across all seven RIDs (Fig. 4A). This trend remained consistent for specific RIDs, with students comprising the dominant group for seasonal influenza, mumps, scarlet fever and rubella (Fig. 4B, D, E, G), while diaspora children took the lead for pertussis and measles (Fig. 4F, H). Notably, farmers constituted the primary population for PTB, trailed by housekeepers, house-workers and the unemployed (Fig. 4C).
Fig. 4
The percentage of occupations for seven RIDs during 2017–2021. RIDs: Respiratory infectious diseases; PTB: Pulmonary tuberculosis
Temporal trends of RIDsThe incidence rates of the seven RIDs exhibited a peak in 2019, although no significant temporal trend was observed (APC = −1.42%, 95% CI: −39.14 to 57.09%, P = 0.96) (Table 1 and Fig. 5A). The incidence of laboratory-confirmed RIDs cases increased (APC = 12.15%, 95% CI: −18.67–59.49%, P = 0.56), while clinically diagnosed cases decreased (APC = −6.15%, 95% CI: −45.43 to 53.48%, P = 0.84), though neither trend proved statistically significant (Table 1 and Fig. 5A). Seasonal influenza, mumps, scarlet fever, pertussis and rubella all displayed peak incidences in 2019 without significant temporal trends (Table 1 and Fig. 5B, D–G). However, PTB and measles demonstrated decreasing incidence rates from 2017 to 2021. The PTB incidence rate notably decreased from 62.36/100,000 in 2017 to 46.72/100,000 in 2021, reflecting an APC of −7.53% (95% CI: −12.31 to −2.79%, P = 0.009), with clinically diagnosed rates also decreasing significantly (APC = −18.37%, 95% CI: −26.83 to −10.76%, P = 0.002) (Table 1 and Fig. 5C). The measles incidence rate underwent a substantial decline from 0.43/100,000 in 2017 to 0.04/100,000 in 2021, with an APC of −40.87% (95% CI: −61.18 to −24.32%, P = 0.02), and similar patterns emerged for laboratory-confirmed rates (APC = −38.78%, 95% CI: −58.00 to −22.20%, P = 0.03) and clinically diagnosed rates (APC = −60.24%, 95% CI: −86.61 to −44.67%, P = 0.02) (Table 1 and Fig. 5H).
Table 1 The APC and CI for incidence of seven RIDs in the mainland of China during 2017–2021Fig. 5
The temporal trends of incidence rates for seven RIDs during 2017–2021. Notes: Point represent the observed incidence rates, line represent the fitting line of the observed incidence rates and the slope indicating the value of APC; * represent the P < 0.05. RIDs: Respiratory infectious diseases; PTB: Pulmonary tuberculosis
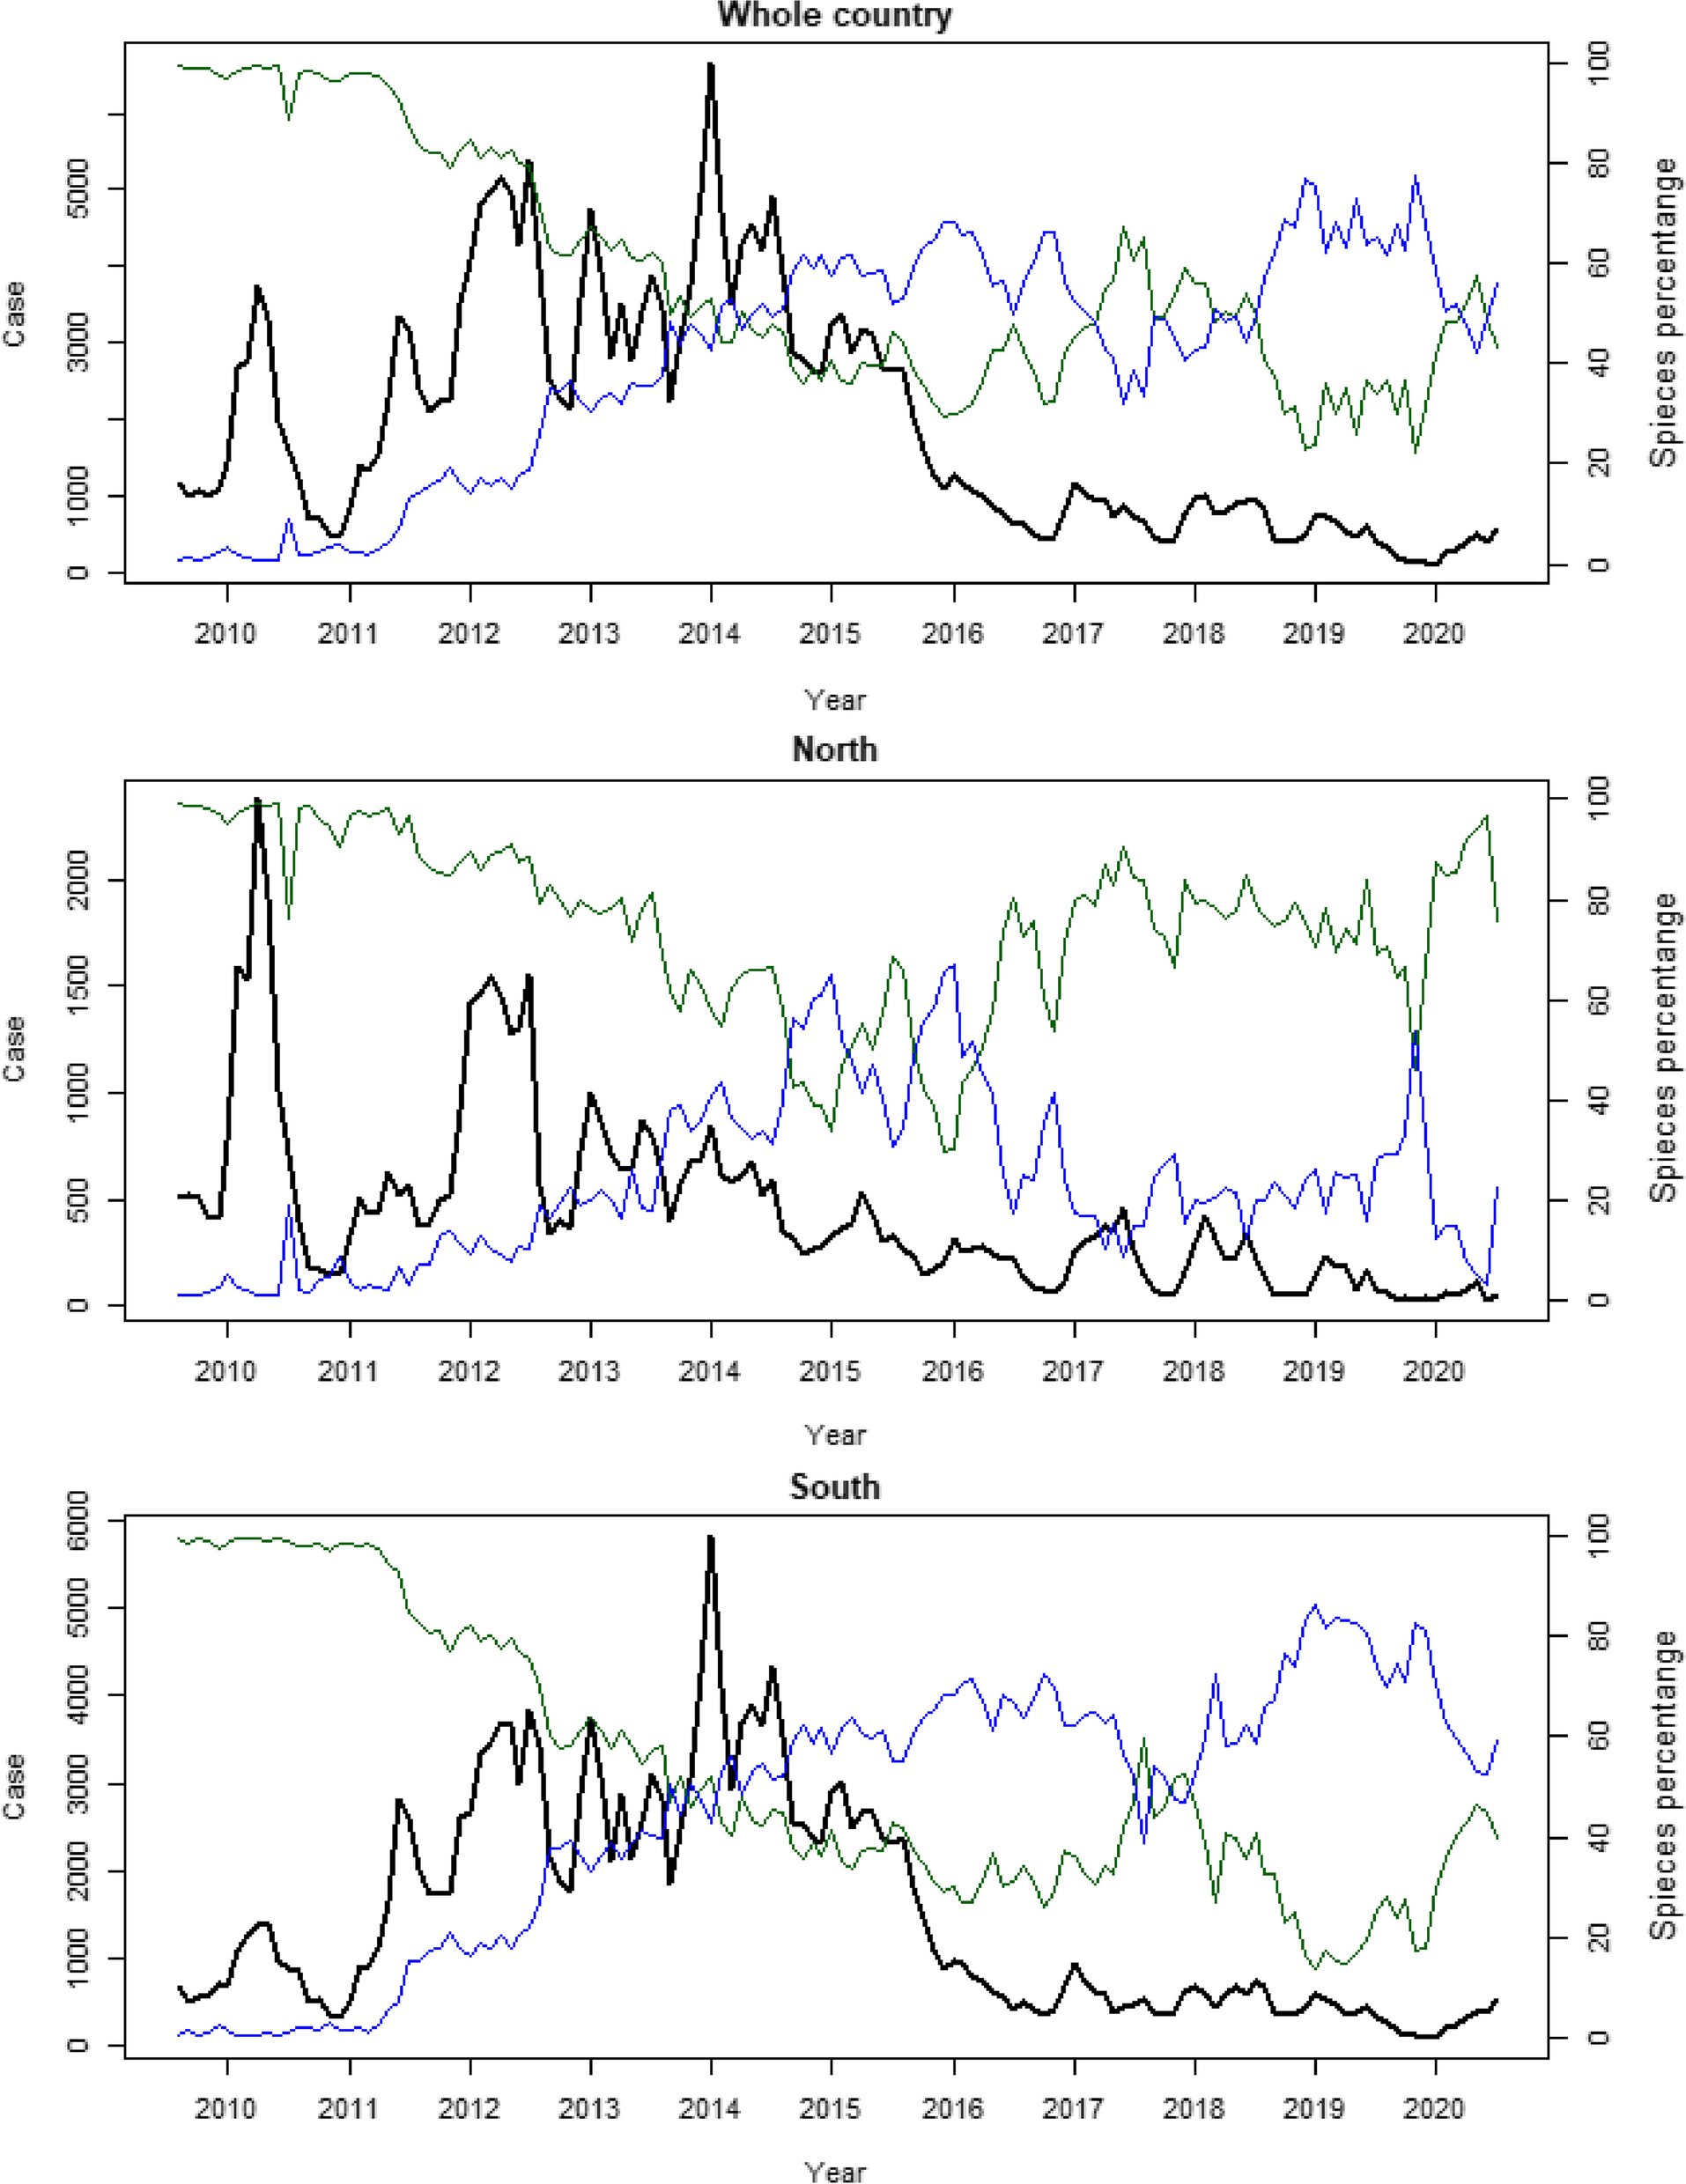
Seasonal patterns of RIDsSeasonal characteristics of the seven RIDs exhibited variations, including divergent patterns within the same RIDs across different areas (Fig. 6). Seasonal influenza incidence rates peaked in December and January for both northern and southern China (Fig. 6A). PTB displayed higher rates between January and June in both regions (Fig. 6B). Mumps, scarlet fever, pertussis, and rubella had extended high-incidence periods in southern China compared to the north (Fig. 6C–F). Measles incidence was prominent from January to June in the north, and from February to July in the south (Fig. 6G).
Fig. 6
The seasonal distributions of incidence rates for seven RIDs during 2017–2021. Notes: Red represent months with high incidence rate. RIDs: Respiratory infectious diseases; PTB: Pulmonary tuberculosis
Spatial distributions of seven RIDsThe geographic distribution of RIDs incidence varied (Table 2 and Additional file 1: Fig. S1). In 2017, four clusters covered 10 PLADs for all seven RIDs, with the most likely cluster located mainly in Hainan, Guangxi, Guangdong, Guizhou and Hunan (RR = 1.72, P < 0.001) (Table 2). In 2021, three clusters spanning 12 PLADs were identified, with the most likely cluster encompassing 10 PLADs (Guizhou, Chongqing, Yunnan, Guangxi, Sichuan, Hunan, Guangdong, Hainan, Hubei and Shaanxi; RR = 1.95, P < 0.001) (Table 2). Examining trends in all seven RIDs across 31 PLADs from 2017 to 2021, no significant trends were observed (Table 3).
Table 2 The spatial and clustered characteristics of seven RIDs in 2017 and 2021Table 3 The APC and 95% CI for incidence of seven RIDs in the 31 PLADs during 2017–2021Spatial distributions for individual RIDs were also diverse among PLADs. Seasonal influenza showed four clusters covering four PLADs in 2017 and four clusters covering 13 PLADs in 2021, with the most likely cluster located in Guangdong (RR = 3.68, P < 0.001) in 2017 and spanning 10 PLADs (Guizhou, Chongqing, Yunnan, Guangxi, Sichuan, Hunan, Guangdong, Hainan, Hubei and Shaanxi; RR = 2.42, P < 0.001) in 2021 (Table 2). PTB exhibited three clusters covering 14 PLADs in 2017, primarily within Xinjiang, Qinghai and Tibet (RR = 3.18, P < 0.001). In 2021, four clusters spread across 15 PLADs, with the most likely cluster encompassing 10 PLADs (Guizhou, Chongqing, Yunnan, Guangxi, Sichuan, Hunan, Guangdong, Hainan, Hubei and Shaanxi; RR = 1.66, P < 0.001) (Table 2). PTB incidence displayed a decreasing trend in 19 PLADs, with the highest APC in Gansu (APC = −14.76%, P = 0.009), mirroring the national pattern (Table 3). Mumps presented with the most likely cluster spanning 16 PLADs (RR = 2.24, P < 0.001) in 2017, while two clusters covered 14 PLADs in 2021 with the most likely cluster encompassing 13 PLADs (RR = 1.97, P < 0.001) (Table 2). National trends largely showed no significant change of mumps, except for notable decreases in Henan (APC = −33.96%, P = 0.004), Guizhou (APC = −25.39%, P = 0.02), Chongqing (APC = −20.30%, P = 0.008), Shaanxi (APC = −17.30%, P = 0.04), and Ningxia (APC = −7.89%, P = 0.03) (Table 3). Scarlet fever demonstrated four clusters across 15 PLADs in 2017 and five clusters covering 16 PLADs in 2021. The most likely cluster included nine PLADs (Heilongjiang, Jilin, Liaoning, Beijing, Tianjin, Shandong, Hebei, Inner Mongolia and Shanxi; RR = 2.52, P < 0.001) in 2017 and six PLADs (Ningxia, Gansu, Qinghai, Shaanxi, Inner Mongolia and Shanxi; RR = 2.13, P < 0.001) in 2021 (Table 2). Scarlet fever incidence displayed no significant trend in the 31 PLADs, aligning with the national pattern (Table 3). Pertussis exhibited three clusters across four PLADs in 2017, with the most likely cluster encompassing Shandong and Tianjin (RR = 8.04, P < 0.001). In 2021, two clusters spanned seven PLADs, with the most likely cluster covering six PLADs (Chongqing, Sichuan, Guizhou, Shaanxi, Yunnan and Hunan; RR = 3.66, P < 0.001) (Table 2). Pertussis incidence displayed no significant trend in most PLADs, except for an increase in Yunnan (APC = 79.74%, P = 0.02) (Table 3). Rubella presented with three clusters spanning seven PLADs in 2017, with the most likely cluster in Fujian (RR = 4.53, P < 0.001). In 2021, four clusters covered six PLADs, with the most likely cluster in Qinghai (RR = 42.06, P < 0.001) (Table 2). Rubella incidence rate showed no significant trend across PLADs (Table 3). Measles exhibited three clusters across six PLADs in 2017 and two clusters spanning six PLADs in 2021. The most likely cluster included four PLADs (Tibet, Sichuan, Yunnan and Qinghai; RR = 7.08, P < 0.001) in 2017 and five PLADs (Ningxia, Gansu, Qinghai, Shaanxi and Inner Mongolia; RR = 2.68, P < 0.001) in 2021 (Table 2). Measles incidence displayed decreasing trends in 12 PLADs, with Tibet showing the greatest decrease (APC = −82.74%, P < 0.001), consistent with the national trend (Table 3).
Characteristics of laboratory-confirmed and clinically diagnosed casesThe five-year average incidence rate of laboratory-confirmed cases for all seven RIDs combined was 35.64/100,000, peaking at 96.70/100,000 in 2019 (Fig. 1A). Among the individual RIDs, the incidence rates of laboratory-confirmed cases for scarlet fever (APC = −24.19%, 95% CI: −45.40 to −5.15%, P = 0.02) and measles (APC = −38.78%, 95% CI: −58.00 to −22.20%, P = 0.03) decreased, while the remaining RIDs showed no significant trends from 2017 to 2021 (Table 1 and Fig. 5).
The proportion of laboratory-confirmed cases among all seven RIDs increased from 26.33% in 2017 to 48.21% in 2021, with a peak of 48.96% in 2020 (Fig. 7A). Notably, different RIDs exhibited varying proportions of laboratory-confirmed cases, with measles and rubella having higher proportions, while mumps and scarlet fever displayed lower proportions (Fig. 7D, E, G, H). In 2021, the national proportion of laboratory-confirmed cases for seasonal influenza reached 49.61%, with significant variations among PLADs, ranging from 82.63% in Zhejiang to 24.54% in Jiangxi (Fig. 7B). For PTB, the proportion of laboratory-confirmed cases varied across PLADs, with the highest in Chongqing (65.09%) and the lowest in Tibet (30.56%) in 2021 (Fig. 7C). Mumps displayed relatively low proportions of laboratory-confirmed cases across PLADs, with higher values in Heilongjiang (10.40%), Tibet (9.26%), Qinghai (8.35%) and Xinjiang (7.13%) in 2021 (Fig. 7D). Scarlet fever showed a similar pattern, with Shanghai having the highest proportion of laboratory-confirmed cases (Fig. 7E). Pertussis exhibited a nationwide proportion of 44.94% in 2021, with varying proportions among PLADs due to differing case reporting (Fig. 7F). Rubella and measles both had a high proportion of laboratory-confirmed cases, with national rates of 75.12% and 91.11% respectively in 2021 (Fig. 7G, H).
Fig. 7
The percentage of laboratory-confirmed cases for seven RIDs during 2017–2021. PLADs: Provincial-level administrative divisions; RIDs: Respiratory infectious diseases; PTB: Pulmonary tuberculosis
Comments (0)