
記住我
Fluoride is an essential microelement known to be crucial in the development of mineralized tissues, including bones and teeth. Fluoridation of community drinking water has been a successful public health measure in preventing the development of dental caries and is one of the most notable public health accomplishments of the 20th century.1,2 In the United States, the Centers for Disease Control and Prevention (CDC) monitor community water fluoridation at county and state levels and report these data biannually.
Determining appropriate community water dosing of fluoride has been challenging and controversial. Small amounts of fluoride are essential for mineralized tissues and induce bone formation through the stimulation of osteoblasts and inhibition of osteoclasts.3 Too much fluoride is toxic and can cause fluorosis, a condition in which excessive fluoride accumulates in mineralized tissues. Fluorosis is characterized by dental mottling and osteoporosis/osteosclerosis, and, in severe cases, is associated with damage to endocrine, cardiovascular, renal, hepatic, and neurologic organs.4–7 Fluorosis has been identified as a major public health problem, particularly among populations living in areas with high endemic levels of fluoride in water supplies.8–10 A 2018 study of residents living in the communities of Northwest Iran found that skeletal fluorosis of people who live in areas with high water fluoride concentrations is 18.1% higher than that of individuals who live in areas with low water fluoride concentrations.11 The difference between tolerated dose and toxic dose of fluoride is small and has not been well-established in the literature.3 Fluoride is primarily stored in mineralized tissues, and in children, bony retention of fluoride is higher than in adults.12 There is mixed evidence regarding exposure to fluoride and adult fractures, with some literature suggesting that fluoride exposure is associated with fragility fractures thought to be due to the deleterious effects of fluoride on bone turnover.13 The effects of fluoride on pediatric fracture risk have not yet been assessed.
The purpose of this study was to explore the association between state water fluoride practices and rates of pediatric supracondylar humerus fracture (SCHF) in both bone forearm fracture (BBFFx) and femur fracture (FFx). This study sought to address the gaps that currently exist in the literature regarding the possible association between fluoride and pediatric bone health.
Methods DataThis was an observational, cross-sectional study. A national insurance database (PearlDiver), including both private insurance and Medicaid patients, was queried using Current Procedural Terminology (CPT) codes to identify the number of children aged between 4 and 10 years who were treated for each of the fractures of interest between 2010 and 2020 in each US state. For SCHF, the following CPT codes were used: 24530, 24535, 24538, 24545, and 24546. For BBFFx, the following CPT codes were used: 25560, 25565, 25574, and 25575. For FFx, the following CPT codes were used: 27500, 27502, 27506, and 27507.
2020 US Census data were then obtained to identify the number of children in each age group in each state.14 Based on these data, an estimated annual rate was calculated for each fracture type in each state.
Centers for Disease Control and Prevention (CDC) data were used to determine the percentage of each state's population receiving fluoridated water.15 Percentages were reported by the CDC in 2-year intervals, and data from 2010, 2012, 2014, 2016, 2018, and 2020 were averaged to yield a percentage of each state's population receiving fluoridated community water for this study's 10-year period. Data from all 50 states were available.
We determined the weighted average of states' fluoride level by multiplying the fluoride level in each county by the population of that county divided by the total state population.15 Dosage data were available for 31 states. Available data since 2015 were collected and averaged to yield a 5-year average fluoride level per state.
StatisticsPearson correlation coefficients were calculated for the relationships between state-level fracture rates and state percentage of fluoridated water. Pearson correlation coefficients were also calculated for the relationships between state-level fracture rates and average state-level water fluoride levels for each fracture type in the 31 states with available fluoride level data. Significance levels were determined.
Wilcoxon rank-sum tests were used to compare state percentage of fluoridation by quartiles with state-level fracture rates. We compared the differences in fracture rates between the highest and lowest quartile percentage state fluoridation groups for each fracture type. Quartiles were also calculated based on the average state fluoride level, and differences in fracture rates sustained by those in the highest and lowest quartiles were determined.
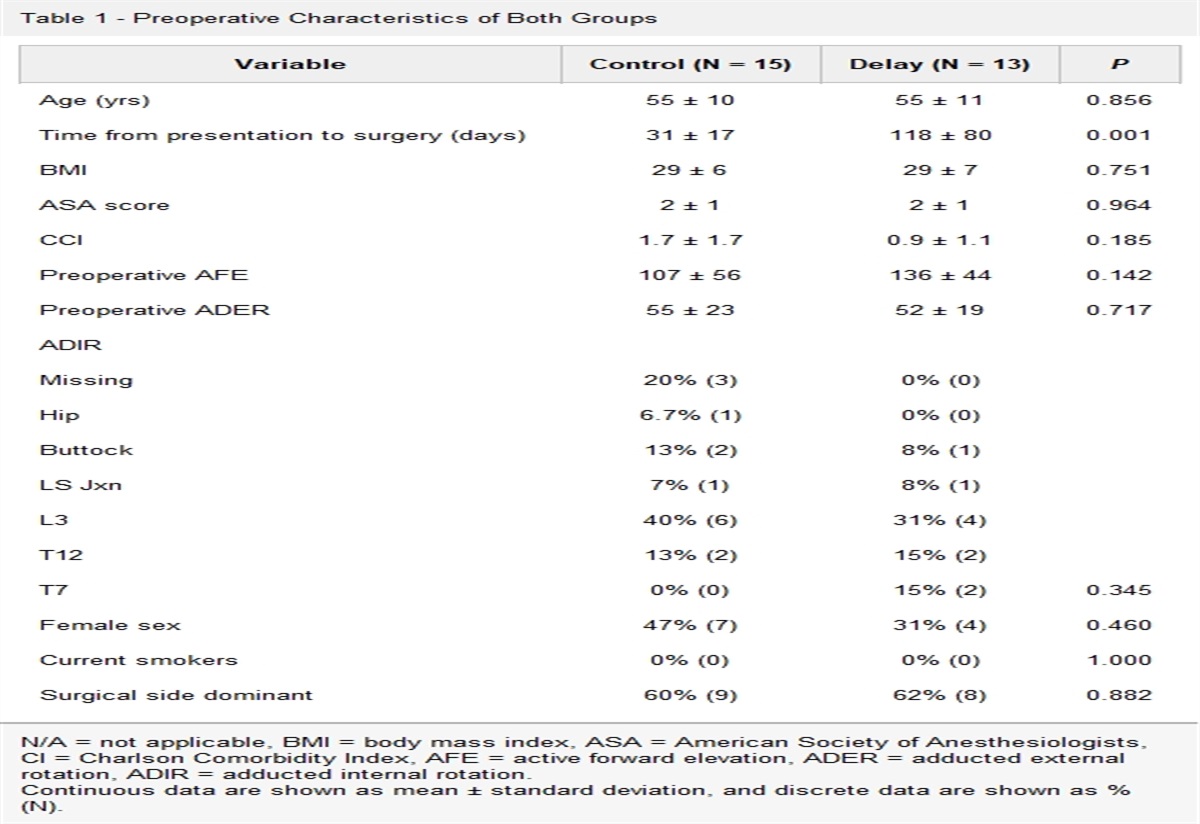
ResultsIn total, 106,423 pediatric patients were identified in the PearlDiver database who met the inclusion criteria for this study for diagnosis, date of injury, and age: 40,197 SCHF patients, 61,041 BBFFx patients, and 5,185 FFx patients. For all fracture types, the average age was between 6 and 7 years (Table 1).
Table 1 - Demographics for Fracture Cohorts Supracondylar Humerus Fracture (SCHF) Both Bone Forearm Fracture (BBFFx) Femur Fracture (FFx) n 40,197 61,041 5,185 Age, mean (SD) 6.30 (1.69) 6.91 (1.87) 6.44 (2.03) Sex, % female 47.5 40.6 32.2 Region Midwest, n (%) 9,882 (24.6) 15,797 (25.9) 1,400 (27.0) Northeast, n (%) 5,792 (14.4) 9,512 (15.6) 835 (16.1) South, n (%) 17,808 (44.3) 26,455 (43.3) 2,138 (41.2) West, n (%) 6,335 (15.8) 8,762 (14.4) 742 (14.3)The average percentage of state population receiving fluoridated water ranged from 10.6% (Hawaii) to 100% (Washington DC) with a median of 76.94% (first quartile: 57.62%, fourth quartile: 91.52%). In most states (84%), more than 50% of the population received fluoridated water. In the 31 states with county-level data on fluoride levels, the average state fluoride level ranged from 0.39 to 0.7 mg/L (Table 2).
Table 2 - Average Percent of State Receiving Fluoridated Water (%) and Average Fluoride Level (mg/L) For Each State and Fracture Type State Average Percentage of State Receiving Fluoridated Water (2010–2020), % Average Fluoride Level (mg/L) SCHF Fracture Rate per 100,000 Children Aged 4–10 yrs BBFFx Fracture Rate per 100,000 Children Aged 4–10 yrs FFx Fracture Rate per 100,000 Children Aged 4–10 Alabama 78.48 0.56 4.79 12.86 0.30 Alaska 51.05 0.39 4.43 7.06 0.00 Arizona 57.63 21.37 29.81 3.72 Arkansas 76.45 0.60 5.32 11.01 0.48 California 61.15 0.42 4.47 5.28 0.33 Colorado 73.58 0.65 12.27 18.24 1.25 Connecticut 90.03 0.63 7.70 9.23 0.57 District of Columbia 96.00 7.64 8.42 0.00 Delaware 88.82 0.55 5.93 16.92 1.36 Florida 77.82 0.55 17.34 26.34 1.86 Georgia 95.15 0.66 14.40 25.91 1.92 Hawaii 10.25 14.06 8.51 0.00 Idaho 32.30 3.83 6.54 0.00 Illinois 98.57 0.70 11.38 17.14 1.10 Indiana 93.83 0.67 18.09 29.32 2.50 Iowa 91.23 0.69 17.48 35.14 2.05 Kansas 64.85 0.53 11.43 17.47 1.01 Kentucky 99.88 0.70 23.29 38.66 2.13 Louisiana 41.58 0.43 13.51 23.96 2.56 Maine 79.30 0.56 18.03 27.10 2.37 Maryland 95.70 14.90 33.59 1.61 Massachusetts 64.08 0.44 5.56 9.56 0.62 Michigan 90.33 0.64 23.35 34.23 3.61 Minnesota 98.80 0.69 7.61 14.65 1.56 Mississippi 59.37 0.51 6.92 15.36 0.97 Missouri 76.27 0.55 9.03 19.02 1.36 Montana 31.85 4.56 7.17 0.00 Nebraska 71.67 0.59 12.73 25.57 1.32 Nevada 74.42 0.60 9.23 17.30 1.10 New Hampshire 45.82 0.45 4.86 11.95 0.00 New Jersey 14.93 17.17 28.39 2.26 New Mexico 76.92 16.85 29.09 2.07 New York 72.10 14.61 23.09 1.99 North Carolina 87.63 6.41 13.07 0.84 North Dakota 96.52 0.67 11.52 19.25 0.00 Ohio 91.72 26.54 39.44 4.23 Oklahoma 67.08 14.07 23.49 1.56 Oregon 23.85 19.05 25.60 2.39 Pennsylvania 55.68 11.86 20.67 2.27 Rhode Island 84.02 0.59 4.58 7.68 0.00 South Carolina 91.58 0.70 18.03 34.91 3.80 South Dakota 93.85 20.00 32.57 2.68 Tennessee 89.23 0.63 20.65 27.30 2.62 Texas 75.05 0.60 21.94 21.51 2.32 Utah 48.73 5.61 12.14 0.65 Vermont 56.28 0.00 3.29 0.00 Virginia 95.93 0.70 10.80 24.48 1.63 Washington 64.17 0.60 15.52 20.82 1.80 West Virginia 90.98 20.25 41.21 2.96 Wisconsin 88.08 13.54 21.28 1.95 Wyoming 51.22 8.37 13.31 0.00BBFFx = both bone forearm fracture, FFx = femur fracture, SCHF = supracondylar humerus fracture.
In our correlation analysis, we found positive correlations between state percentage fluoridation and fracture rate for BBFFx (r = 0.39, P = 0.0044) and FFx (r = 0.28, P = 0.040). Although a positive association was demonstrated for SCHF (r = 0.24), this association was not significant (P = 0.082) (Figure 1).
 Figure 1:
 Graphs with correlation analyses demonstrating positive correlations between state percentage fluoridation and fracture rates for BBFFx (r = 0.39, P = 0.0044) and FFx (r = 0.28, P = 0.040). Although a positive association was demonstrated for SCHF (r = 0.24), this association was not significant (P = 0.082). BBFFx = both bone forearm fracture, FFx = femur fracture, SCHF = supracondylar humerus fracture.
The calculated concentrations of fluoride in per liter of drinking water based on the weighted averages of fluoride concentration by county population had strong positive correlations with fracture rates for all fracture types: SCHF (r = 0.5, P = 0.0045), BBFFx (r = 0.53, P = 0.0021), and FFx (r = 0.41, P = 0.022) (Figure 2).
 Figure 2:
 Graphs with correlation analyses demonstrating positive correlations between the calculated concentrations of fluoride per liter of drinking water based on weighted averages of fluoride concentration by county population and fracture rates for SCHF (r = 0.5, P = 0.0045), BBFFx (r = 0.53, P = 0.0021), and FFx (r = 0.41, P = 0.022). BBFFx = both bone forearm fracture, FFx = femur fracture, SCHF = supracondylar humerus fracture.
Fracture rates significantly differed between the highest quartile and the lowest quartile fluoridation percentage states for SCHF (P = 0.0428) and BBFFx (0.0052). Rates for FFx did not significantly differ (P = 0.16) (Figure 3).
 Figure 3:
 Graphs with Wilcoxon rank-sum analyses demonstrating that fracture rates significantly differed between the highest quartile and the lowest quartile fluoridation percentage states for SCHF (P = 0.0428) and BBFFx (0.0052). The rates for femur fractures did not significantly differ (P = 0.16). BBFFx = both bone forearm fracture, SCHF = supracondylar humerus fracture.
Fracture rates significantly differed between the highest quartile and lowest quartile average state fluoride levels for SCHF (P = 0.012) and BBFFx (0.012). No significant differences were found for FFx (P = 0.059) (Figure 4).
 Figure 4:
 Graphs with Wilcoxon rank-sum analyses demonstrating that fracture rates significantly differed between the highest quartile and lowest quartile average state fluoride levels for SCHF (P = 0.012) and BBFFx (0.012). The rates for femur fractures did not significantly differ (P = 0.059). BBFFx = both bone forearm fracture, SCHF = supracondylar humerus fracture.
Heat maps were generated to visually demonstrate relative average state fluoride levels (mg/L), percentage of state population receiving fluoridated water (%), and rates of each fracture type by state (Figure 5).
 Figure 5:
 Illustrations of US heat maps depicting relative average state fluoride levels (mg/L), percentage of state population receiving fluoridated water (%), and rates of each fracture type by state.
DiscussionThis study is the first to explore the association between community water fluoridation and rate of pediatric fractures using national databases. In our analysis of the PearlDiver cohort of 106,423 pediatric patients with SCHF, BBFFx, or FFx aged between 4 and 10 years, we found statistically significant associations between fracture rate, state-level percentages of population using fluoridated water, and calculated fluoride doses. To our knowledge, this is the first study investigating the community water fluoridation and its possible association with pediatric fracture risk.
Fluoride is well-established as an essential nutrient necessary for the development of bones and teeth. It plays a crucial role in the modulation of bone turnover through its effects on osteoblasts and osteoclasts. At low doses, fluoride increases bone mass through the inhibition of osteoclasts and the promotion of osteoblasts.16 A study on cell lines found that fluoride induces epigenetic changes through DNA hypermethylation in BMP1, METAP2, MMP11, and BACH1, which, in turn, may affect cartilage formation, angiogenesis, and bone density.17
The physiologic effects of fluoride seem to be dose-dependent. High doses of fluoride are associated with delayed bone mineralization and decreased bone mechanical properties.18 In vitro treatment of rat ulnas with sodium fluoride resulted in decreased bone turnover and diminished mechanical properties (elastic modulus, ultimate stress, and bending rigidity).19 In sheep, high fluoride (9.8 mg/L) intake from groundwater combined with low calcium led to poor bone quality and fragility fractures.20 In humans, excessive fluoride intake results in skeletal fluorosis. It is hypothesized that, at higher doses, fluoride inhibits normal bone turnover, and although bone volume is increased, trabecular connections are not, resulting in poor-quality, weak bone.3,21
Fluoridation of community water has been studied extensively because of the potentially harmful effects of excessive fluoride intake. In 2015, the US Public Health Service updated its 1962 recommendations to recommend an optimal community fluoride water concentration of 0.7 mg/L, with a maximum permitted concentration of 4 mg/L.22 The World Health Organization recommends 1.5 mg/L.23 These recommendations are often debated and are frequently revisited with the goal of maximizing benefits of fluoride intake for bone and teeth health while minimizing harm.
The effect of fluoride in drinking water on adult hip fractures has been studied extensively, although the results of these studies have been inconclusive. In 2013, a large Swedish cohort study found that long-term exposure to fluoride of 2.7 mg/L was not associated with hip fracture.24 A 2015 meta-analysis found that chronic exposure to fluoride in drinking water did not markedly increase the risk of hip fractures in adults.25 Other work has found fluoride to increase bone mineral density in adults and low doses of fluoride (</ = 20 mg/d) to be protective against vertebral and hip fractures.26 However, a 2021 Swedish study of postmenopausal women found that chronic low-dose fluoride exposure (<1.5 mg/L) was associated with both increased bone mineral density and fragility fractures.13
There has been little research investigating the effects of fluoride on bone in the pediatric population.27 It has been established that children retain more fluoride in bones than adults do, but the implications of this are unknown.12 Previous work has shown a relationship between skeletal fragility and fracture risk in children.28 Developing a better understanding of the effect of community water fluoridation on pediatric bone health could better inform public health guidelines in the future, such as adjusting recommended water fluoride levels or providing a basis for the recommendation of calcium supplementation.
The major limitation to this study relates to inferences of the population based on sampling. The PearlDiver database is a randomly selected sampling of Medicaid and most private insurance companies. Although the database likely represents an adequate cross-sectional sampling of all pediatric patients, one weakness of the study is a sampling error resulting in different capture rates of children with different insurance types. Similarly, the data inferred from the US Census Bureau and CDC are prone to sampling error. Despite these limitations, we think that the retrospective use of best available representative large databases can explore population-based questions. Our study design resembles a natural experiment design and is useful when an exposure of interest is not possible to be assigned to research subjects, either practically or ethically. In evaluating the effect of fluoridation, a control group cannot be created easily because most communities are already exposed to fluoridated water sources. Furthermore, a prospective randomized study cannot be done when a condition is rare (177.3 per 100,000 population), and a notable portion of the population is already receiving fluoridated water. It is important to recognize that SCHF data were available only at the state level and there was substantial variation in fluoride rates by county, making it somewhat difficult to draw conclusions based on our data.
The constraints in our database prevent us from specifically studying or excluding children with malnutrition, malabsorption, bone disease, or other chronic disease. We are also unable to identify those who take calcium or vitamin D regularly. Pediatric bone health is a complex, nuanced topic, and a notable limitation of this study is a lack of granularity regarding other factors that may contribute to pediatric fragility fractures. In addition, we do not have the ability within this database to classify whether fractures sustained were fragility fractures, although this would be an interesting area of future study.
Previous work has established that the effects of fluoride on bone and other tissues are dependent on genetic factors.29–31 Although genetic susceptibility to fluoride exists, we think that the diverse population base in the United States minimizes these effects compared with studying a small region of the world where a more homogeneous genetic composition might be expected. In addition, many factors influence bone density and health, including other important nutrients, activity level, and genetics. Because this is a large population-based study based on administrative data, a multivariate analysis of all possible bone health factors is not feasible. However, because it is a large population-based study sampling Medicaid and private insurance population in United States, we expect random distribution of these other factors.
We propose simply an association worth considering as both percentage and dose-dependent concentration of fluoride are associated with fracture rate. We note that measured fluoride levels in community drinking water do not indicate fluoride levels in a patient, and we do fully capture levels of fluoride exposure in this study. We do not imply causality based off of these findings, and we suggest that additional studies be done to investigate this possible relationship between pediatric bone health and fluoride. Although there are numerous studies on fluoridation and effects of fracture on adults, very few studies address children's bone health. It is possible that growing bone will have a different response to fluoride intake compared with adult bone. In this study, we present a novel approach in examining this epidemiologic question at a national level with a common pediatric fracture type.
ConclusionsIn the PearlDiver data cohort, community water fluoridation proportion by both state and fluoridation levels are associated with the increased rate of fracture in children aged 4 to 10 years. This research suggests that more studies are needed to further define issues such as correlation with other fractures and determination of the critical level of fluoridation in growing bone.
References 1. Palmer C, Wolfe SH, American Dietetic Association: Position of the American Dietetic Association: The impact of fluoride on health. J Am Diet Assoc 2005;105:1620-1628. 2. Griffin SO, Regnier E, Griffin PM, Huntley V: Effectiveness of fluoride in preventing caries in adults. J Dent Res 2007;86:410-415. 3. Ciosek Ż, Kot K, Kosik-Bogacka D, Łanocha-Arendarczyk N, Rotter I: The effects of calcium, magnesium, phosphorus, fluoride, and lead on bone tissue. Biomolecules 2021;11:506. 4. Solanki YS, Agarwal M, Gupta AB, Gupta S, Shukla P: Fluoride occurrences, health problems, detection, and remediation methods for drinking water: A comprehensive review. Sci Total Environ 2022;807:150601. 5. Kheradpisheh Z, Mirzaei M, Mahvi AH, et al.: Impact of drinking water fluoride on human thyroid hormones: A case-control study. Sci Rep 2018;8:2674. 6. Kheradpisheh Z, Mahvi AH, Mirzaei M, et al.: Correlation between drinking water fluoride and TSH hormone by ANNs and ANFIS. J Environ Health Sci Eng 2018;16:11-18. 7. Thippeswamy HM, Devananda D, Nanditha Kumar M, Wormald MM, Prashanth SN: The association of fluoride in drinking water with serum calcium, vitamin D and parathyroid hormone in pregnant women and newborn infants. Eur J Clin Nutr 2021;75:151-159. 8. Barbier O, Arreola-Mendoza L, Del Razo LM: Molecular mechanisms of fluoride toxicity. Chem Biol Interact 2010;188:319-333. 9. Mohammadi AA, Yousefi M, Yaseri M, Jalilzadeh M, Mahvi AH: Skeletal fluorosis in relation to drinking water in rural areas of West Azerbaijan, Iran. Sci Rep 2017;7:17300. 10. Aslani H, Zarei M, Taghipour H, Khashabi E, Ghanbari H, Ejlali A: Monitoring, mapping and health risk assessment of fluoride in drinking water supplies in rural areas of Maku and Poldasht, Iran. Environ Geochem Health 2019;41:2281-2294. 11. Yousefi M, Ghoochani M, Hossein Mahvi A: Health risk assessment to fluoride in drinking water of rural residents living in the Poldasht city, Northwest of Iran. Ecotoxicol Environ Saf 2018;148:426-430. 12. Dhar V, Bhatnagar M: Physiology and toxicity of fluoride. Indian J Dent Res 2009;20:350. 13. Helte E, Donat Vargas C, Kippler M, Wolk A, Michaëlsson K, Åkesson A: Fluoride in drinking water, diet, and urine in relation to bone mineral density and fracture incidence in postmenopausal women. Environ Health Perspect 2021;129:47005. 14. U.S. Census Bureau, U.S. Census Data: Census.gov. Available at: https://www.census.gov/data. Accessed December 11, 2021. 15. Centers for Disease Control and Prevention: CDC - MWF - My Water’s Fluoride Home. Available at: https://nccd.cdc.gov/doh_mwf/default/default.aspx. Accessed December 11, 2021. 16. Liu S, Zhou H, Liu H, Ji H, Fei W, Luo E: Fluorine-contained hydroxyapatite suppresses bone resorption through inhibiting osteoclasts differentiation and function in vitro and in vivo. Cell Prolif 2019;52:e12613. 17. Daiwile AP, Tarale P, Sivanesan S, et al.: Role of fluoride induced epigenetic alterations in the development of skeletal fluorosis. Ecotoxicol Environ Saf 2019;169:410-417. 18. Mousny M, Omelon S, Wise L, et al.: Fluoride effects on bone formation and mineralization are influenced by genetics. Bone 2008;43:1067-1074. 19. Rezaee T, Bouxsein ML, Karim L: Increasing fluoride content deteriorates rat bone mechanical properties. Bone 2020;136:115369. 20. Simon MJK, Beil FT, Rüther W, et al.: High fluoride and low calcium levels in drinking water is associated with low bone mass, reduced bone quality and fragility fractures in sheep. Osteoporos Int 2014;25:1891-1903. 21. Everett ET: Fluoride's effects on the formation of teeth and bones, and the influence of genetics. J Dent Res 2011;90:552-560. 22. US Department of Health and Human Services Federal Panel on Community Water Fluoridation: U.S. public health service recommendation for fluoride concentration in drinking water for the prevention of dental caries. Public Health Rep 2015;130:318-331. 23. O'Mullane DM, Baez RJ, Jones S, et al.: Fluoride and oral health. Community Dent Health 2016;33:69-99. 24. Näsman P, Ekstrand J, Granath F, Ekbom A, Fored CM: Estimated drinking water fluoride exposure and risk of hip fracture: A cohort study. J Dent Res 2013;92:1029-1034. 25. Yin XH, Huang GL, Lin DR, et al.: Exposure to fluoride in drinking water and hip fracture risk: A meta-analysis of observational studies. PLoS One 2015;10:e0126488. 26. Vestergaard P, Jorgensen NR, Schwarz P, Mosekilde L: Effects of treatment
留言 (0)