
記住我


Training and validation cases were retrospectively obtained with institutional review board approval from Fujita Health University Hospital and Kansai Medical University Medical Center. Both institutions received research grants from Canon Medical Systems.
The test study was a retrospective study approved by the certified review board of Fujita Health University Hospital, which served as the coordinating center, and subsequently approved by the directors of Jichi Medical University Saitama Medical Center and St. Marianna University School of Medicine prior to site initiation. This study was compliant with the Health Insurance Portability and Accountability Act, written informed consent was waived, and it was technically and financially supported by Canon Medical Systems Corporation. Moreover, this study was financially supported by Grants-in-Aid for Scientific Research from the Japanese Ministry of Education, Culture, Sports, Science and Technology (JSTS.KAKEN; No. 18K07675 and JSTS.KAKEN; No. 20K08037) and the Smoking-Research Foundation. Six of the authors, K.A., Ko. Ao., Y.I., S.K., A.T. and N.S., are employees of Canon Medical Systems Corporation (Otawara, Tochigi, Japan) who did not have control over any of the data used in this study. Two employees of Micron, Inc., (Tokyo, Japan), which is an international clinical research organization (CRO), handled all data, and performed all statistical analyses independently from the authors.
SubjectsTraining and validation casesAs the training set for this study, 656 cases obtained between March 2020 and March 2021 from Fujita Health University and Kansai Medical University Medical Center were included. These cases comprised 384 males (55 ± 22 years, age range 10–94 years) and 272 females (53 ± 22 years, age range 11–96 years) with COVID-19 pneumonia (n = 191) and non-COVID-19 pneumonia (n = 465). Another 137 cases were selected as the validation set from Fujita Health University by applying the same inclusion criteria as for selecting the test cases. For the validation set, 137 cases were selected, consisting of 62 males (50 ± 20 years, age range 15–85 years) and 75 females (49 ± 20 years, age range 18–85 years) with COVID-19 pneumonia (n = 28) and non-COVID-19 pneumonia (n = 109).
Test casesThe patients originally included were recruited between January 2020 and June 2021 at Jichi Medical University Saitama Medical Center (institution A) and St. Marianna University School of Medicine (institution B). Their radiologists did not perform any image studies or statistical analyses for this study. Institution A was placed in the prefecture without collapse of the medical system, and institution B was placed in the prefecture with collapse of the medical system. The inclusion criteria for the trial were patients (1) with suspected COVID-19 infection whose chest CT and RT-PCR for SARS-CoV-2 had been obtained from a pharyngeal or nasopharyngeal swab specimen, (2) whose RT-PCR examinations for SARS-CoV-2 were performed and data collected within 6 days from chest CT examination, and (3) whose initial chest CT data had been obtained from an unenhanced CT of the entire lung performed with a CT system provided by Canon Medical Systems and reconstructed with a section thickness and gap equal to or less than 1.0mm and a high frequency algorithm, and using two lung kernels (FC51 and FC52, Canon Medical Systems) by means of filter back projection (FBP) or hybrid-type iterative reconstruction (adaptive dose reduction using 3D processing [AIDR 3D], Canon Medical Systems). The exclusion criteria were patients (1) who had undergone a lobectomy, (2) who had suffered lobar atelectasis, (3) with intubation of the trachea, (4) whose CT examination results showed severe artifacts due to body movement, (5) without any data sheets, and (6) who refused to be included in this study.
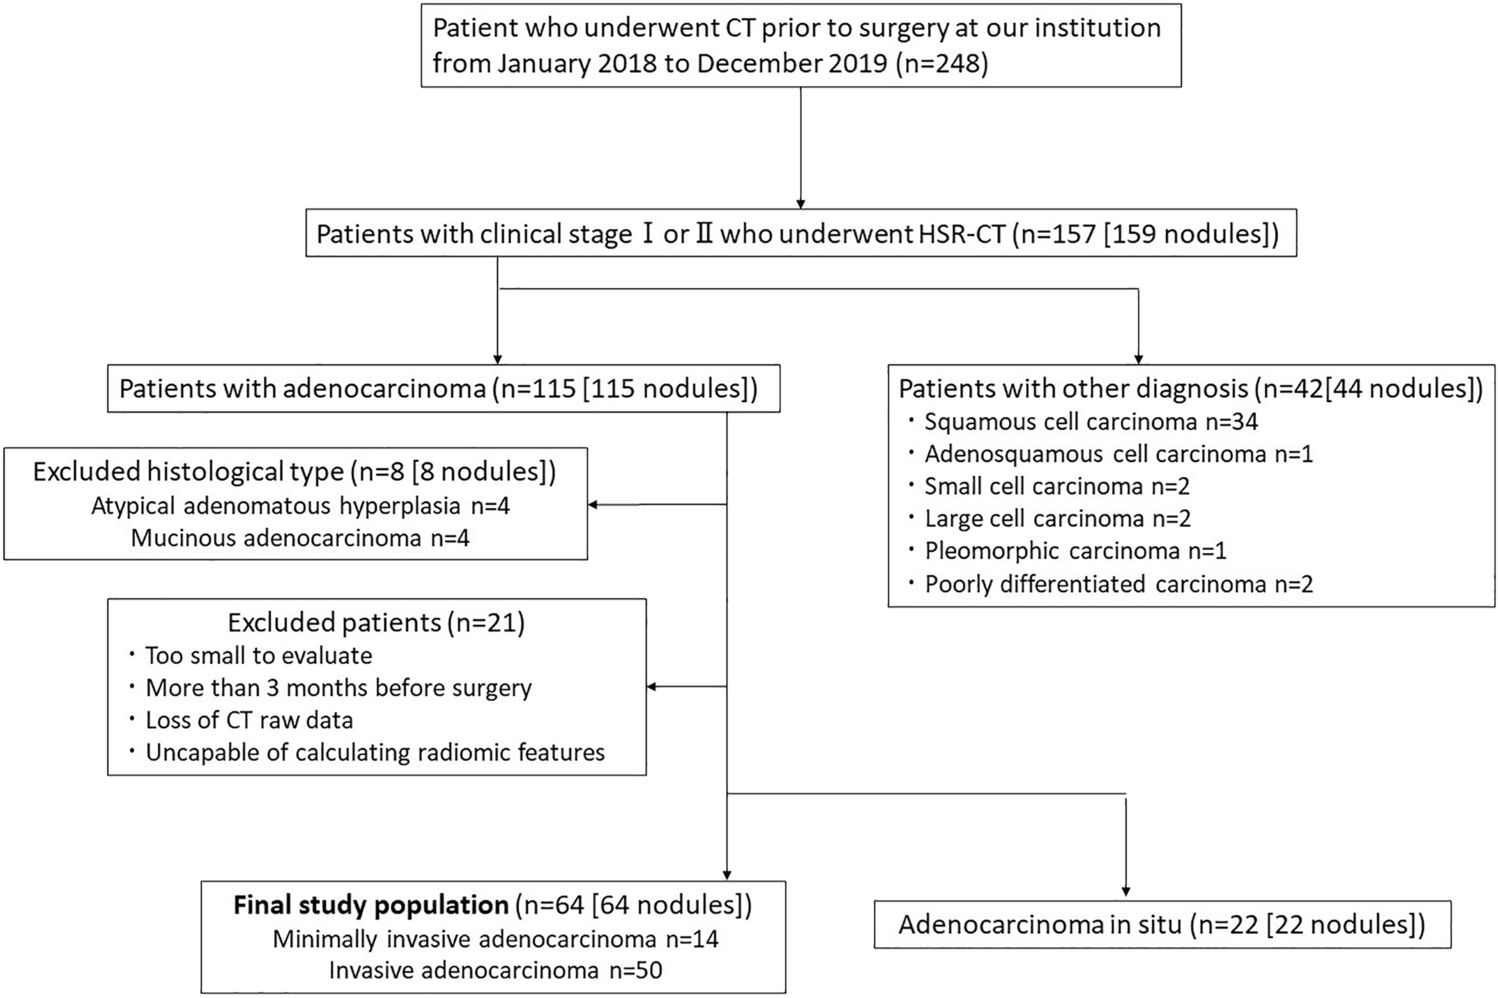
Of the total of 239 patients consisting of 162 males (66 ± 17 years, age range 16–96 years) and 77 females (68 ± 16 years, age range 21–92 years) originally included in this study, 65 were excluded due to (i) CT data not matching with inclusion criteria (n = 22), (ii) no data sheets (n = 19), (iii) severe artifacts due to body motion (n = 11), (iv) intubation of the trachea (n = 9), (v) lobar atelectasis (n = 3), and (vi) lobectomy (n = 1). The final study cohort comprised 174 patients consisting of 120 males (67 ± 16 years, age range 21–96 years) and 54 females (68 ± 16 years, age range 21–92 years), and 87 positive and 87 negative RT-PCR results. In this study, 87 non-COVID-19 cases consisted of cardiac, liver, or renal dysfunction (n = 37), malignant tumor with and without lung metastasis or lymphangitis carcinomatosis (n = 20), other infectious diseases (n = 18) due to bacterial (n = 7) and viral (n = 5) infections, mycobacterial infection (n = 4), and pulmonary tuberculosis (n = 2), interstitial lung disease (n = 7), organizing pneumonia (n = 3), and asthma (n = 2). The flow chart for patient selection is shown in Fig. 1, and details of patient characteristics are listed in Table 1.
Fig. 1
Patient flow chart. A total of 239 patients were originally included in this study, and 65 patients were excluded for the reasons detailed in the figure, so that eventually 174 patients were included in this study
Table 1 Patient characteristics and statistical differences between two institutions with and without collapse of medical systemCT examinationsThe CT data were obtained with two 80-, one 160- and one 320-detector row CT scanners (Aquilion PRIME, Aquilion Precision and Aquilion ONE; Canon Medical Systems, Otawara, Tochigi, Japan). The following numbers of patients were scanned with one of the CT systems: 80-detector row CT, 649; 160-detector row CT, 3; and 320-detector row CT, 4. CT examinations were performed with unenhanced CT with helical scanning by using the following parameters: 64–80 × 0.5 mm collimation, auto mA with image standard deviation (SD) ranged between 8 and 13, 120 kVp, 0.813–0.891 beam pitch, 0.35–0.5 s gantry rotation time, 512 × 512 matrix, and 234–410 mm field of view. All thin-section CT data were then reconstructed with filtered back projection or hybrid iterative reconstruction (AIDR 3D: Canon Medical) method in contiguous section thicknesses of 0.5 mm or 1 mm and then used for generating the lung reconstruction kernel as FC51 or FC52 (Canon Medical). The estimated volume computed tomography dose index (CTDIvol) displayed on the CT scanner console was recorded for each patient. These values were based on the weighted computed tomography dose index (CTDIw [e.g., tube voltage or tube current]). CTDIvol obtained in this study was assessed as 10.63 ± 5.22 (mean ± SD) mGy and ranged from 2.7 to 33.6 mGy. The estimated dose length product (DLP) was calculated as CTDIvol × scan length, which was determined as 91–1900 mGy × cm, with the effective dose for this protocol estimated at 1.27–26.60 mSv. All CT examinations were performed with breath holding at full inspiration.
For the test cases, all CT data were obtained with two 64-, one 80-, and two 320-detector row CT scanners (Aquilion 64, Aquilion PRIME and Aquilion ONE, respectively; Canon Medical Systems, Otawara, Tochigi, Japan). Sixty-nine patients were scanned with the 64-detector row CT, 84 with the 80-detector row CT, and 21 with the 320-detector row CT. CT examinations were performed with unenhanced CTs with helical scanning using the following parameters: 64–80 × 0.5 mm collimation, auto mA with image standard definition (SD) ranged between 7 and 15, 120 kVp, 0.81–0.89 beam pitch, 0.35–0.5 s gantry rotation time, 512 × 512 matrix and 320–500 mm field of view. All thin-section CT data were then reconstructed with filtered back projection or hybrid iterative reconstruction (AIDR 3D: Canon Medical) in contiguous section thicknesses of 0.5 mm or 1 mm and used for generating the lung reconstruction kernels as FC51 or FC52 (Canon Medical). The estimated volume computed tomography dose index (CTDIvol) displayed on the CT scanner console was recorded for each patient. These values were based on the weighted computed tomography dose index (CTDIw [e.g., tube voltage or tube current]). CTDIvol obtained in this study was assessed as 14.4 ± 9.1 (mean ± SD) mGy and ranged from 3.4 to 35.3 mGy. The estimated dose length product (DLP) was calculated as CTDIvol × scan length, which was determined as 113.7–1482.6 mGy × cm, with the effective dose for this protocol estimated at 1.6–20.8 mSv. All CT examinations were performed with breath holding at full inspiration. Details of the unenhanced CT protocol can be found in Table 2.
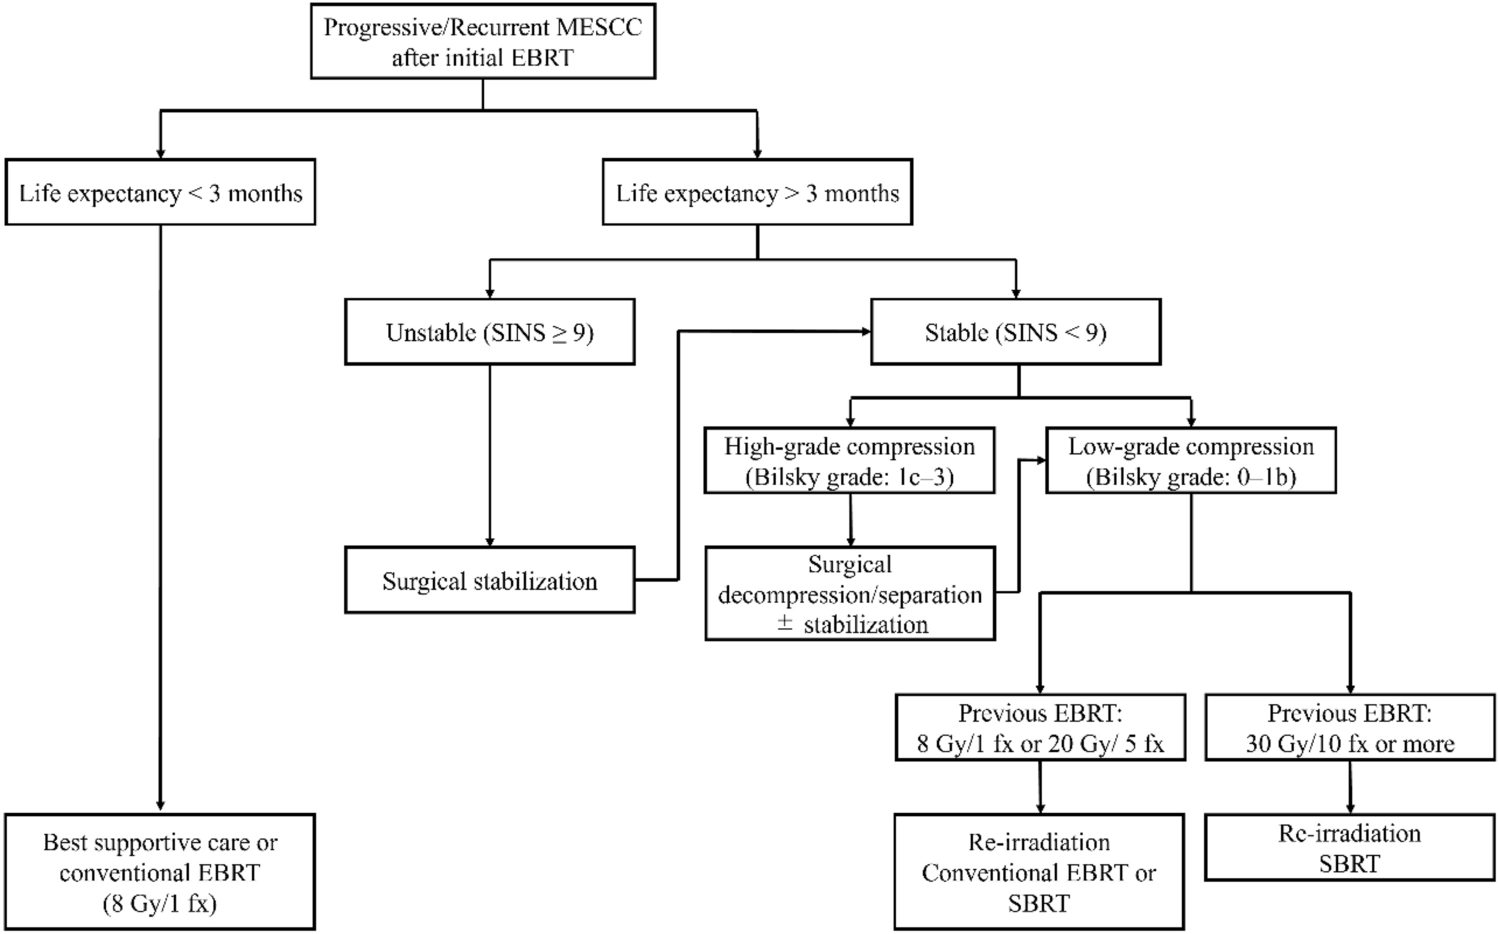
Table 2 CT protocols for multi-center and multi-reader studiesMachine-learning CAST softwareFigure 2 shows the flow chart of the ML-based software for CAST. Given the chest CT volume data as input, it classifies each voxel into seven radiological texture patterns. This process is called texture extraction. The results of the texture extraction are then used to determine ten radiological findings related to COVID-19 pneumonia as described in the RSNA Expert Consensus Statement system [7, 8]. This process is known as image findings classification. Finally, image appearance is classified into four categories. This categorization yields the final classification of positive and negative for COVID-19 pneumonia.
Fig. 2
Flow chart for machine-learning-based CAST software. When given a chest CT volume datum as input, the software segments the lung region and the lung lobes automatically in the processing stage. The resultant lung and lobe masks are then used in the subsequent texture extraction and image findings classification stages. In the texture extraction stage, the likelihood of occurrence of one of seven texture patterns is calculated for every single voxel: (1) normal lung, (2) ground-glass opacity, (3) reticulation, (4) emphysema, (5) nodular lesion, (6) consolidation, and (7) honeycombing. The multi-class support vector machine is then used to calculate the probability of occurrence of each texture pattern for each voxel. Finally, each voxel is labeled with a specific texture pattern with the highest probability of occurrence. In the image finding classification stage, the typical image findings information defined in the RSNA COVID-19 report format is determined by an image analysis algorithm. This algorithm identifies the quantity of GGO and its morphology, as well as reticulation, consolidation, nodular lesion, anatomical location and the positional relationship among each of the textures to identify the typical image findings for COVID-19. The COVID-19 classification algorithm is based on the Random Forest machine learning model for classification of the probability of COVID-19 pneumonia occurrence using the findings obtained in the previous stage. This algorithm is used to classify each CT data set into four patterns: (1) typical (2) indeterminate, (3) atypical, and (4) negative for pneumonia
PreprocessingGiven chest CT volume data as input, the software automatically segments the lung region and the lung lobes. The resultant lung and lobe masks are then used in the subsequent texture extraction and image findings classification.
Texture extractionFor this stage, the likelihood of occurrence of one of seven texture patterns is calculated for every single voxel: (1) normal lung, (2) ground-glass opacity, (3) reticulation, (4) emphysema, (5) nodular lesion, (6) consolidation, and (7) honeycombing. The extremely randomized trees method is used to calculate the likelihood of occurrence of all the textures except nodular lesion, for which the radial structured tensor method is used. The multi-class support vector machine is then used to calculate the probability of occurrence of each texture pattern for every voxel. Finally, each voxel is labeled with a specific texture pattern with the highest probability of occurrence. Details of the texture extraction algorithm can be found in the literature [22,23,24].
Image findings classificationThis step calculates the typical image findings defined in the RSNA COVID-19 report format and determined by an image analysis algorithm. This texture information for each voxel obtained in the previous step is then used to calculate the image findings information. In particular, the algorithm identifies the quantity of GGO and its morphology, as well as reticulation, consolidation, nodular lesion, anatomical location, and the positional relationship among each of the texture to identify the typical image findings for COVID-19.
COVID-19 classificationThe image analysis algorithm is used for COVID-19 pneumonia imaging classification according to the RSNA classification system for COVID-19 pneumonia into four patterns: (1) typical (2) indeterminate, (3) atypical, and (4) negative for pneumonia [7, 8]. The algorithm is based on the Random Forest machine learning model for classification of the probability of COVID-19 pneumonia occurrence using the findings obtained in the previous step.
Image analysisAll CAST evaluations with ML-based CAST software were performed on a workstation (Vitrea, Canon Medical Systems). All qualitative image analyses were performed on an image reading system (IRUMneo Report, Micron, Inc., Tokyo, Japan). All investigators involved in this study reviewed all CT data without having access to any information about clinical symptoms, RT-PCR data or results of ML-based CT texture analysis and CAST.
Diagnosis of COVID-19 pneumonia and subtype classification based on the RSNA expert consensus statement system performed with ML-based CAST software, by consensus evaluation, and by each investigatorFor diagnosis of COVID-19 pneumonia and subtype classification for each patient based on the RSNA expert consensus statement system, three board-certified chest radiologists (M.E., H.K., and H.M.) with 20-, 31-, and 40-year experience, respectively, reviewed data obtained with unenhanced CT with the level of the lung window set at -550HU and the width at 1600HU. First, the three investigators evaluated each CT data set based on the RSNA expert consensus statement system into three categories: (1) positive (typical or indeterminate), (2) atypical, and (3) negative cases. Second, diagnosis of COVID-19 pneumonia in each case was assessed as positive or negative (atypical or negative). Third, a qualitative CT severity scoring method introduced by Pan et al. [25] was used to calculate the extent of anatomic involvement for each of the 5 lobes as: 0, no involvement; 1, < 5% involvement; 2, 5–25% involvement; 3, 26–50% involvement; 4, 51–75% involvement; and 5, > 75% involvement. The resultant global CT score was then calculated by summing the individual lobar scores with a possible range of a minimum of 0 to a maximum of 25. In each case, the final category based on the RSNA expert consensus statement and diagnosis of COVID-19 pneumonia was established by majority agreement among the three investigators. When a case was assessed as a different category by each of the investigators and none of them could determine each final evaluation based on majority category in some cases, another board-certified chest radiologist (T.A.) with a 32-year experience, who performed as a central reviewer for this study, assessed the final category without any information about clinical symptoms, RT-PCR data, results of ML-based CT texture analysis, ML-based CAST software or the three investigators’ evaluation results for these cases. Moreover, the final qualitative CT severity score in each case was determined as the average of the values obtained from the three investigators.
Agreements for CT texture analysis of ML-based CAST software and three other investigatorsFor determination of agreement between findings obtained with ML-based CT texture analysis and by three other board-certified chest radiologists (T.H., F.O. and H.S.) with 8-, 25-, and 33-year experience, respectively, the same board-certified chest radiologist who acted as a central reviewer selected 305 slices with 6 different lung structures from 196 cases based on the glossary of the Fleischner Society [21], namely (i) consolidation, (ii) emphysema, (iii) ground-glass opacity (GGO), (iv) honeycombing, (v) nodular lesion, and (vi) reticulation. From the 305 slices, 156 were randomly selected to determine agreements between findings obtained with ML-based CT texture analysis and by the three investigators. Without any information about results determined by the central reviewer, the three chest radiologists then assessed the results for ML-based CT texture analysis of each radiological finding with the following 5-point scoring system: (1) true positive and agreement on ML-based CT texture analysis results for a targeted structure (i.e., analysis of results for a targeted area within the ROI as more than 80%), (2) true positive and agreement on ML-based CT texture analysis results for a targeted structure (i.e., analysis of results for a targeted area as more than 60% and equal to or less than 80% within ROI), (3) true positive but disagreement on ML-based CT texture analysis results for a targeted structure (i.e., displayed analysis results for targeted area within the ROI as equal to or less than 60%), (4) true negative and agreement on ML-based texture analysis results for a targeted structure, and (5) false positive and disagreement on ML-based texture analysis results for a targeted structure.
Statistical analysisTo determine the influence of collapse of the medical system on the results of this study, characteristics of patients from the two institutions in the test cohort were compared by two-tailed t-test or Wilcoxon’s signed rank test.
Agreements between findings obtained with CAST software and by each investigator or between those by each investigator for all cases and for cases provided by either institution, as well as inter-observer agreements between those obtained with CAST software and by each investigator, were determined by using Cohen’s kappa statistics with χ2 test, and inter-rater agreement among all investigators by means of Fleiss’ kappa statistics.
For comparison of diagnosis for COVID-19 pneumonia of all cases based on RT-PCR between ML-based CAST software and consensus evaluation or individual investigator’s evaluations, as well as of all cases with COVID-19 pneumonia findings on CT and cases provided by each institution, sensitivity, specificity, and accuracy of the diagnoses were compared by McNemar’s test.
To determine agreement for each radiological finding evaluation of all slices between ML-based CT texture analysis performed with CAST software and by each investigator, inter-rater agreement among all investigators was evaluated by means of Fleiss’ kappa statistics.
For comparison of the accuracy for each radiological finding obtained with the ML-based CT texture analysis on CAST software and by each investigator, the number of true-positive ROIs was divided by all ROIs. Accuracy for each lung radiological finding evaluation was then compared using McNemar’s test.
All Cohen’s and Fleiss’s kappa statistics were assessed based on past literatures [26,27,28,29]. For all Cohen’s kappa statistics, all inter-observer agreements were rated as no agreement for κ = 0, slight for 0 < κ < 0.21, fair for κ = 0.21–0.40, moderate for κ = 0.41–0.60, substantial for κ = 0.61–0.80, and almost perfect for κ = 0.81–1.00 [26]. For all Fleiss’s kappa statistics, all inter-rater agreements were rated as no agreement for κ < 0, slight for κ = 0.01–0.20, fair for κ = 0.21–0.40, moderate for κ = 0.41–0.60, substantial for κ = 0.61–0.80, and almost perfect for κ = 0.81–1.00 [27,28,29].
For all statistical analyses using commercially available software (JMP 14: SAS Institute Japan, Co. Ltd., Tokyo, Japan; StatMate III: Atoms Co. Ltd., Tokyo, Japan; R: R Foundation for Statistical Computing, Vienna, Austria; and EZR: Saitama Medical Center, Jichi Medical University, Saitama, Japan), a p value less than 0.05 was considered statistically significant.
留言 (0)