
記住我

We use data of the BIBB/BAuA Youth Employment Survey 2012 (Jugenderwerbstätigenbefragung, J-ETB), a cross-sectional study conducted by the Federal Institute for Vocational Education and Training (BIBB) and the German Federal Institute for Occupational Safety and Health (BAuA) (Schmiederer 2015). The J-ETB is a representative sample of employees, apprentices, and trainees between the ages of 15 and 24 years, who work or are currently in training for at least 10 h per week. Study participants were selected based on landline and mobile phone numbers (dual framing approach) following a multi-stage sampling process, in which a random sample of households was drawn and individuals in these households were selected. Individuals were not interviewed, if they only reported volunteer work or if they did not speak German sufficiently. Computer-Assisted Telephone Interviews (CATI) were carried out from October 2011 to March 2012 by trained interviewers. The response quote among eligible persons was 48.3%.
Study sampleThe initial sample included 3214 workers. We excluded 56 participants reporting more than 70 days of sickness during the past year to avoid bias resulting from chronic health problems. Furthermore, we excluded 16 solo self-employed because company characteristics were not assessed in this group. Finally, the study sample used for the following analyses comprises of 3142 workers.
VariablesHealth measuresWe used four health indicators. First, self-rated health was assessed by asking the question “How would you describe your general state of health?” followed by a five-point Likert response format (poor, less good, good, very good, excellent). Second, we assessed the number of days with a health event in the past year by combining the number of self-reported sickness absence and sickness presence days by building a sum score (Gerich 2015):
This approach takes into account that workers differ in their likelihood to opt for presenteeism, which is continuing to work despite being ill or feeling unwell (Reuter et al. 2021). Third, participants were presented a list of seven symptoms of musculoskeletal disorders (i.e., pain in back, neck/shoulder, arms, hand, hips, knees, legs/feet) and five symptoms of mental health problems (i.e., sleep disturbances, tiredness/faintness/fatigue, nervousness/irritability, low mood, emotional exhaustion) and they were asked to indicate whether they experienced each of them during work or working days in the past 12 months (a list is to find in the Appendix, e-Table 1). We constructed a sum score for symptoms of musculoskeletal disorders (7 items, Cronbach’s alpha = 0.68) and a sum score for symptoms of mental disorders (5 items, Cronbach’s alpha = 0.72).
School educationThe level of school education was used as an indicator of respondents’ socio-economic position. We did not consider vocational or university degrees because parts of young workers were still in training, while school education was generally completed when being surveyed. We calculated a variable indicating the years of education equivalent to the school-leaving certificate (range 9–13) and distinguished between low (< 12 years) and high education (≥ 12 years), dividing between lower and higher secondary school education. As some individuals younger than 18 years were not yet able to graduate from higher secondary school, we controlled for this possible selection bias by adjusting for participant’s age in all multivariable analyses (restricting the sample to participants aged 18 years or older yielded identical results).
Job demandsJob demands at the individual-level were assessed through a validated questionnaire comprised of 41 indicators related to six dimensions (ergonomic demands, environmental demands, social support, decision latitude, psychological demands, working time demands) (Kroll 2011; Meyer and Siefer 2021). Ordering of indicators was randomised. We counted the number of demands that workers stated to experience “frequently” during the course of their work (versus “sometimes”, “rarely”, or “never”). For positive items (social support and decision latitude), we counted the absence of a job resource by dichotomising between “never” versus other responses (“rarely”, “sometimes”, “frequently”). We constructed a subscale of physical demands through four indicators of ergonomic and 10 indicators environmental demands (range 0–14, Cronbach’s alpha = 0.81). Psychosocial demands were assessed through six indicators of (low) social support, three indicators of (low) decision latitude, 11 indicators of psychological demands, and seven indicators of working time demands (range 0–21, Cronbach’s alpha 0.64). An overall sum score for the 41 indicators of job demands yielded good internal consistence (Cronbach’s alpha = 0.78). A complete list of job demands and the Cronbach’s alpha for each subscale can be found in the Appendix (e-Table 2).
Company characteristicsCompany characteristics at the meso-level were the company size (number of persons employed in the enterprise), economic situation of the company (assessed as “less than good” or “poor” by the employee or the company owner), whether the company introduced health promotion measures within the past two years, and whether downsizing measures had been carried out in the company within the two past years (staff reduction or dismissals).
Control variablesTo adjust for socio-structural differences between workers with a low versus a high level of education, as well as to control for possible confounding, we considered socio-demographic (age, sex, nationality, region) and work-related covariates (employment relation, weekly working hours, job tenure, economic sector) in all multivariable analyses (described in more detail under “Statistical analysis”). Region is a variable storing information about the workplace location (East Germany, West Germany). The employment relation is a variable describing an individual’s formal labour status (employee, self-employed, apprenticeship or student job). The company’s economic sector was based on the German Classification of Economic Branches 2008 (Klassifikation der Wirtschaftszweige 2008). Working time was used as a variable controlling for variations in exposure time. We considered the contractual working hours for employees and the actual working hours for those who were self-employed. We categorised individuals as either full-time or part-time workers based on the European Labor Force Survey’s definition of part-time work, which refers to a weekly working time below 30 h (OECD 2020). By employing this approach, we mitigated any potential overlap with the “long working hours” indicator used to assess psychosocial job demands.
Missing informationPatterns of missing values in variables of interest are described in the Appendix (e-Table 3). The occurrence of missing values for variables related to health and job demands was minimal, ranging from 0.0% to 2.2%. However, there were slightly higher proportions of missing values observed in the company characteristics variables, ranging from 2.7% to 13.8%. A complete case analysis would result in the loss of 761 observations (23.7%). Little’s MCAR test was positive (Chi-square(1066) = 1751.9, p < 0.001), thus, we decided to impute missing information using chained equations with a predictive mean matching procedure. A comparison of the original versus the imputed data set can be found in the Appendix (e-Table 4).
Statistical analysisFirst, descriptive statistics for all variables by levels of education are presented in Table 1. Second, we studied the association between education and health, as well as between potential mediators and health, each adjusted for control variables in Table 2. Linear regression analysis was used for self-rated health and modified Poisson regression with robust variance estimation for outcomes with count event character (health events, number of musculoskeletal symptoms, number of mental health problems). As to be expected, count variables were skewed and zero-inflated (see Supplementary information, e-Fig. 1). Poisson regression accounts for non-normality of the data while robust variance estimation corrects for heteroscedasticity of residuals (Cameron and Trivedi 2013). Regression estimates were expressed as non-standardised linear regression coefficients for self-rated health and Rate Ratios (RR) for count variables. The RRs indicate the relative difference in the average number of events or symptoms between workers with high and low levels of education. Furthermore, we illustrate the frequency of each of the 41 indicators of physical and psychosocial job demands by the level of education adjusted for covariates. Therefore, we converted regression estimates obtained from Poisson models by a post-estimation command into average adjusted predictions (AAPs) and plotted them along with respective 95% confidence intervals (CI) in Fig. 2 (Williams 2012).
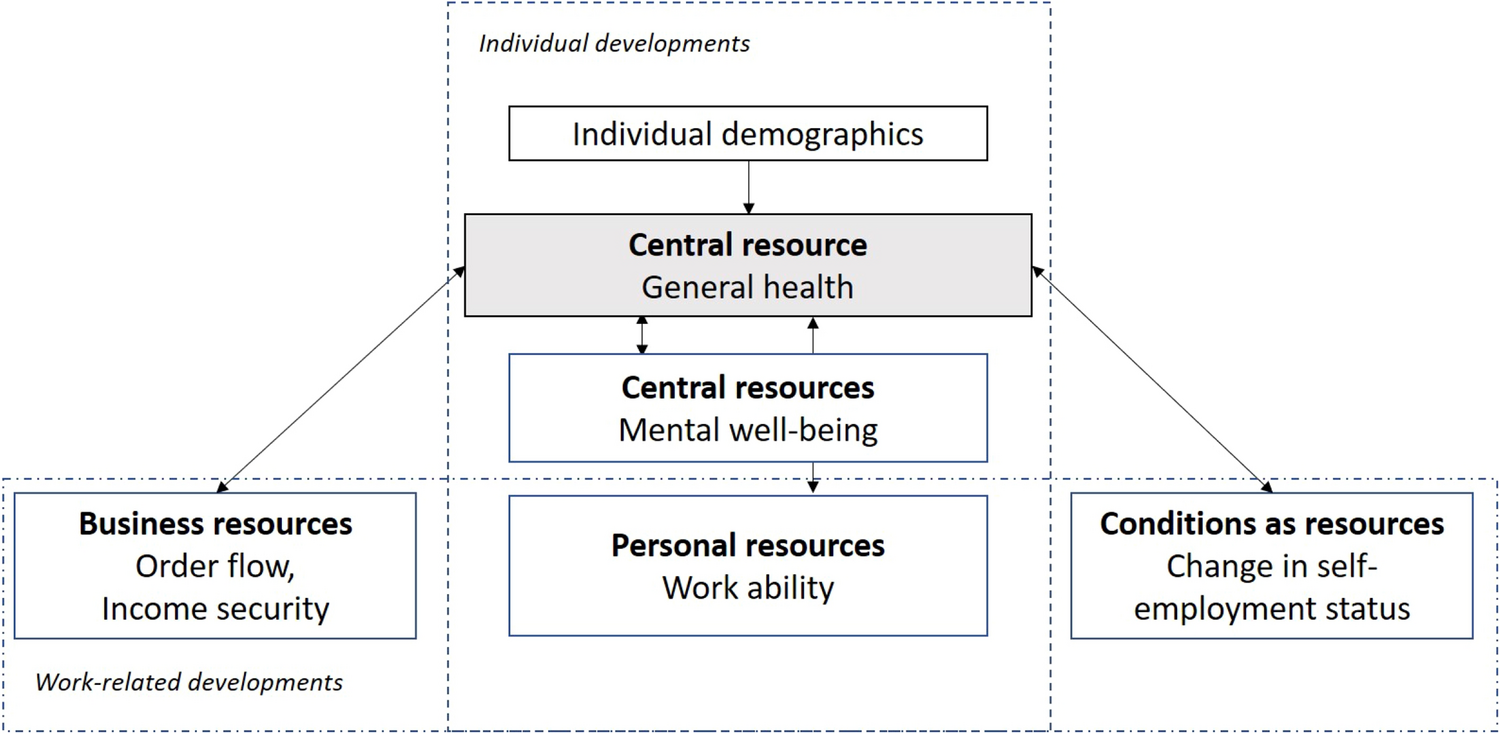
Third, we performed simulation-based mediation analysis within the counterfactual framework to evaluate the role of job demands and company characteristics for health inequalities (Imai et al. 2010). We disentangled the total effect of high versus low education on each health outcome into an indirect effect that went through a mediator and a direct effect that was independent of a mediator (Baron and Kenny 1986). We also controlled for confounding in the relationship between education and health (exposure-outcome confounding), education and job demands or company characteristics (exposure-mediator confounding), and job demands or company characteristics and health (mediator-outcome confounding) (see Fig. 1) (VanderWeele 2016). In addition to socio-demographic characteristics (sex, age, nationality and workplace region), we hold working sectors constant across different levels of education to account for selection processes (i.e., working sectors expose to different levels of physical and psychosocial job tasks) and controlled for different exposure time of job demands by adjusting for working hours, job tenure and the employment relation (full-time jobs, apprenticeships or student jobs).
Fig. 1
Mediator model illustrating the relationship between education, health and the mediator variables (job demands and company characteristics)
Mediation analysis was carried out with Stata’s “mediate” package (Hicks and Tingley 2011). Bootstrapping with 1000 repetitions was used to calculate confidence intervals for effect estimates. A significant indirect effect, indicated by a confidence interval that does not overlap “0”, is used as the criteria for assessing presence of mediation. Furthermore, the percentage mediated was calculated by dividing the indirect effect by the total effect. All analyses were performed using Stata 16.1 MP (64-bit, StataCorp LLC, College Station, TX, USA).
留言 (0)