
記住我
Data was retrieved retrospectively from all 716 patients who received a percutaneous stone removal from 18.02.2009 to 21.09.2020 at the Department of Urology and Urological Surgery at the University Medical Center Mannheim (institutional review board approval 2020-837R).
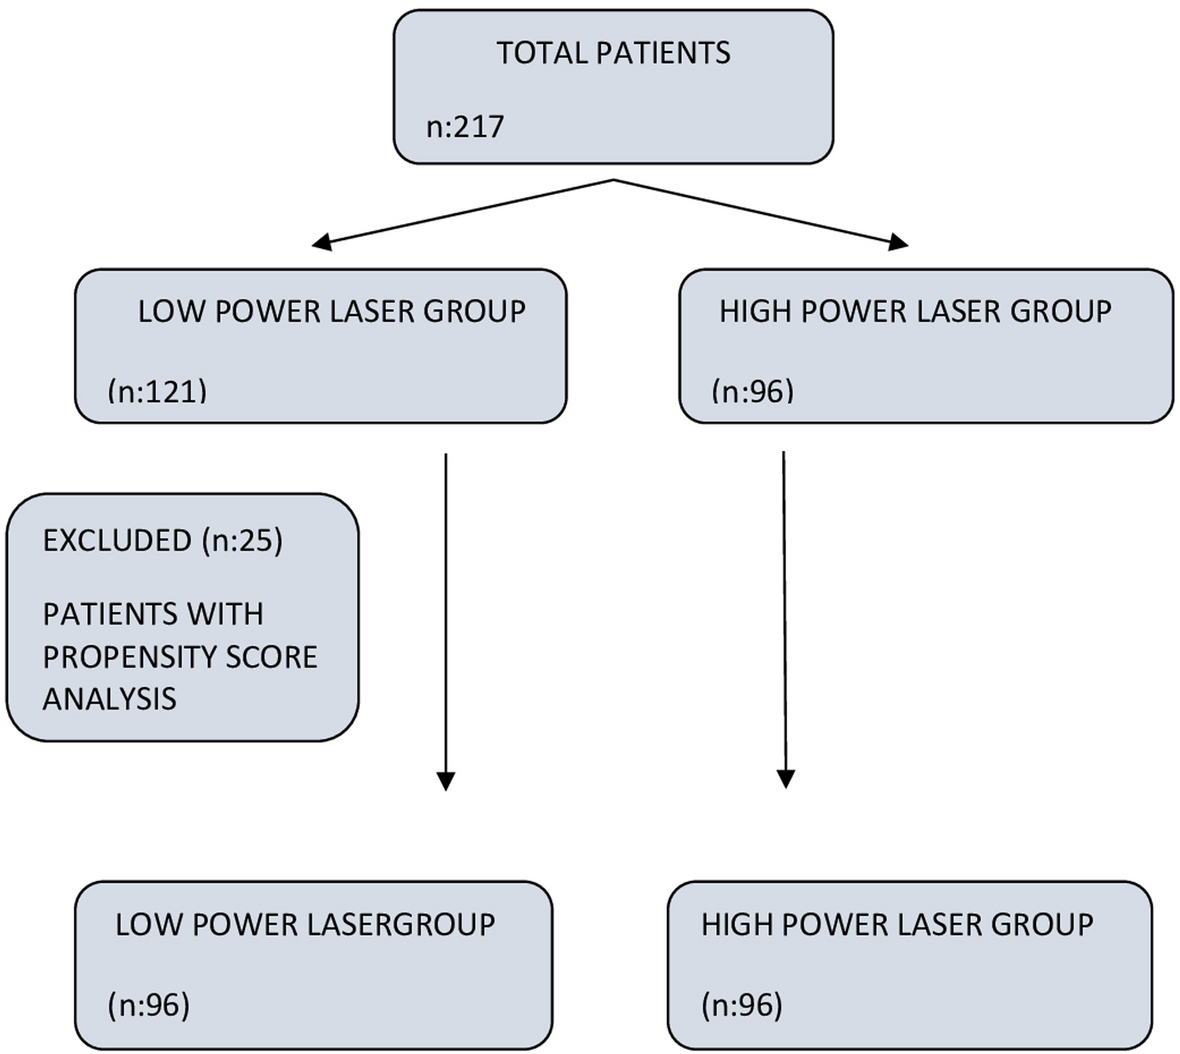
We evaluated preoperative parameters such as age at surgery, body mass index (BMI), gender, American Society of Anesthesiologists (ASA)-Classification, preoperative via CT determined stone characteristics (side, quantity, intrarenal localization, size), the Guy´s stone score (GSS) as well as following intraoperative and postoperative parameters: positioning of the patient, bore size, operating time, surgeon’s intraoperative assessment of SFS, postoperative CT-graphical assessment of SFS after PCNL, reintervention rate and intraoperative assessment of RF size (> 4 mm)/no stone detection) in case of an additional intervention. If, according to postoperative imaging, RF were still present, their location, amount and size were determined. Regarding the size, a distinction was made between significant (> 4 mm) and non-significant (≤ 4 mm) RF. This classification was based on a study by Hubner et al. from 1993 analyzing the incidence of spontaneous stone passage (SPP) relating both stone size and location [15]. The following exclusion criteria were defined: other than prone position, complementary surgery such as URS, missing surgical record, age < 16 years (Fig. 1). PCNL other than in prone position was excluded from this study to provide uniform interventions.
Fig. 1
Out of our collected database, following variables were used for statistical analysis: stone-free-status assessed by the surgeon and according to the postoperative LDCT, size of the RF (< 4 mm), stone free rate after the first procedure and on dismissal.
Only cases with a postoperative CT-graphic classification of RF into significant (> 4 mm) and not significant (≤ 4 mm), as well as an intraoperative assessment by the surgeon into relevant RF (> 4 mm) and no stone detection were considered. No patient in this study had spina bifida or spinal injury and only complete staghorn stones were rated as GSS IV.
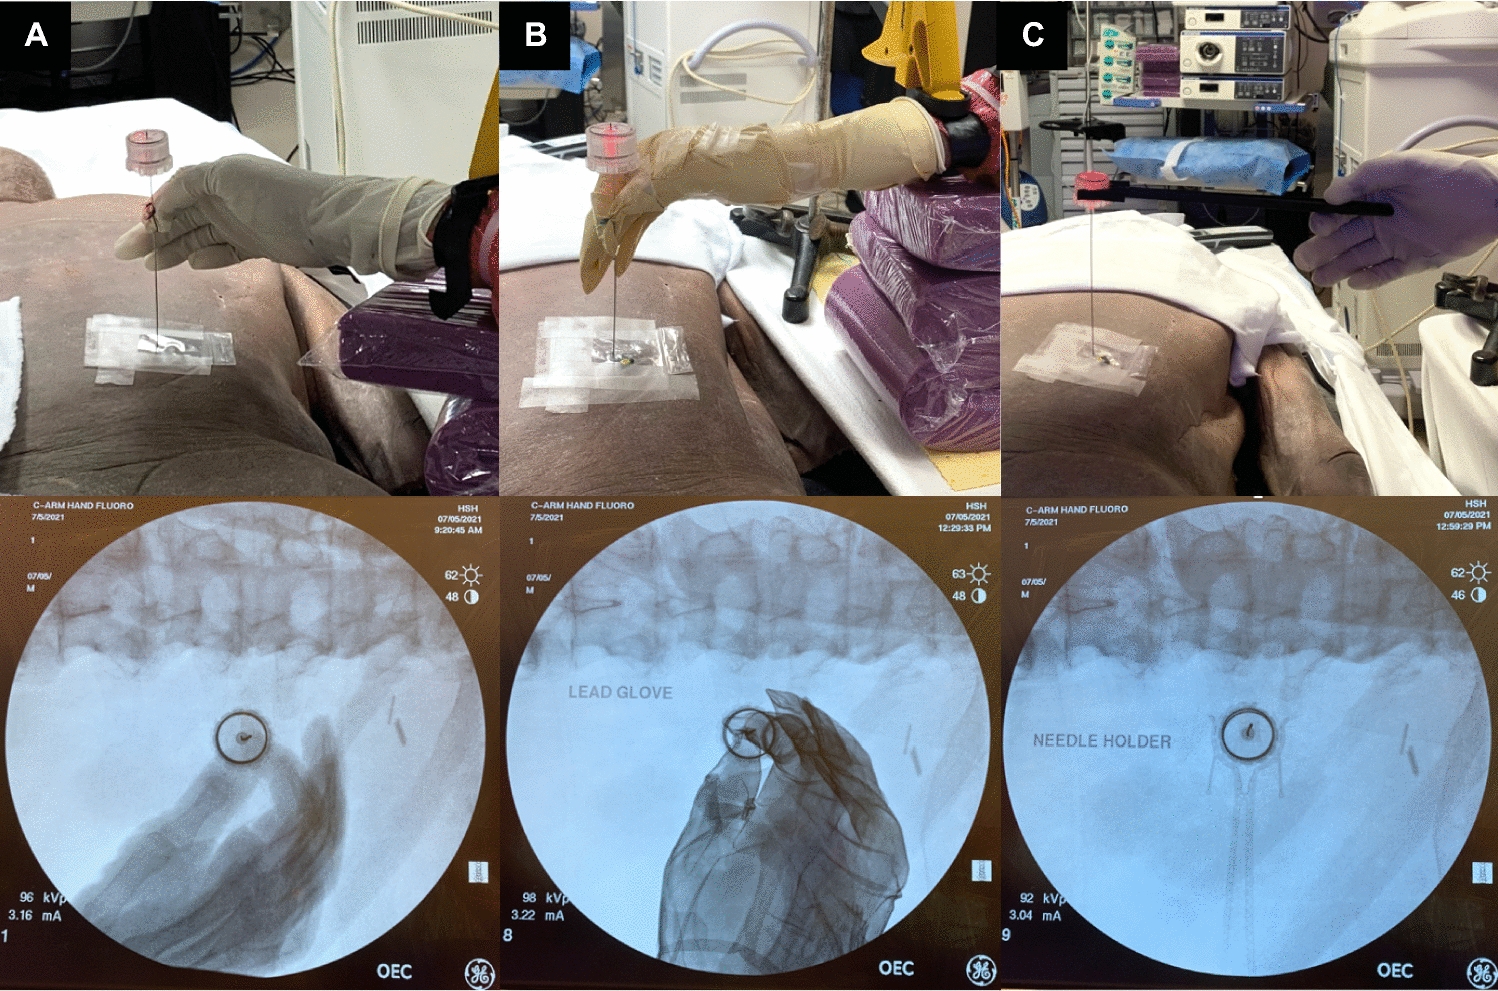
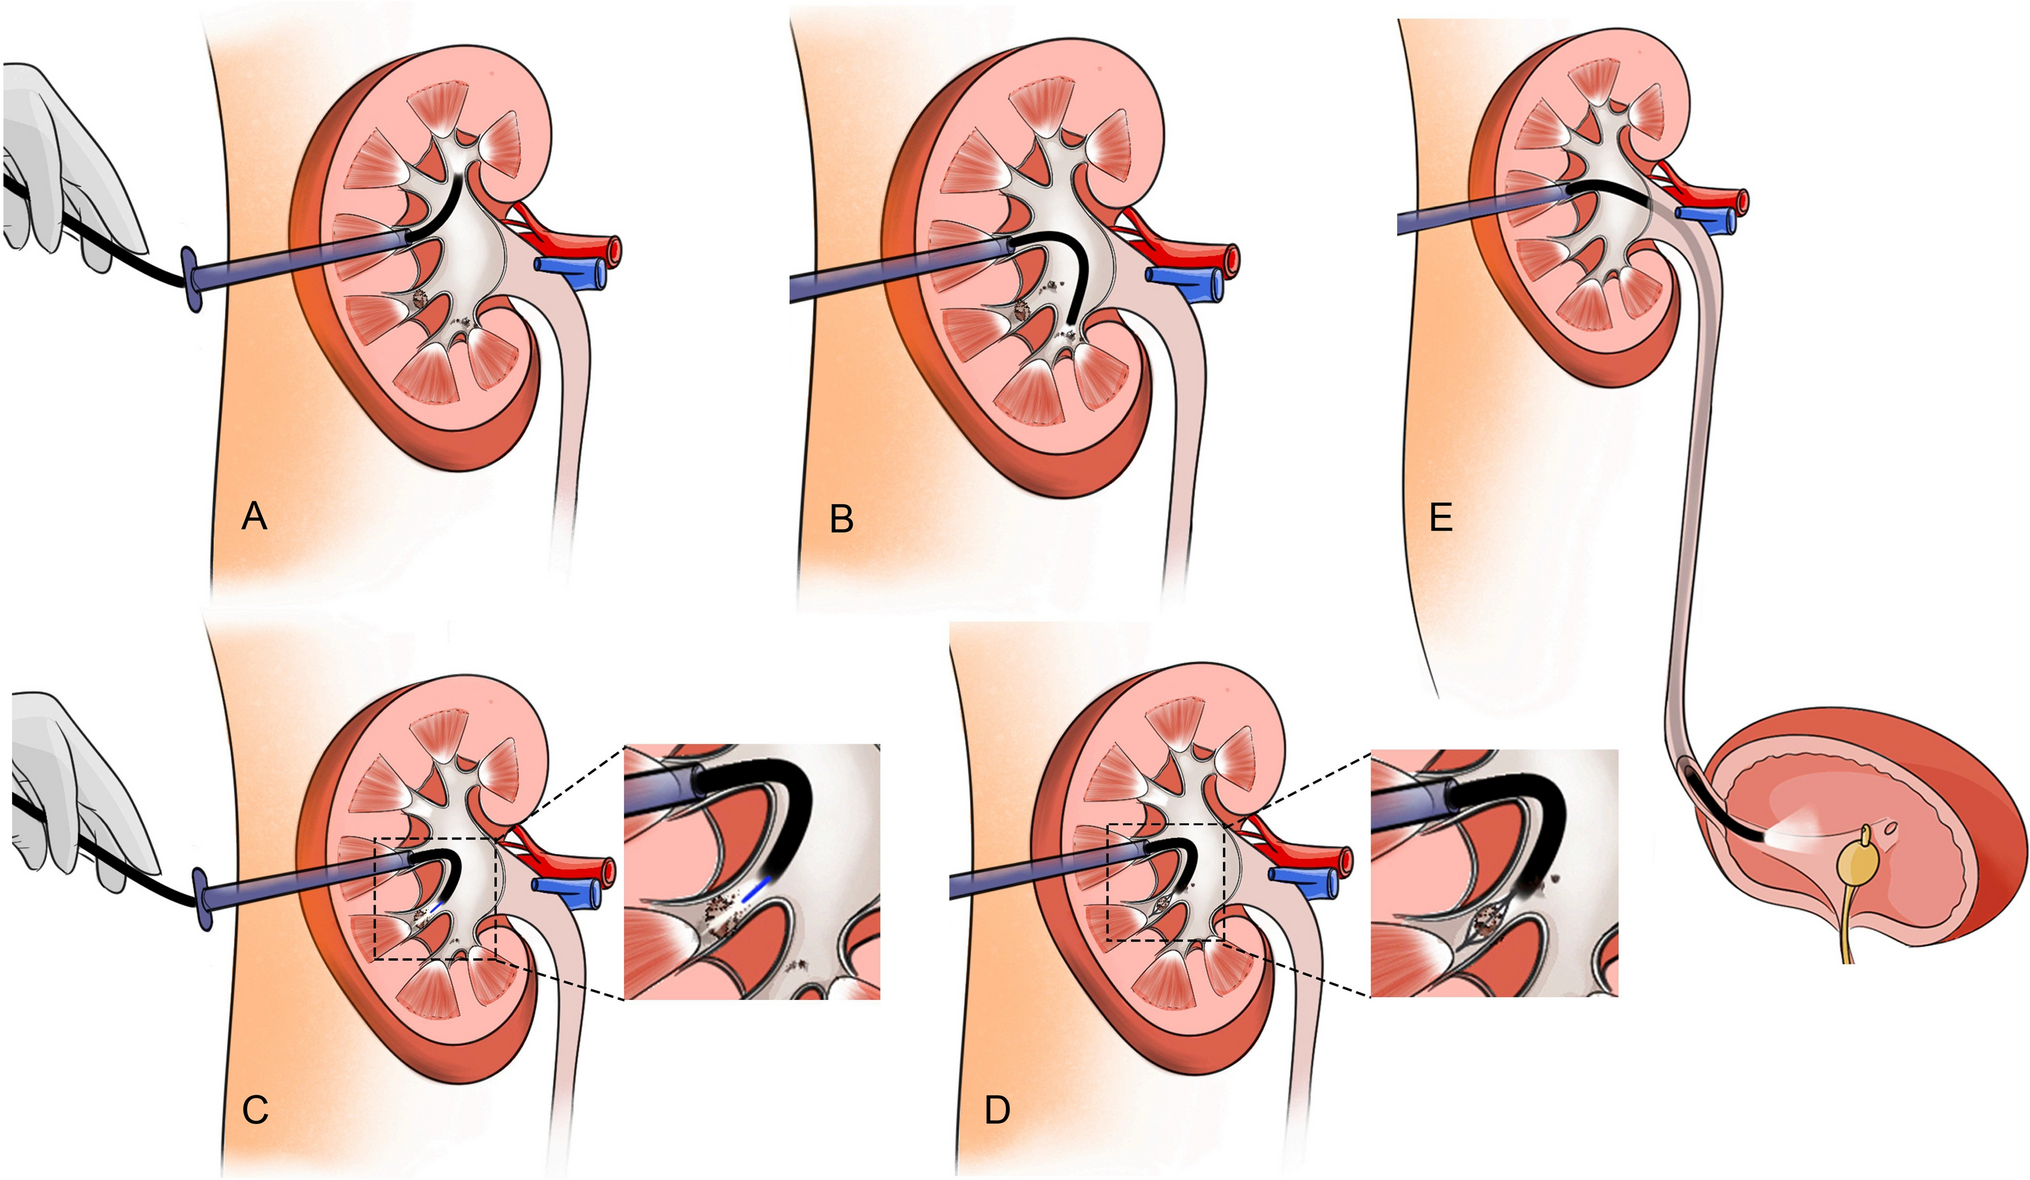
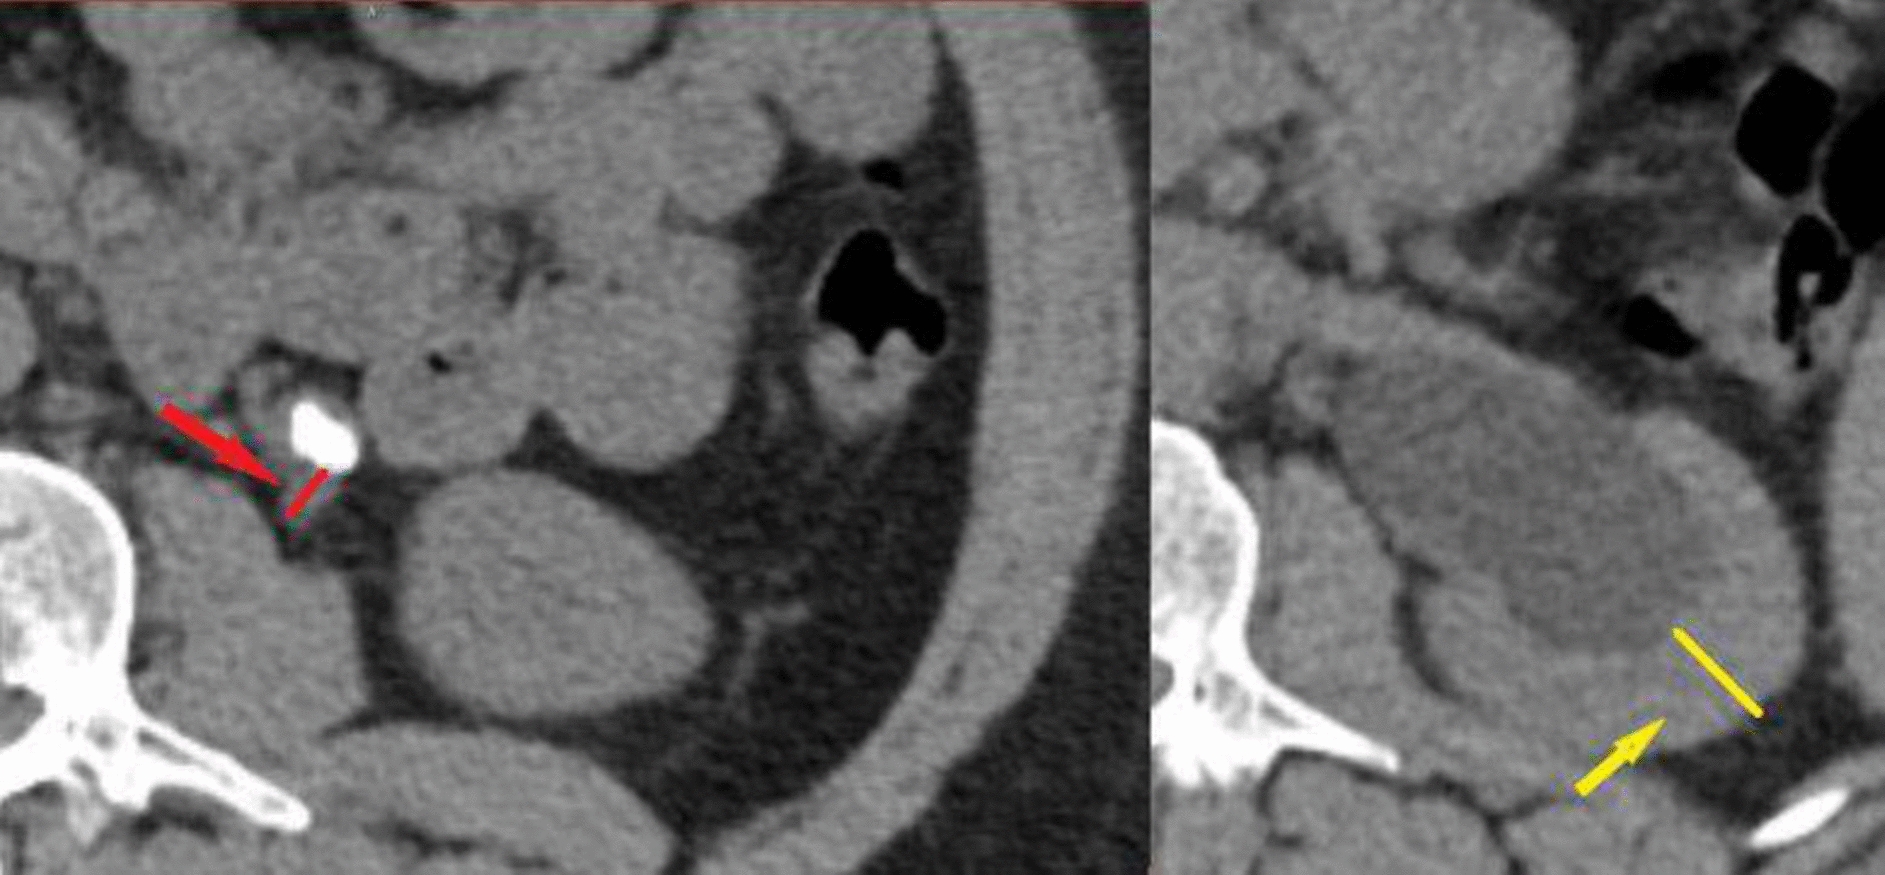
ProceduresPCNL was performed by experienced surgeons with at least 50 cases, or under the supervision of an experienced surgeon. All cases were performed in prone position and under general anesthesia. Renal puncture was performed under ultrasonographic and fluoroscopic guidance. Different nephroscope (Karl Storz, Tuttlingen, Germany) sizes from 4,8 Ch to 32 Ch were used. Standard PCNL had a bore size of 24–32 Ch, mini-PCNL of 14–22 Ch, ultra-mini-PCNL of 11–13 Ch and micro-PCNL of < 11 Ch. Stones were removed in toto or after laser, ultrasonographic or pneumatic fragmentation. SFR was judged at the end of the procedure via fluoroscopy or flexible antegrade nephroscopy trough the tract by the surgeon and based on his preference a nephrostomy tube or a ureteral stent was placed. Postoperative imaging was routinely performed on the first postoperative day and was evaluated by the radiologists. If the radiologist described RF without details regarding the size, the size was labeled as “not specified” in this study. Papilla calcifications were not considered as RF. Regarding the operation time, a distinction was made between a longer duration of surgery (≥ 110 min) and a shorter duration of surgery (< 110 min). This cut-off resulted from the median of the statistical analysis.
Statistical analysisFor external data analysis, the Data Export Tool was used to export the collected data from the REDCap system to an Excel database. The statistical analysis was performed with JMP® version°14 (SAS Institute Inc., Cary, NC).
All parameters are presented as mean ± standard deviation (SD) in case of continuous data. For binary parameters, absolute and relative frequencies are given.
The McNemar test was used to compare the nominally scaled variables of the intraoperative and CT graphical assessment of SFS. A p-value < 0.05 was considered statistically significant. In addition, general values of sensitivity, specificity and predictive values were determined. The predictive values were calculated based on the prevalence determined in the CT.
For the analysis of influencing factors for a discordance between the surgeon´s and postoperative CT graphic assessment of SFS, a group comparison was carried out. Various factors were compared with the Pearson Chi-square test between cases of concordant and discordant stone-free status.
A univariable and a multivariable logistic regression analysis was performed to investigate the influence of various factors on the postoperative RF rate. In both univariable and multivariable analysis, an odds ratio (OR) was used as a measure of risk and its 95% confidence interval (95% CI).
留言 (0)