
Remember me
Self-rated health (SRH) is a simple and easy-to-administer measure of general health. It is a valid and reliable measure among those without cognitive impairment. Initially, it replaced clinical assessments in survey research.[1-3] It is commonly used in psychological research, clinical settings, and general population surveys.[4] SRH is typically measured as a single item, the most common wording of which is “In general, how would you say your health is?”, with the response items: “excellent,” “very good,” “good,” “fair,” or “poor.” Early studies using SRH involved assessing the relationship between SRH and sociodemographic, physical health, and psychosocial variables. Additional uses of SRH involve investigating relationships between health constructs, sociodemographic, physical, and psychosocial variables, clarifying measurement issues, attempting to explain health and illness behavior, or describing populations’ health. SRH was found to be at least moderately associated with physicians’ assessments of health.[5,6]
SRH allows respondents to prioritize and evaluate different aspects of their health, maximizing the measure’s sensitivity to respondents’ views of health. SRH’s somewhat abstract nature also allows researchers to examine the cognitive processes involved in evaluating self-health.[3,7,8]
The purpose of this study was to evaluate the variables affecting the participants’ assessments of their health. Recent research has shown that SRH is essential for diagnosing and treating disorders such as cancer, obesity, diabetes, and hypertension. It is a useful assessment tool for clinicians who can use it to manage the health conditions of their patients with an accurate understanding and assessment of the health parameters, as well as the health-conscious population, which includes people with demanding lifestyles, high levels of stress, and demanding work schedules. SRH is thus employed as a technique to more accurately assess and comprehend health to enhance health status, health literacy, and the impact of lifestyle determinants. Recent years, it has shown to be a useful and significant new tool for health assessment.
A complex relationship exists between SRH and health-related behaviors. Health-related behaviors included in SRH studies often include smoking status, dietary assessments, physical activity, body mass index (BMI) or presence of obesity, and alcohol activity.[9] Often, these health behaviors are included as covariates rather than explanations or outcome variables.[10-12] Likewise, health-related behaviors have been used as control variables in studies exploring SRH and mortality. Health behaviors have been shown to mediate the relationship between SRH and mortality and this effect often differs by gender and/or duration of effect. Other studies, however, have only seen a fairly weak mediating influence of health behaviors on SRH and mortality.[13] Some studies have found only weak or irrelevant associations with SRH.[14,15] There have been contradictory findings concerning SRH and all smoking, alcohol-related behaviors, and dietary behaviors.[16]
The study used a feasible and convenient sampling method to assess knowledge and factors among adults and the elderly.[16]
MATERIAL AND METHODS Data sourceThe data were obtained from the eligible candidates for the study criteria, which included the age group of 18– 70 years).[17] The major factors such as age, gender, BMI, occupation, weight profile, work profile, surrounding hygiene, quality of life, physical activity, eating habits, regular sleep cycle, sleep quality, stress factors, comorbidities, side effects, nutritional supplements, self-medication or doctor’s prescription, and literacy score were taken into consideration and accounted for in this study to estimate the correlation and other parameters affecting the health of the participants in an estimated population.[13,18,19]
Each participant’s BMI was manually determined after the survey. The survey questionnaire, which was created and calculated using the BMI formula, contained the necessary information for BMI, such as height and weight. The online survey form was issued to every age group with the idea that it included three categories, namely, employed, jobless, and student. The work profile was constructed generally with the age group in the survey (18–70 years) in mind. According to the final poll findings, 72% of students of various age groups took part.
ParticipantsThe inclusion criteria for the study participants were people aged 18–70 who were willing to participate in the study.[20] The study included and considered all genders with good health or any chronic or acute disease with any comorbidity.[21-23] On the other hand, pregnant women, pediatrics, and psychologically ill patients were excluded from the study as they were considered to be incompetent to rate their health.[24-26] The collected data were refined, sorted, and analyzed using SPSS software, with correlation performed to determine the relationship between the responses and their health rating.[27]
Statistical analysisThe data were obtained and analyzed using the SPSS software, and a correlation was performed. Two types of correlation were checked: Spearman and Pearson’s. Two algorithms are typically employed to filter, refine, and form the results to ensure the correctness of the data from the survey that was conducted. The survey findings were produced using SPSS software and Pearson’s and Spearman’s correlations. The direction of the relationship between two variables can be determined using Pearson’s correlation, which assesses linear correlation. While Spearman correlation uses the monotonic function to quantify the monotonic variable and the relationship between two variables. The values (output) were acquired after the data had been gathered, cleaned, and analyzed using the SPSS software and various correlations. These values were subsequently contrasted with those discovered from the participants’ responses and the assessment of their health.[28-30]
[Table 1] demonstrates the values of the correlation obtained as well as the type of correlation (positive or negative).[31,32]
Table 1:: The factors affecting self-rated health and correlation type and value.
Pearson’s correlation Health rating how do you rate your health from 1 to 5? Other factors correlation Spearman’s/Pearson’s correlation value Significance value Age −0.81*a 0.022 Gender 0.167**b - Body mass index −0.95** 0.007 Occupation 0.94** 0.008 Weight profile −1.67**b - Work profile −0.76*a 0.31 Surrounding hygiene 0.181**b - Quality of life −0.91**a 0.009 Precautions to be taken to prevent yourself from infectious diseases −0.71*b 0.44 Physical activity −1.72**b - Energy after a full working day? 0.198**b - Consumption of a fatty diet or junk food −0.94**a 0.008 Eating meals on time 0.36*b 0.309 Regular sleep duration 0.87* 0.14 Sleep quality 0.232*a - Parameter estimationThe main estimation parameter in the study was the correlation of the health rating with other factors affecting health. There was a correlation seen between the factors as well as the health rating, which thus supports the influence of the factors on the self- or individual-rated health of a person.[33]
RESULTS AND DISCUSSIONThe study examined the responses obtained from the participants and a correlation was determined to exist between the factors influencing their daily patterns of living as well as the ratings of their health. This study was evaluated to check the impact of health literacy on one’s health. Our study consisted of 47 questions that were divided into seven different sections, the factors on which the self-rating was found to be dependent. The questionnaire included and took into account sociodemographic and economic details, the work profile, the self-health rating question, health literacy and physical activity, dietary factors, sleeping patterns, stress factors, comorbidities, additional nutrition, medication adherence, and self and doctor’s prescriptions. With a keen assessment of the responses and the result, we evaluated the knowledge of health among the participants and found that not all the answers were correctly answered in the “Health Literacy” sections.[34]
The parameters and the respondent’s answers were compared and correlated, and they were found to be two-tailed and significantly correlated using Pearson’s correlation.
A few parameters were not correlated, whereas more than 22 factors were found to be correlated. A few factors were not found to be significant or correlated with the health rating questionnaire. These were found to be bizarre questions with no or little correlation.
Most of the responders did not correctly answer the questions in the literacy knowledge part, which was the reason for the lack of or nil correlation.
In our study, with a total population or sample size of 806, the gender classification was done and found to be: Females (423) and males (383). The age had a negative correlation value (−0.81*). The self-rating of the health of the responders was classified into five different ranges [Table 2] and demographic features [Table 3] were expressed.
Table 2:: Different ranges of responders.
Ranges Description Number of participants Percent of participants 1 Extremely poor 6 0.74 2 Fair or average 15 1.86 3 Good 193 23.94 4 Very good 386 47.89 5 Excellent 208 25.80Table 3:: Demographics characteristics.
Characteristics Number Percentage Age 18–34 723 89.7 35–50 62 7.69 51–69 12 1.48 Sex Female 423 52.4 Male 475 58.9 Body mass index Underweight 135 16.7 Normal 418 51.86 Overweight 162 20.09 Obese (class I, II, III) 64 7.94 Employment status Unemployed 42 5.21 Employed 177 21.9 Student 587 72.8 Work profile Working 133 16.50 Students 495 6.07 Jobless 5 0.62 Income <1 Lakhs 92 11.41 1–3 Lakhs 32 3.97 3–5 Lakhs 34 4.21 >5 Lakhs 29 3.59 Location Slum 4 0.49 Rural 241 29.9 Semi -/Urban 342 42.4 Urban 109 13.5 Smart city 110 13.6 Smoking No 760 94.2 Occasionally 16 1.98 Used to in the past 6 0.74 Yes 24 2.97 Drinking No 715 88.7 Occasionally 50 6.20 Used to in the past 7 0.86 Yes 37 4.21Various responses from the responders are represented in [Figures 1 and 2].
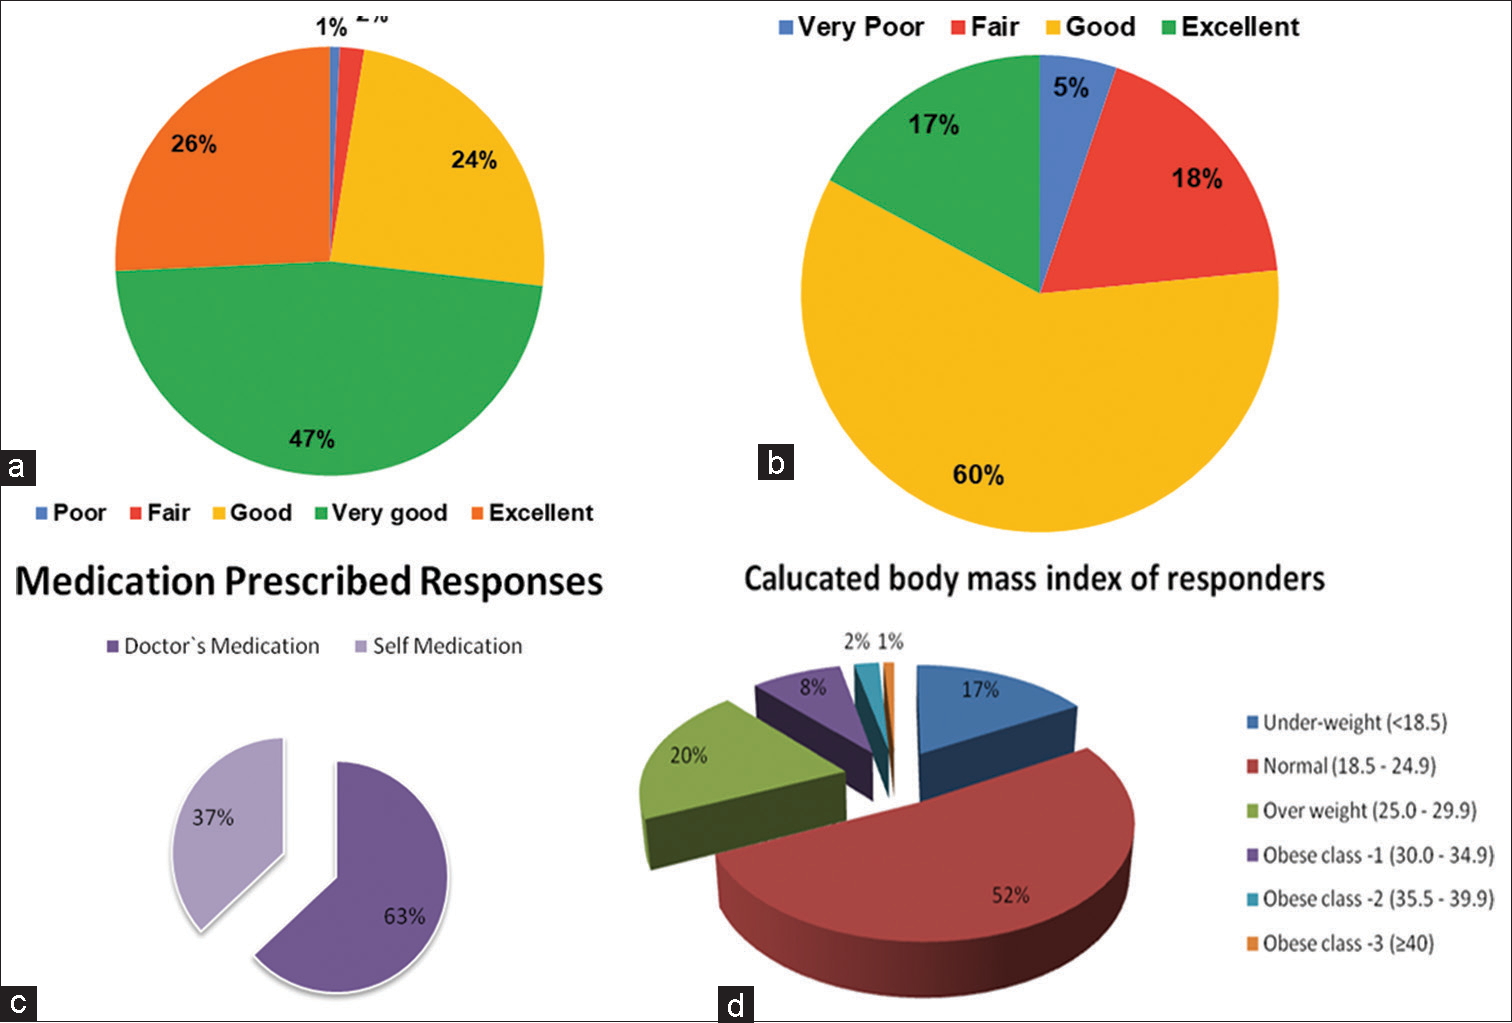
Figure 1:: Graphical representation of (a) health response rating, (b) sleep quality, (c) self-medication doctors’recommendation, and (d) weight and height relationship-body mass index of responders.
Export to PPT
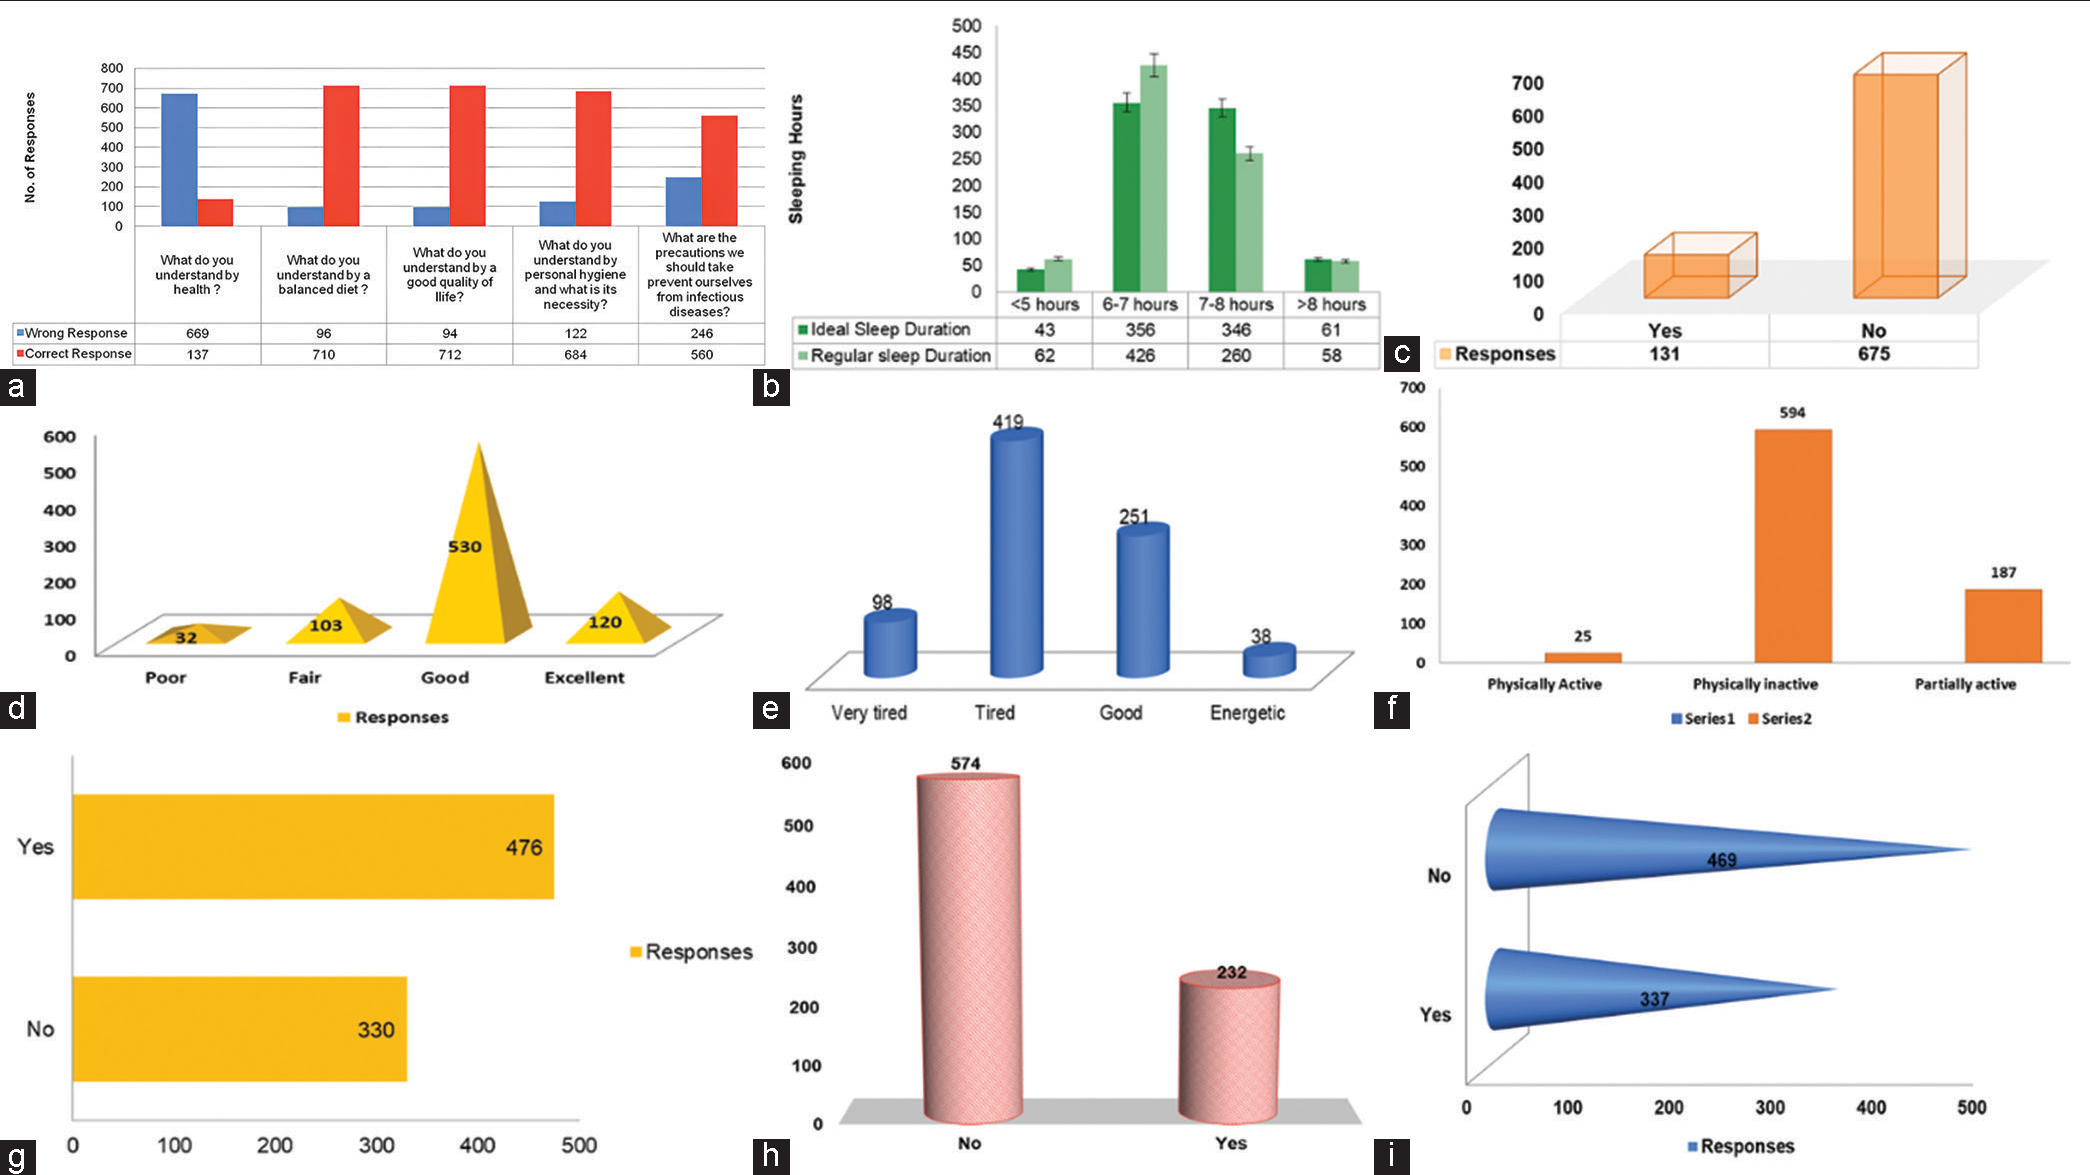
Figure 2:: Graphical representation of (a) health literacy, (b) perceived ideal versus. sleep duration, (c) side effects due to any medications, (d) surrounding hygiene, (e) stress and exhaustion of whole day, (f) physical activity, (g) perceived stress/tension/anxiety, (h) medications prescribed for any illness, and (i) medication adherence of the responses from the responders.
Export to PPT
CONCLUSIONThe study has now provided evidence on what factors influence an individual’s self-rating and how these factors correlate to influence each other on the same platform. Self-rating health is one of the most reliable, responsive, valid, and accurate tools for the clinical assessment of any underlying disease and it has also proven to be a reliable tool for knowing the patient’s health condition and even his or her slightest discomfort. Promoting good healthcare practices can bring drastic changes to the health facilities of a society, which can improve health and also increase the overall global impact on the health of the society and its population.
Comments (0)