
記住我


This study uses data from the population-based HUNT Study in Norway. The entire adult population in the geographic region of North Trøndelag has been invited to participate in clinical examinations, interviews, questionaries, laboratory measurements and to provide biological samples in four consecutive surveys: HUNT1 (1984–86), HUNT2 (1995–97), HUNT3 (2006–08) and HUNT4 (2017–19) [27]. The HUNT Study has a high participation rate ranging from 58 to 89% [28]. Details about the HUNT study are described elsewhere [27,28,29,30].
At HUNT4, individuals aged 70 years and older were invited to a sub study called HUNT4 70 + consisting of questionnaires and physical examinations including a clinical cognitive assessment [4]. For the present study, we included those who accepted the invitation (51.3%) and participated in HUNT4 70 + (n = 9956), and excluded those who had insufficient information from the cognitive assessment (n = 181), other reasons for cognitive decline (n = 5), did not participate in HUNT1 (n = 1041) or had missing data on mean SBP on more than one survey from HUNT1-3 (n = 242) (see Fig. 1). Mean (SD) age at HUNT1 in the study population (n = 8487) was 44.8 (6.5) years.
Fig. 1
Flow chart of study population
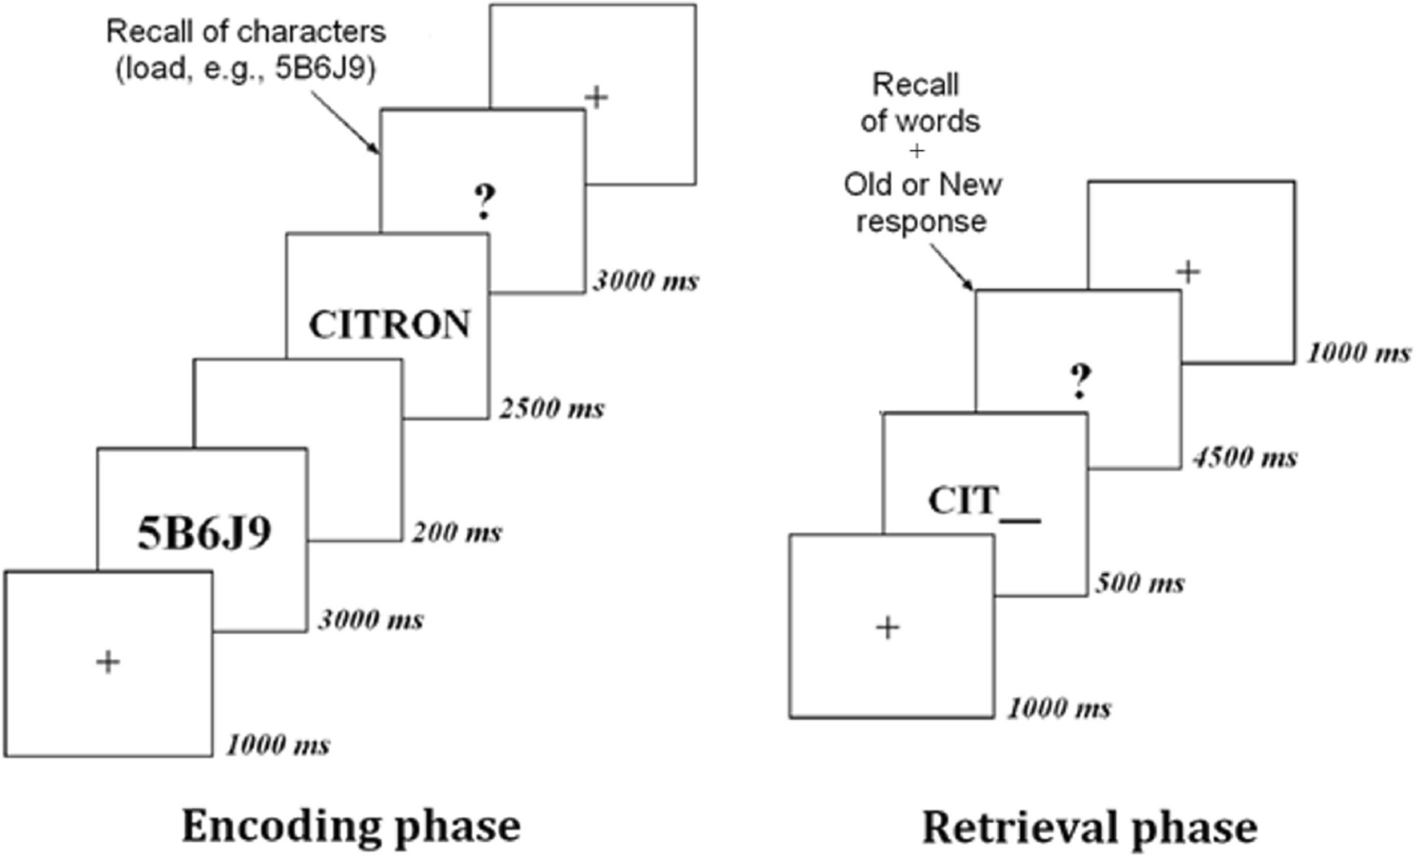
Physical activityWeekly PA was assessed by identical validated questionnaires at HUNT1 and HUNT3 [31]. Frequency was assessed by “How often do you exercise?” with the alternatives “never” “less than once a week”, “once a week”, “2–3 times a week” and “nearly every day”. Duration was assessed by “How long do you exercise each time?” with the alternatives “less than 15 min”, “15–30 min”, “30–60 min” and “more than 60 min”. Intensity was assessed by “How hard do you exercise?” with the alternatives “I take it easy, I don’t get out of breath or break into a sweat”, “I push myself until I am out of breath and break into a sweat”, and “I practically exhaust myself”. The last two intensity levels were categorized as moderate and vigorous, respectively. The lowest intensity level is in the lower scale of moderate intensity level, and to reduce the risk of misclassification into moderate intensity, this level was set to below moderate intensity level. The World Health Organization (WHO) recommends at least 150–300 min of moderate-intensity, or 75–150 min of vigorous-intensity PA weekly among adults for their health [32]. To calculate minutes of weekly PA in moderate and vigorous intensity, we multiplied minutes of activity (median duration) with frequency (minutes*frequency) and set a cut-off of high PA to a minimum of 150 or 75 min of moderate or vigorous PA, respectively. PA was grouped into high (meets the recommendations of intensity and duration from WHO) and low (does not meet the recommendations of intensity and duration from WHO) at both HUNT1 and HUNT3 timepoints.
Systolic blood pressureSBP was retrieved from HUNT1, HUNT2 and HUNT3. At HUNT1, SBP was measured twice in sitting position with a minimum of five minutes rest between the measurements [23]. Measurement was performed by trained nurses or technicians using a mercury sphygmomanometer. At HUNT2 and HUNT3, BP was automatically measured three times with one-minute intervals using an oscillometry-based device (Critikon Dinamap 845XT and XL9301; GE Medical Systems Information Technologies, Barrington, IL, USA) [23, 29]. In addition, at HUNT2-3, a Dinamap CL model 9301 (Johnson &Johnson Medical Inc.) was used to measure BP by the team who went to the smaller municipalities [19]. Mean SBP was calculated from measure one and two in HUNT1 and from measure two and three in HUNT2 and HUNT3.
Combined change in PA level and SBP trajectoriesWe categorized PA change from HUNT1 to HUNT3 into four groups ordered according to the expected most to least favorable change: stable high, low to high, high to low, and stable low. Group-based trajectory modeling was used to identify individuals following similar SBP patterns across time. Group-based trajectory modeling is a finite mixture model that uses maximum likelihood to estimate model parameters [33, 34]. To get as precise estimates as possible, all included participants had at least two valid BP measurements from HUNT1 to HUNT3 (see Fig. 1). We used the traj package in Stata to perform the trajectory modelling [35]. We chose three groups based on the best Bayesian information criteria (BIC) in combination with our research question (Fig. 2). The model fit was assessed as suggested by Nagin (Additional file 1: Appendix 1 and Appendix 2) [36]. The four PA levels were combined with the three SBP trajectory groups resulting in a joint PA and SBP variable with 12 distinct categories.
Fig. 2
Systolic blood pressure trajectories by age (n = 8487) with estimated percentage of the sampled population belonging to the trajectory. Trajectory 1: low trajectory (dotted line); trajectory 2: middle trajectory (dashed line), and trajectory 3: high trajectory (solid line). The dots represent the observed group means
Dementia assessmentThe diagnostic evaluation in HUNT4 70 + was based on the DSM-5 diagnostic criteria [37]. Two medical doctors from a pool of nine, with expertise in geriatrics, old-age psychiatry, or neurology, gave an independent diagnosis based on all relevant information including cognitive tests, functioning in daily life, neuropsychiatric symptoms, development of the condition, subjective cognitive decline, and interviews with next-of-kin [4]. Those assigned a dementia diagnosis were categorized into a specific dementia type. More details on cognitive assessment in HUNT4 70 + can be found in Gjøra et al. [4]. In this study, participants were categorized into either all-cause dementia or no dementia.
CovariatesPotential confounders were assessed at HUNT1 and included age (years), sex (men, women), education (primary, high school, college or university ≤ 4 years, college or university > 4 years), marital status (married or not), smoking (never, former, daily smoker), alcohol use frequency last 14 days (abstainer, did not drink, 1–4 times, more than 5 times), body-mass index (BMI, kg/m2), diabetes (yes, no), anxiety and depression index (ADI-4) [38], and Apolipoprotein E ε4 (APOE ε4) status (APOE ε4 carrier or not). For education, we retrieved information from HUNT2 if no information was available at HUNT1. How the genetic information was retrieved and handled is described elsewhere [28]. If the genetic information was indistinct (n = 8), the values were recoded as missing.
Statistical analysesWe used binary logistic regression with dementia as dependent variable and the PA/SBP groups as twelve category independent variable, with stable low PA and high SBP as reference. The first model was adjusted for sex and age, and the second model was fully adjusted for the above listed covariates. Next, we estimated the adjusted absolute risk difference (ARD) compared to the reference category based on the second model [39]. In a similar logistic regression model, the twelve categories were entered as an ordinal variable ranked from stable low PA/high SBP to stable high PA/low SBP and organized by increasing PA, to assess trend across the categories. We report 95% confidence intervals (CI) where relevant. Stata MP version 17.0 (StataCorp LLC, College Station, TX, USA) was used for all analyses.
Sensitivity analysisThe main analysis was a complete case analysis including 6156 subjects. To assess potential bias due to missing values we also conducted a sensitivity analysis using multiple imputation in the entire sample of 8478 participants, creating 100 imputed data sets [40], and repeated the logistic regression to assess if this influenced the estimates. The imputation model included all variables in the analysis models, and long-term illness at HUNT1 to HUNT3 was included as auxiliary variable. We also excluded those who reported current or previous use of BP lowering medications (n = 405) and those who did not answer the question regarding BP medications (n = 1) at HUNT1 and repeated the imputation process and regression analysis.
EthicsIn all four surveys of the HUNT Study, participants gave informed written consent. The present study was approved by the Regional Committee of Medical and Health Research Ethics in Norway (REK sør-øst D 2017/382). Storage and use of data applies with the General Data Protection Regulation (GDPR).
Declaration of sources of fundingThis work was supported by the Liaison Committee for education, research, and innovation in Central Norway [grant number 2022–30545]. The funding source did not have any role in the design, execution, analysis and interpretation of data, or writing of the study.
留言 (0)