Experimental lines and maintenance
The standard laboratory strain of Nasonia vitripennis: AsymCx was used in all experiments. This is a wild-type strain that has been kept in the laboratory since 1971 and was cured of the Wolbachia infection with antibiotics (Perrot-Minnot and Werren 1999, van den Assem et al. 1980). Its whole genome is sequenced and annotated (Werren et al. 2010). The wasps were kept in plastic vials (70 × 20 mm) with approximately 20–30 animals per vial to avoid overcrowding, in a temperature- and humidity-controlled incubator (20 ± 1 °C, 50–55% RH). They were maintained under a light–dark cycle of 18:6 LD (60 lum/sqf) to prevent diapause induction. Pupae of Calliphora spp. flies were provided as hosts, and wasps were rehosted on a 21-day cycle with about 15–20 Nasonia females on 30–50 fly hosts each generation.
To produce wasps for experimental use, 1–2 days old, mated females were individually separated into small cotton-plugged polystyrene tubes (60 × 10 mm) and supplied with three to four Calliphora spp. pupae; the emerging offspring was used in the experiments. This method was used to avoid overcrowding and to achieve maximal survival and life span of individual wasps during experiments.
Locomotor activity measurements
For all locomotor activity measurements, unmated females were used, because mated females have reduced rhythmicity and life span (Paolucci et al. 2019). To ensure females were unmated, they were sexed and separated in the black pupal stage (approximately, 17–18 days after eggs were laid). Black pupae were put into cotton-plugged polystyrene tubes with a piece of filter paper dipped in sugar water in single-sex groups of 10–15 pupae per tube. Once eclosed, 1–2 days old unmated females were transferred into locomotor activity tubes (6.5 × 0.5 cm), of which one-quarter was filled with agar food (30% sucrose, 1.5% agar, 0.1% nipagin); the activity tubes were closed with black plastic plugs at both ends. Locomotor activity tubes (n = 32 per experiment) were loaded into the Drosophila Activity Monitoring System (DAMS, TriKinetics, Waltham, USA) to record locomotor activities. Locomotor activity in the DAM monitor was detected by infrared light beam breaks through the middle of the tube and stored every minute. The DAM monitors were installed into light-tight boxes (23 × 14 × 32 cm), in a temperature- and humidity-controlled climate room (18 ± 1 °C, 50–55% RH). Within each light-tight box, an LED light source was installed and at least one diffuser sheet was placed under the LED light and above the animals to ensure all animals received an equal amount of light.
Light entrainment experiments
In total, nine commercially available LED light sources (Intelligent LED solutions, Berkshire, UK) were used in the light entrainment experiments (Table 1). Individual LEDs were installed separately in each light-tight box. For red-light entrainment experiments, the three long-wavelength LED lights (590 nm, 625 nm, and 656 nm) were used (Table 1). We also noticed that the precise peak wavelengths of the LED lights deviate slightly from the peak wavelengths reported by the manufacturer (Table 1). These LEDs resulted in illumination at approximately 1.75 × 10¹⁵, 2.22 × 10¹⁵, and 3.30 × 10¹⁵ photons·cm−2·s−1 intensity, respectively. The range of conditions under which entrainment is achieved can be used to characterize and compare the strength of these three red LED lights as Zeitgebers. The range of circadian entrainment to light–dark cycles with different period length (T-cycles) will increase with Zeitgeber strength and is defined as the range between the shortest T-cycle and the longest T-cycle in which entrainment is observed. The percentage of entrainment will follow a bell-shaped curve (0–100–0%) under a full T-cycle range. Increasing Zeitgeber strength will necessarily cause the increase in the number of entrained individuals under the range of T-cycles. Stronger Zeitgebers will also decrease the variation in phase angles of entrainment observed (the amount leading or lagging), and the linear relationship between T-cycle duration and phase angle of entrainment will thus show a flatter slope with increasing Zeitgeber strength (Floessner and Hut 2017).
Table 1 LED light information for the entrainment experimentOur approach was to expose Nasonia to short periods (4 h) of red light and to characterize the range of entrainment by challenging their circadian system and reducing the T-cycle away from 24 h (the circadian period tau in DD for Nasonia is ~ 23–27 h). Animals were entrained with the red-light LED sources under different T-cycles ranging from 19 to 24 h for at least 2 weeks. The length of the light period for each entrainment was kept constant at 4 h and only the length of the dark period for each entrainment varied from 15 to 20 h. To avoid overheating during the 4-h light phase, LED lights were equipped with a large heat sink, continuously cooled with a light-tight forced airflow. During a pilot experiment, a temperature increase of 2–3 °C was noticed during the 4-h light phase. We therefore adjusted the light phase to a "pulse" cycle of 10 min on and 20 min off for 4 h to avoid possible temperature entrainment. Still, there was a 0.3–0.5 °C temperature elevation during the light phase. Programmable timers and controllers were used for controlling the light cycles (ChronTrol electronic programmable timer, ChronTrol cooperation, San Diego, USA). In total, six different T-cycles were tested with the three different light sources and the achieved sample size for each condition was between 12 and 27 wasps.
To entrain Nasonia under different wavelengths of LED light, all nine LED lights were tested individually (455 nm, 470 nm, 505 nm, 528 nm, 566 nm, 590 nm, 617 nm, 625 nm, and 656 nm). The entrainment protocol for this was 4 h of light and 17 h of dark (T = 21 h) for 3 weeks. To avoid overheating during the 4-h light phase, LED lights were equipped with a large heat sink, continuously cooled with a light-tight forced airflow, and intermittently turned on with a pulse cycle of 10 min on and 20 min off. Various combinations of diffusor sheets and neutral density filters (LEE Neutral Density filters 0.5–1.2 ND) were used to adjust light intensities in each lightbox. In total, nine different wavelengths and five to six different light intensities (4.89 × 10¹² to 4.04 × 10¹⁵ photons·cm−2·s−1) per wavelength were tested (N = 13–44 wasps). These dose–response measurements at each wavelength were then used to construct the corresponding action spectra.
Temperature entrainment experiments
Despite our efforts to reduce heat production by the LED sources, we measured a slight temperature elevation of 0.3–0.5 °C during the 4-h lights-on phase. We therefore performed temperature entrainment experiments as a control to rule out the possible entrainment effect due to these temperature fluctuations. To achieve a very stable temperature environment, a 32-channel DAM monitor was positioned inside an insulated polystyrene box (33 × 36.5 × 32 cm) tightly surrounded by water tubes. Circulating water inside the water tubes was provided by a pumping water bath device (LAUDA Ecoline staredition RE204). To mimic the temperature cycle during the LED light entrainment experiments, the temperature cycle of the water bath was set to 24 h, using 4 h of increased temperature and 20 h of constant temperature. The constant temperature was set to room temperature (18 °C), and the increased temperature was tested at six different temperatures, ranging from 18.5 °C to 23 °C. Animals were tested under those temperature cycles for 3 weeks under total darkness. The insulated polystyrene box was covered by a thick black light-tight photographic dark-room fabric to prevent any light input, and the climate room in which the system was placed was kept in darkness at all times as well.
Electroretinogram (ERG) recordings
The spectral sensitivities of the photoreceptors in the compound eyes and in the ocelli were determined with extracellular electroretinogram recordings (ERG). The wasps were immobilized using beeswax and resin and pre-oriented on a mini-goniometer with respect to the light stimulus to yield maximal light responses. The goniometer was mounted on a rotatable goniometric and xyz stage that carried a micromanipulator (Sensapex, Oulu, Finland). The electrodes, pulled from borosilicate glass on a horizontal puller (P-2000, Sutter, Novato, CA, USA) with a 1–5 μm tip, were filled with insect saline (0.67% NaCl, 0.015% KCl, 0.012% CaCl2, 0.015% NaHCO3, pH 7.2) and inserted just below the cornea of the compound eye or into the head capsule next to individual ocelli. Light stimuli were produced with a 75 W xenon arc lamp (Cairn, UK), filtered with a monochromator (B&M Optik, Germany) and a motorized continuously variable neutral density filter (Thorlabs, Germany), or with a custom array of monochrome LEDs ranging from 365 to 700 nm in ~ 15 nm interval (Roithner Laser, Austria), synthesized with a diffraction grating (Thorlabs, Germany). The light sources were adjusted with a radiometrically calibrated flame spectrophotometer (Ocean optics, USA) so that the maximal light intensity in the focal plane of the visual organ was 1.5 × 10¹⁵ photons·cm−2·s−1. LED stimulation for ERG was at the same wavelengths as for the behavioural experiments (455 nm, 470 nm, 505 nm, 528 nm, 566 nm, 590 nm, 617 nm, 625 nm, and 656 nm), with an additional LED at 540 nm.
Determination of entrainment and statistical analysis
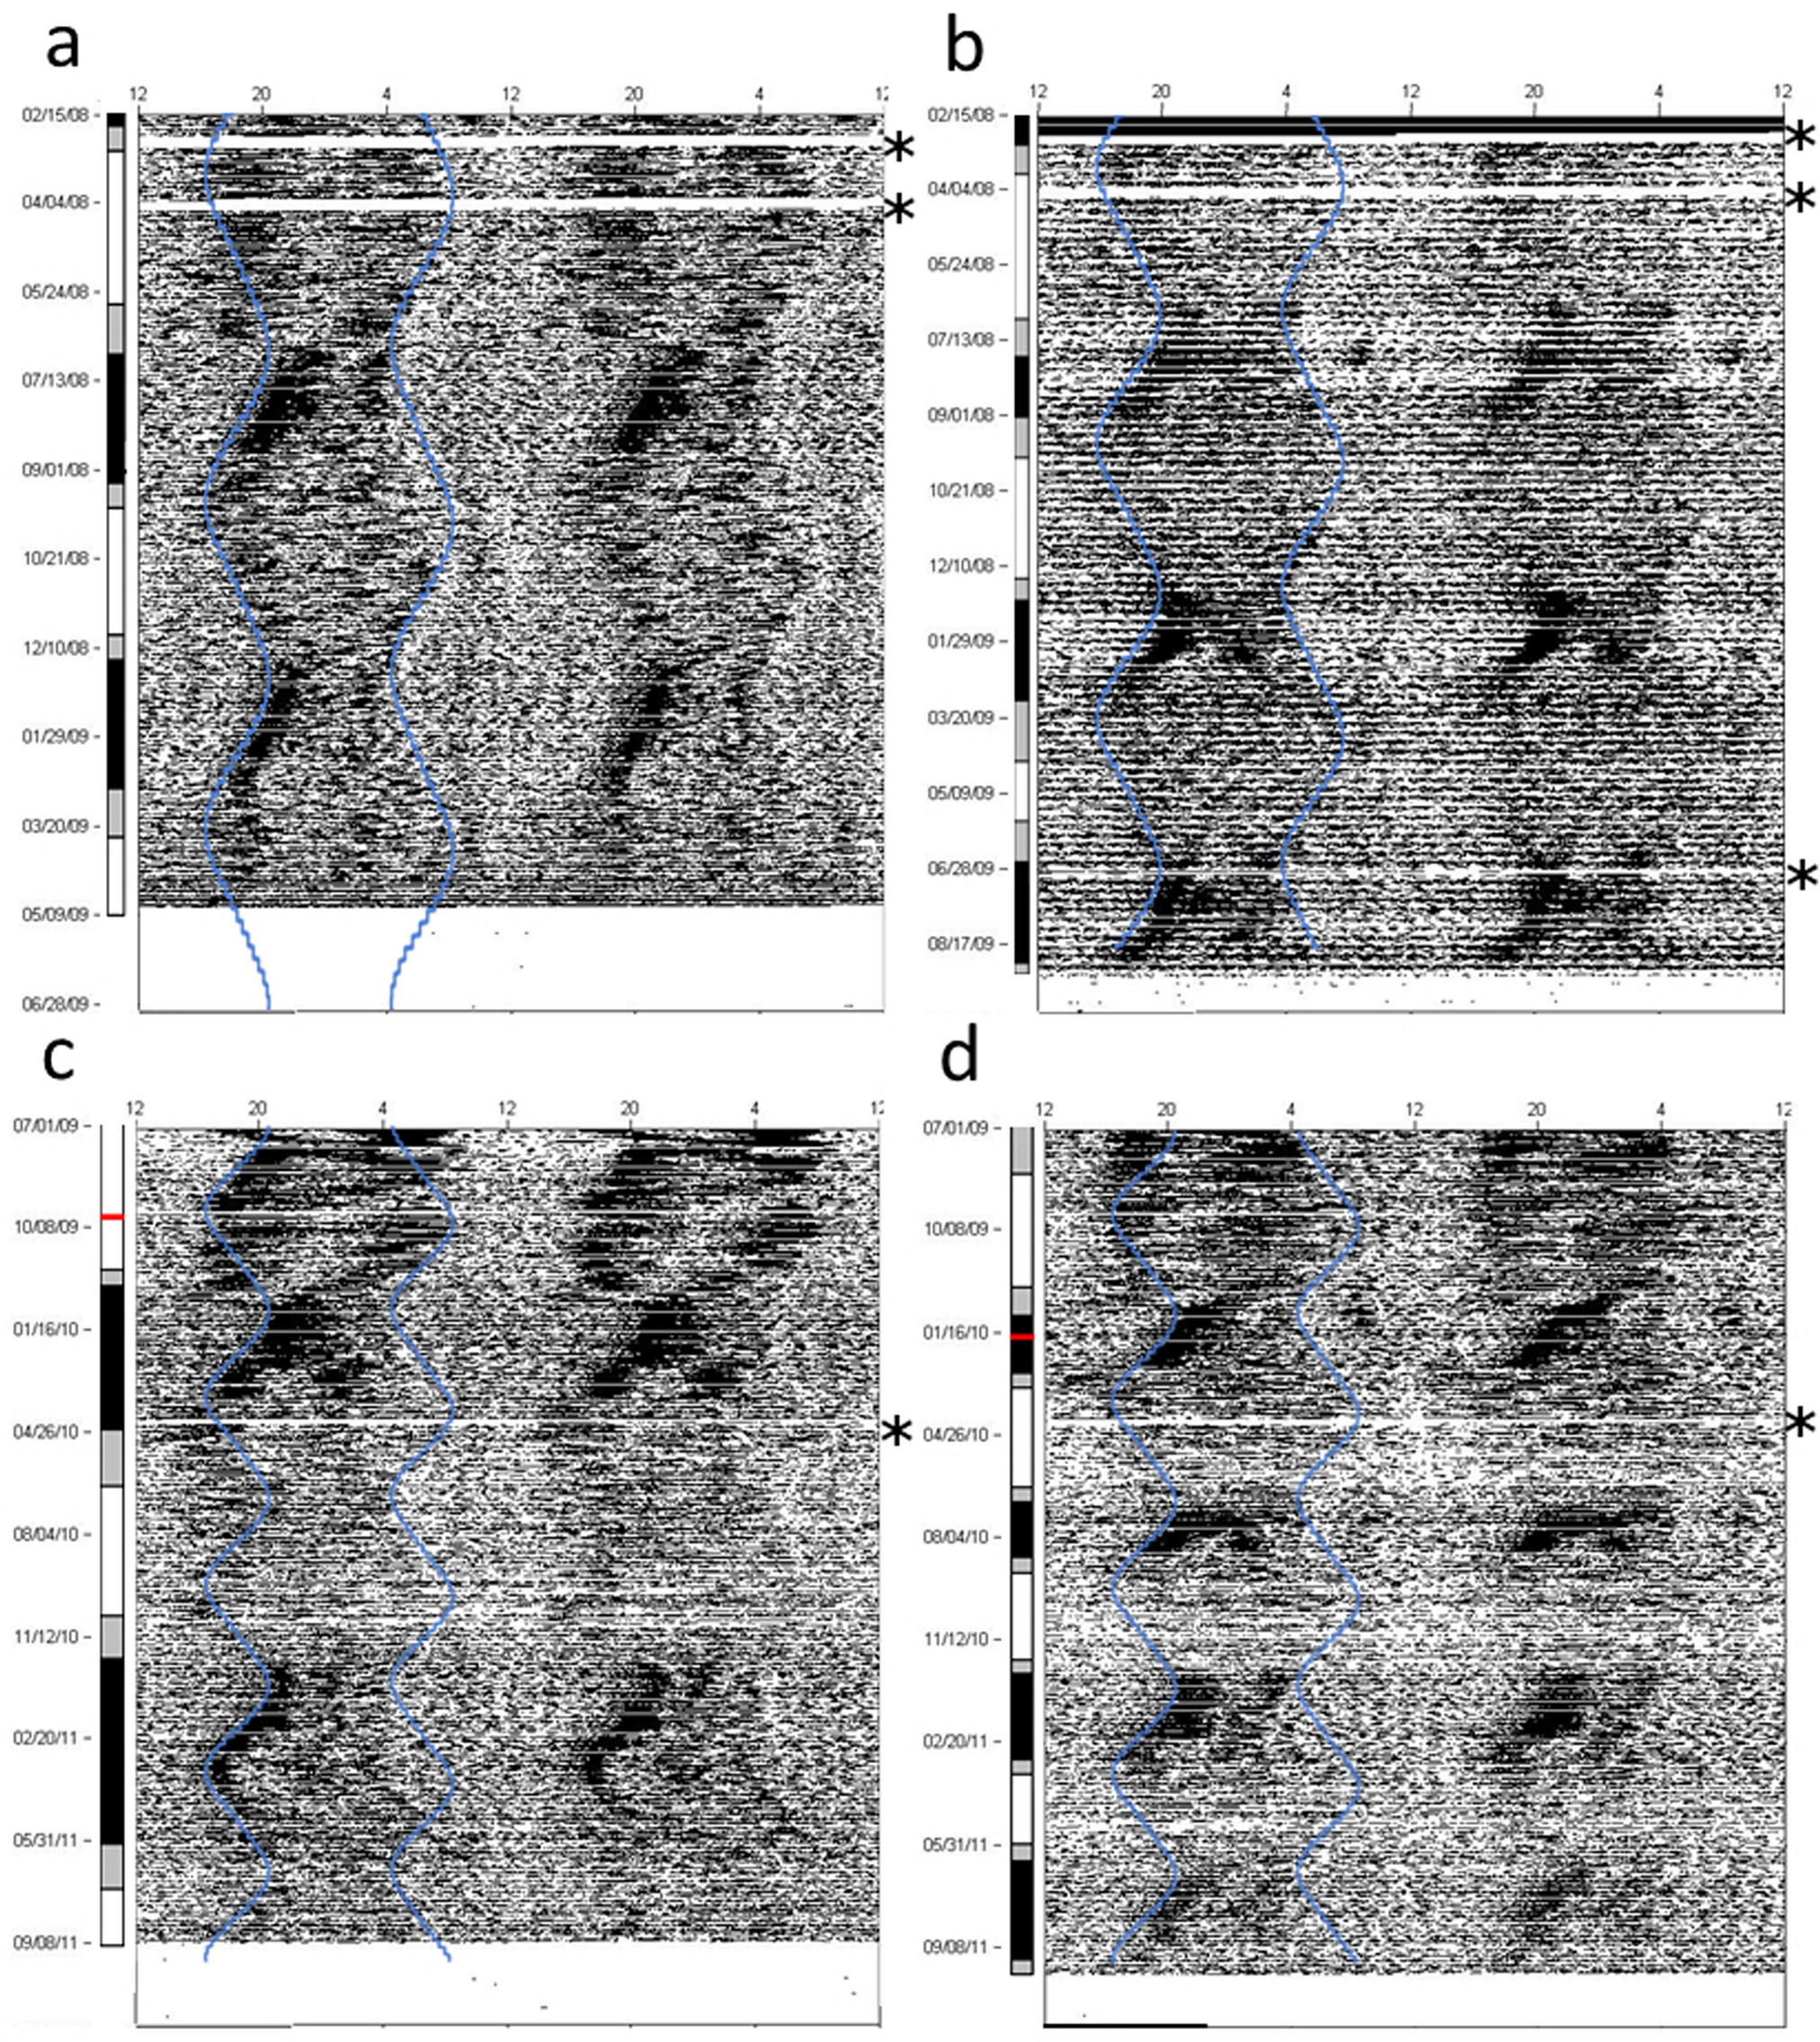
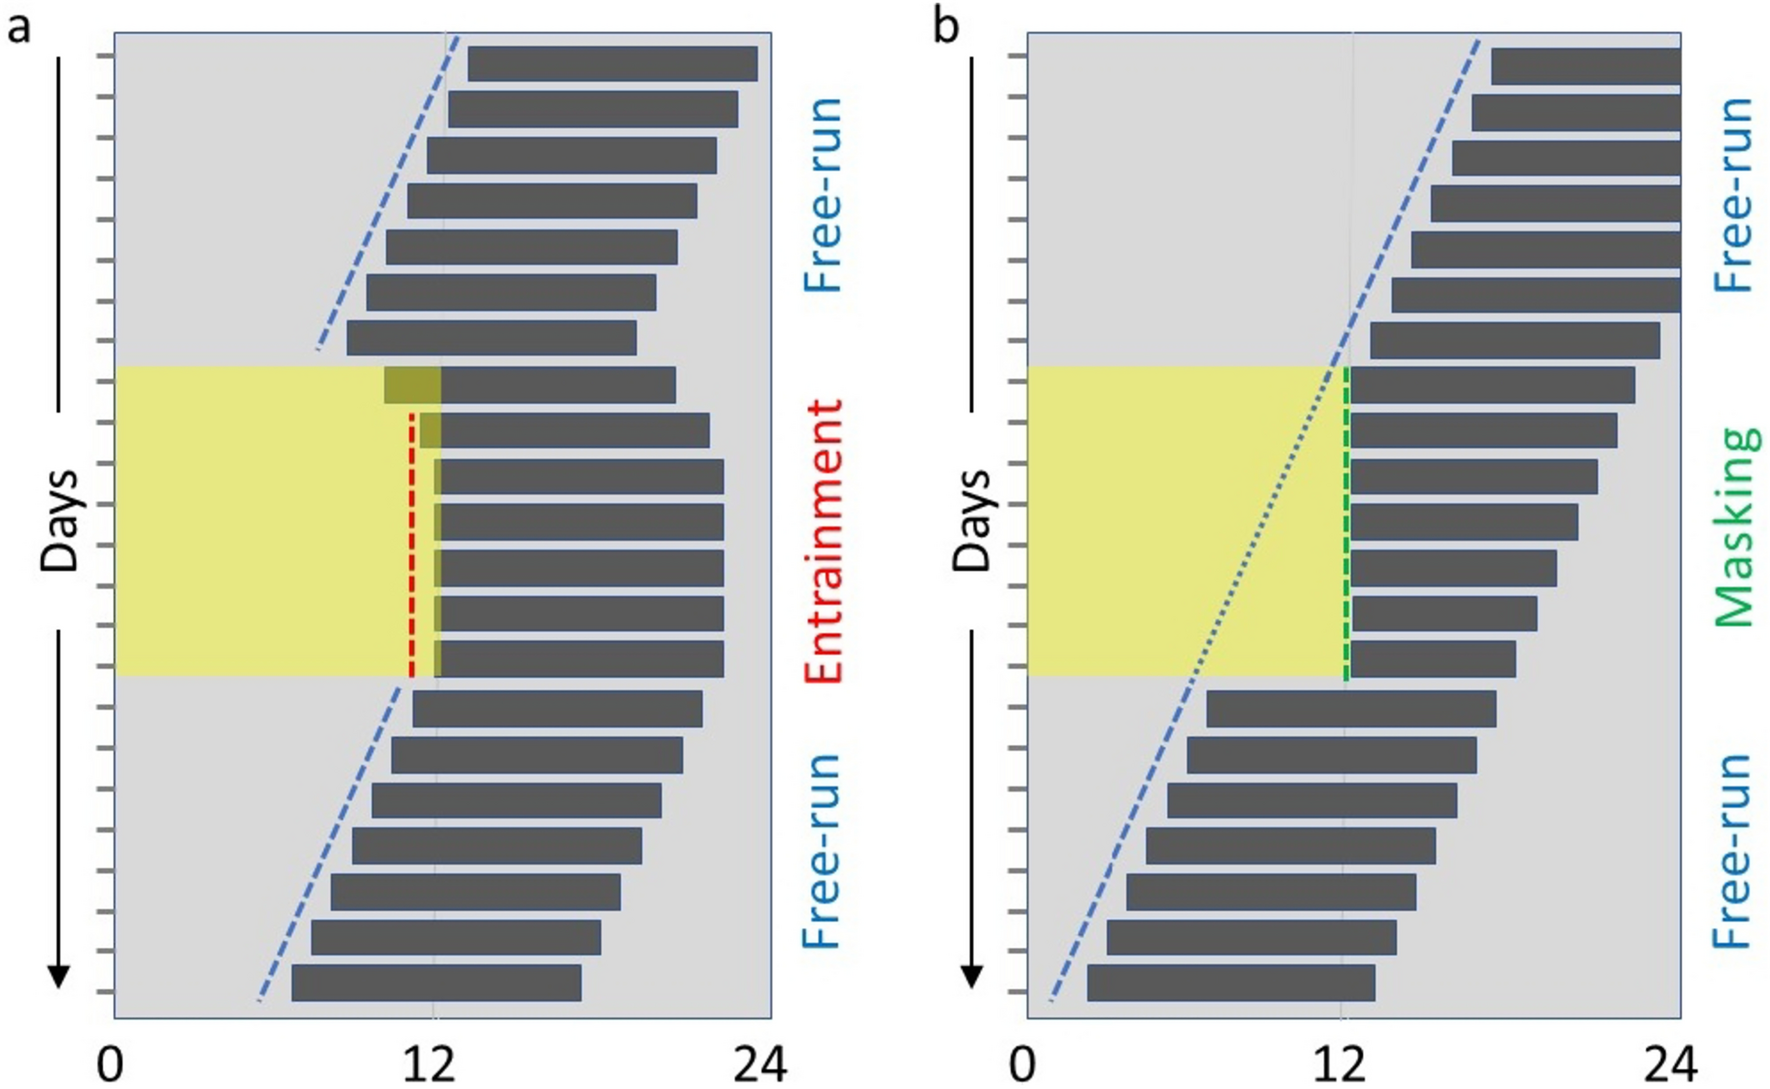
All raw behavioural data were initially examined using Chronoshop (Spoelstra 2018), to inspect the actograms and centre of gravity per day. All behavioural data were further analysed and plotted in R (v. 4.1.2) (R Core Team 2021). Rethomics R framework (Geissmann et al. 2019) was used to analyse DAM monitor recordings and for plotting actograms and calculating periodograms. Moving (if the activity of the animal per minute is bigger than 0) is plotted in all actograms. Because of the extreme light conditions used (small T-cycles and “10 min on and 20 min off” light period), many wasps showed unusual behavioural profiles. Therefore, we applied the following rules to determine entrainment, to avoid over- or underestimation of the possibility of entrainment. First, animals that lived shorter than 10 days were considered too short-lived and were removed from the analysis. Animals that showed long gaps in their activity, such as a week of absent activity, were also removed from the analysis. Secondly, based on previous research, a relatively high percentage of Nasonia are naturally arrhythmic (Floessner et al. 2019, Paolucci et al. 2019; Wang et al. 2023). We could not distinguish between naturally arrhythmic wasps and light condition-induced arrhythmic wasps; thus, arrhythmic wasps were excluded from the analysis. For instance, wasps that showed hyperactivity throughout the days were considered arrhythmic. Lastly, periodograms (with R package zeitgeber), average activity profiles, and centre of gravity per day were calculated for each animal in R, and entrainment was judged by combining this information. Individuals were considered entrained when their activity mainly concentrated during the day, the calculated period was close to the given T-cycle, and/or the centre of gravity followed one vertical line approximately. Individuals were considered free running when there was a clear drifting in their activity, the calculated period was not close (> 0.5 h) to the given T-cycle or period could not be determined, and/or there was a clear drifting in the centre of gravity. Animals were considered free running, mainly when the free running pattern covered all days of the T-cycle.
To analyse the effect of wavelength and T-cycle on entrainment, we selected only the rhythmic wasps, where free running wasps were referred to as 0 and entrained wasps were referred to as 1. We applied a binomial generalized linear model (GLM) to take into account the sample size variations for each condition. In the applied GLM model, the binary response (entrained or free running) was defined as the response variable, whereas wavelength, T-cycle, and the interaction between wavelength and T-cycle were defined as predictor variables [glm(binary response ~ wavelength*Tcycle, family = “binomial”)]. We used Chi-square test for GLM model comparison and selection, and we used likelihood ratio F tests (Anova(m1) from the car package in R (Fox and Weisberg 2011)) in the final model. The percentage of entrainment was calculated as the number of entrained animals divided by the total number of rhythmic (entrained and free running) animals for visualization. To determine the average phase angle of entrainment in the T-cycle experiments, the first 4 days of non-entrained activity were removed before calculating the average centre of gravity (phase angle of entrainment) in hours after lights on. The effect of wavelengths and T-cycles on phase angle of entrainment was then analysed using a linear effect model [lm(phase angle of entrainment ~ wavelength + Tcycle)]. Post hoc tests were used to compare the differences between wavelength (i.e. the slopes of the linear regression).
For analysing the circadian action spectrum of entrainment, we firstly applied a similar binomial generalized linear model (GLM) to assess the effect of wavelength and light intensities on entrainment [glm(binary response ~ wavelength + light intensity, family = “binomial”). To compare Nasonia’s sensitivity to different wavelengths and construct the circadian action spectrum, we then performed dose–response analysis by fitting a series of sigmoidal curves using R packages drc (Ritz et al. 2015). In the applied drc model, the percentage of entrained animals was defined as response variable, light intensity was defined as predictor variable, and all data were grouped by wavelength. As the proportion of entrainment is between 0 and 1, dose–response curve parameters were estimated by nonlinear regression using a two-parameter (effective dose and steepness of the curves) sigmoidal function. Effective dose (ED) was then derived from the dose–response curves as an indication of Nasonia’s spectral sensitivity. Different levels of effective dose were calculated due to the non-univariance of the slopes. By setting the response threshold at 30%, 50%, and 80%, the model could calculate how much light intensity was needed to produce this level of response based on the fitted Hill equation. The same dose–response analysis was performed for the electroretinogram recordings to determine Nasonia’s sensitivity to different wavelengths in terms of electroretinogram responses in the compound eye.


留言 (0)