
Remember me


Forty-one healthy young adults (all right-handed; 25 males and 16 females; mean age: 26.5 ± 3.1 years; education: 15 ± 2.8 years) were recruited from undergraduate medical students at Siena Medical School and postgraduate students at the Santa Maria alle Scotte University Hospital of Siena, Italy. Four of them withdrew for personal reasons; therefore, analyses were performed on 37 subjects (25 males and 12 females; mean age: 26.3 ± 2.8 years; education: 15 ± 2.8 years).
The sample size was determined on the following basis: based on preliminary measures of the duration (in seconds) of self-reported CS nausea (i.e. the main outcome measure) in a control condition (no stimulation), the statistical distribution appeared to be approximately log-normal with a mean of 40 s and a standard deviation of the same magnitude. Such a skewed distribution is typical in biological experiments and requires a log transformation to improve the Gaussianity and control for possible outliers. By applying formulas proposed by Armitage [24], mean and SD of log-transformed data in the sham condition are expected to be similar to control condition and thus ln(40) = 3.69 log(s) with a \(\mathrm\left(\mathrm\right)\cong }}\right)}^\frac\,=\,\mathrm\left(\mathrm\right)}\mathrm\ (\mathrm)\) and, since y = ln(x), \(\mathrm\left(\mathrm\left(\mathrm\right)\right)=\right)}^\mathrm^=1\) and thus SD = 1 log(s). We considered a reduction of 20 s (expected for 10 Hz-tACS) as the minimum “clinically relevant” difference and an increase of 20 s (expected for 2 Hz-tACS, on the basis of a previous study [16]) as a secondary outcome. On a log scale, these effects correspond to log(20) = 2.99 and log(60) = 4.09, respectively (SDs can be assumed homogeneous and equal to 1 log(s)). Since we were interested in two specific contrasts (10 Hz-tACS vs. sham and 2 Hz-tACS vs. sham), alpha was set at 0.05/2 = 0.025. Power was set at 0.80. As this was a within-subjects study, we also assumed that the pairwise correlation between the measures in the three experimental conditions was around 0.7. G*Power 3.1 [25] indicated that in order to have a 80% probability of detecting a statistically significant (with a two-sided alpha 0.025) a decrease from 3.69 log s to 2.99 log s (corresponding to a change in CS length from 40 to 20 s), 15 subjects are required and to have a 80% power of detect as statistically significant (with a two-sided alpha 0.025) an increase from 3.69 log s to 4.09 log s (corresponding to a change of CS length from 40 to 60 s), 39 subjects are required. Allowing the possibility of some drop-outs, we recruited 41 subjects.
Subjects with a history of epilepsy, sleep disorders, migraine, psychiatric medication and history of other neurological or psychiatric disorders were excluded. Subjects were screened for their susceptibility to kinetosis using the Motion Sickness Susceptibility Questionnaire-Short form (MSSQ-Short) (score cut off 12) [26]. Each subject agreed to participate in the study and signed a written informed consent; the research was approved by the Local Ethics Committee (Code: Brainsight 21–24).
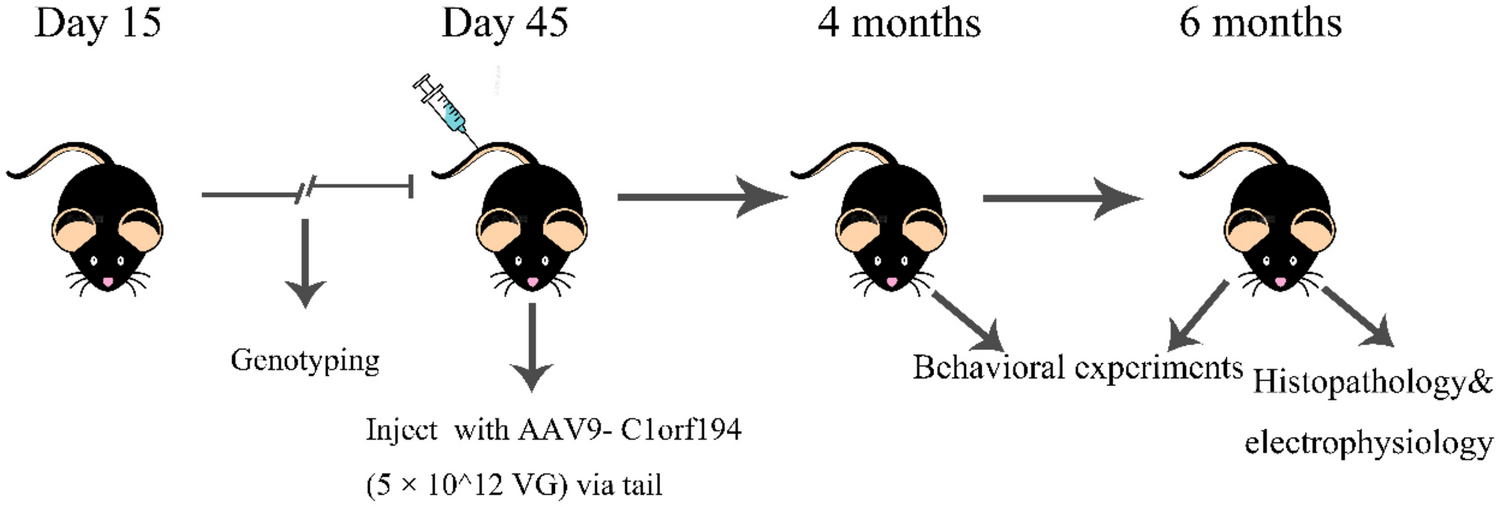
Experimental DesignFigure 1 shows the experimental setting and design. Subjects were tested under the same experimental protocol, in the middle hours of the day, within a double-blind study design. Blindness was implemented using the MATLAB programming language, which randomly assigned a number to each condition without the experimenter’s knowledge. Also using the same script, conditions were randomised equally across participants. All subjects were naïve to tACS and unaware of the aims of the study. Therefore, even if they experienced some different sensation, they would not be able to attribute it to a particular tACS condition.
Fig. 1
Methodology. a The subject immersed in the rollercoaster ride wearing the VR headset and GSR electrodes. The same set up was used in all the three stimulation conditions (each one lasting 6 min); in the 6 min preceding the VR experience, basal GSR activity was recorded. b tACS montage with 4 electrodes was chosen to stimulate the PIVC and PIC bilaterally: C5 (1.15 mA), C6 (−1.15 mA), CP5 (1.35 mA), and CP6 (−1.35 mA). The figure graphically shows the arising E-field (represented in NormE) resulting from the montage in V/m on a healthy example subject. c Sinusoids showing the three stimulation conditions (2 Hz, 10 Hz, sham) that were applied randomly
The experiment was conducted in a quiet environment to minimise the influence of the external stimuli. The protocol included four sequential trials during an Internet-available VR rollercoaster ride experience (epic rollercoaster) displayed through a head-mounted Oculus Quest 2. Each trial lasted 6 min and was 15 min apart from the next: the first trial consisted of a training session without any stimulation; the following three trials, whose order was randomised, included active tACS at different frequencies (2 Hz, 10 Hz) and sham (placebo). Stimulation at 10 Hz represented the experimental condition, while 2 Hz represented the frequencies that better activated the vestibular cortex during galvanic peripheral stimulation in neuroimaging studies [13] and induced motion sickness when applied to the vestibular cortex [16], while sham stimulation represented the control condition.
We preferred to perform the whole experiment in a single day in order to avoid the bias of possible habituation to CS with repeated exposures to VR in consecutive days [27], an effect that is not reported when VR exposures are separated by less than 1 h. The risk of a possible CS accumulation effect was minimised by randomising the conditions, while the risk of a carry-over effect of tACS sessions was excluded a posteriori by including this factor in the linear mixed model (see the “Results” section).
Participants engaged in the VR game were seated in a chair. Subjects were asked to verbally report the beginning and end of the periods of discomfort they experienced. The experimenter, blind to the type of stimulation, used a chronometer to record each period of reported discomfort during the different phases of the ride. The rollercoaster simulator (which is available online) allows for sudden changes in speed with rapid accelerations, rapid ups and downs interspersed with sections of straights. Players had to do nothing more than sit passively on the chair and report when they felt nausea or discomfort. At the end of the ride, they were asked when they would feel ready to take another ride (i.e. recovery time).
Transcranial Alternating Current Stimulation (tACS)High-definition tACS was delivered via a 32-channel hybrid EEG/tCS neurostimulation system (Starstim; Neuroelectrics, Barcelona, Spain). The device was wired by cable to the computer. Hybrid electrodes (NG Pistim) were used, consisting of an upper part containing the sintered Ag/AgCl core with a diameter of 12 mm, screwed to a lower base covering a circular area of approximately 3.14 cm2 which was covered. The electrodes were placed on a 32-channel neoprene EEG headset with holes corresponding to the positions of the International 10–20 EEG system. The scalp area below the electrode was prepared by inserting 15 ml of sterile sodium chloride solution (0.9%) to avoid discomfort on the skin and to reduce impedances, which were always kept below 20 kOhm. Gel (Signa, Parker Laboratories, Inc.) was applied to optimise signal conductivity and lower impedance. Electrode impedance was checked before starting each tACS session to ensure safety and maximum efficacy of stimulation, as well as to familiarise participants with the tACS-induced scalp sensations (e.g. tingling). tACS was applied at a maximum intensity of 2 mA on each electrode and a total of 4 mA across all electrodes, preceded by a 30-s ramp-up period and followed by a 30-s ramp-down period, while research and clinical staff were carefully monitored for any side effects throughout the duration of each session. For sham stimulation only ramp-up and ramp-down of 30-s was set, with no stimulation in between.
Biophysical ModellingTo identify the correct electrode montage for our target we used an open source simulation software (SimNIBS v3.2). Through computational modelling with the Finite Element Method (FEM), SimNIBS integrates segmentation of magnetic resonance imaging (MRI) scans, mesh generation and E-field calculation to project current distribution and realistically calculate the electric field generated by different noninvasive brain stimulation (NIBS) techniques [28]. The software provides a realistic volume conductor head model, which is created by default in the FEM model generated using the T1-and T2-weighted images and segmentation from the SimNIBS example dataset [29]. The data sample was acquired from a healthy subject under the approval of the Ethics Committee of the Medical Faculty of the University of Tübingen [30]. The data correspond to a healthy subject (Ernie) and include white matter, grey matter, cerebrospinal fluid, bone and scalp tissue volumes. In our simulation, we kept the default isotropic conductivities [28] corresponding to grey matter: 0.276 S/m, cerebrospinal fluid: 1.790 S/m, bone: 0.010 S/m, scalp: 0.250 S/m [16]. The final mesh, including grey and white matter, scalp, bone and cerebrospinal fluid, comprises approximately 200,000 nodes and 3.6 million tetrahedral elements (see [30] for further modelling details).
Bilateral parieto-insular-vestibular cortex (PIVC), x = − 43, y = − 14, z = 17 (left) and x = 40, y = − 14, z = 18 (right) and posterior insular cortex (PIC) x = − 42, y = − 36, z = 23(left) and x = 58, y = − 34, z = 17 (right) [31] were considered as target areas. According to the simulation and the model, we identified a montage able to reach both target regions. Specifically, we placed 4 electrodes at the level of C5, CP5, C6 and CP6 (Fig. 1b). At the CP5 level, an intensity of 1.35 mA with a phase angle of 0° was used; at the CP6 level, an intensity of 1.35 mA with a phase angle of 180° was used; at the C5 level, an intensity of 1.15 mA with a phase angle of 0° was used; and at the C6 level, an intensity of 1.15 mA with a phase angle of 180° was used, for a total of 2.5 mA. Intensities inequalities were generated by the model [28].
GSR RecordingIn a subset of 25 subjects (14 males; 11 females) galvanic skin response was measured using the Neulog GSR logger sensor device (NUL-217) with two GSR probes attached by durable rubber-coated wires and two white Velcro finger connectors. As we were interested in tonic changes in GSR activity throughout the ride, the sensors were placed on the fingers [32]. Due to the head-mounted Oculus, sensors could not be placed on the forehead, the site most sensitive to phasic changes of skin conductance [11]. However, either phasic or tonic GSR changes are known to correlate with the severity of motion sickness [32]. Skin conductance activity was recorded before (6 min) and during (6 min) VR experience for each condition of stimulation separately. Measures of tonic GSR activity were expressed in microsiemens.
Outcome Measures and Data Analysis Cyber Sickness Nausea, Recovery Time and GSRThe primary aim was to verify the duration of self-reported CS nausea during the different phases of the rollercoaster ride (acceleration/deceleration, downhill, uphill, turns etc.) in the different stimulation conditions. Subjects were asked to verbally report each time a nausea sensation occurred and then disappeared. The length (in seconds) of these epochs was recorded and then summed up at the end of each condition. In addition to the epochs of discomfort during the VR experience, subjects were asked to report when these types of sensations ended (recovery time) after the session ended. GSR data refer to the difference between the GSR recorded during VR and before VR for each condition. A standardised side-effect questionnaire covering general discomfort, headache, itching and tingling during tACS [33] was also administered after each experimental condition.
Statistical AnalysisDifferences in CS nausea, recovery time, GSR and side effects were tested using IBM SPSS statistics 26 software. In behavioural data analysis, self-reported CS nausea and recovery time are the dependent variables, and the applied stimulation frequency is the independent variable. In physiological data analysis, GSR is the dependent variable, and stimulation frequency is the independent variable.
The Shapiro-Wilk test was used to test the normality of the data distribution. A non-normal pattern distribution was found for CS nausea reported during the 2 Hz-tACS (W = 0.783, p < 0.001), 10 Hz-tACS (W = 0.752, p < 0.001) and sham (W = 0.918, p = 0.008) conditions. The expected approximation to log-normal probability distribution was confirmed for 2 Hz-tACS and partially for 10 Hz-tACS, as indicated by the increase in the Shapiro-Wilk statistic after log-transformation (better fit to Gaussianity) in these two conditions; it should be noted that log-transformation did not improve the fit to Gassianity for the sham-tACS condition.
Linear mixed model (LMM) was used for CS length, recovery time, GSR and side effects. Compound symmetry was initially assumed, but the unstructured covariance matrix was also included to check the robustness of the results.
Correlation analyses were performed using a two-tailed Spearman’s test between MSSQ scores and CS duration, MSSQ and recovery time duration, GSR and CS length, GSR and recovery time length, CS nausea experienced during sham and effects of the 10 Hz-tACS.
Finally, linear regression with regression to the mean adjustment was used to test the predictivity of the level of CS nausea experienced during sham on the therapeutic effect of the 10 Hz-tACS. The significance level was set at 0.05 for each test. All graphs were generated with GraphPad Prism.
Comments (0)