
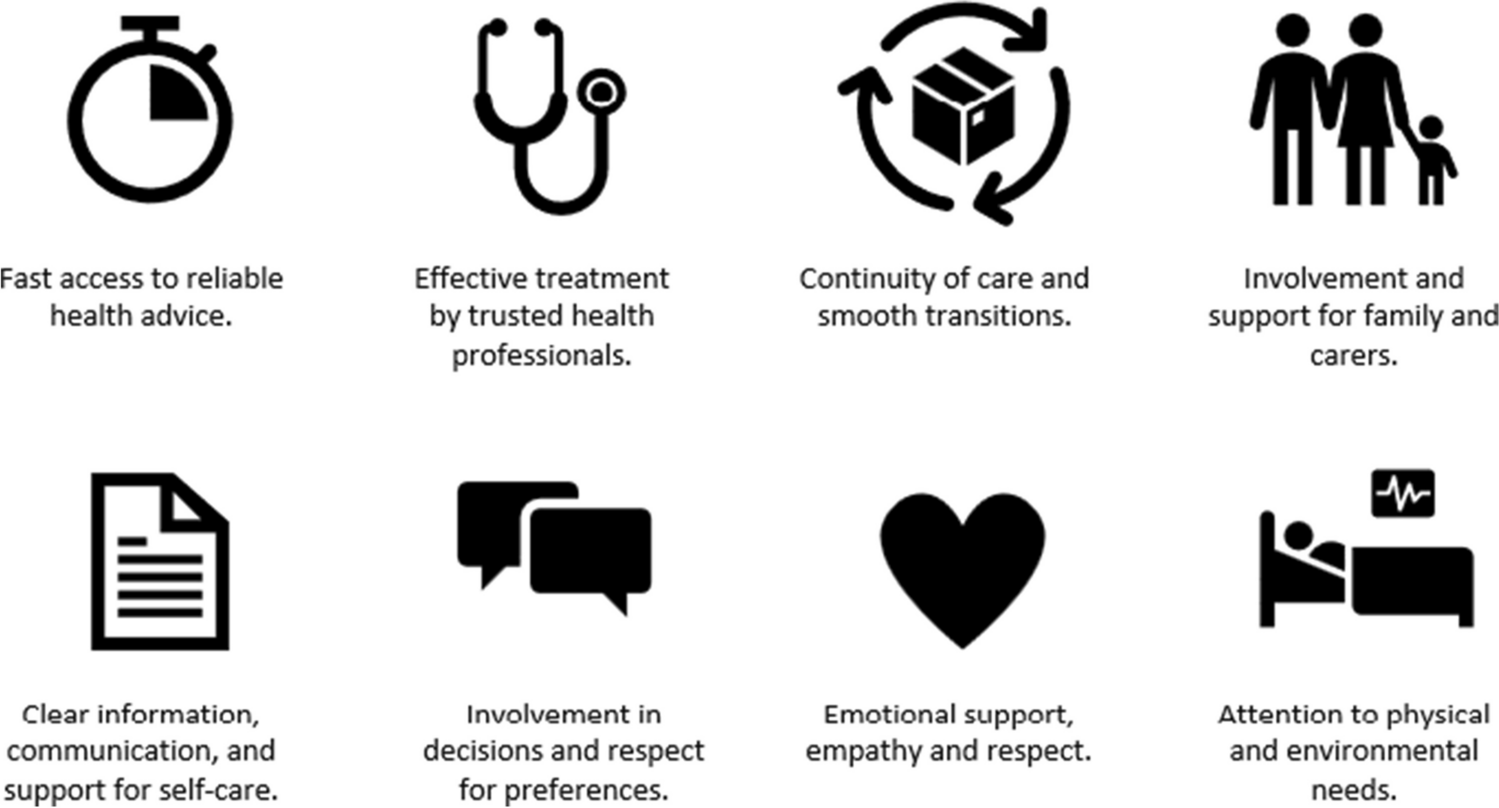
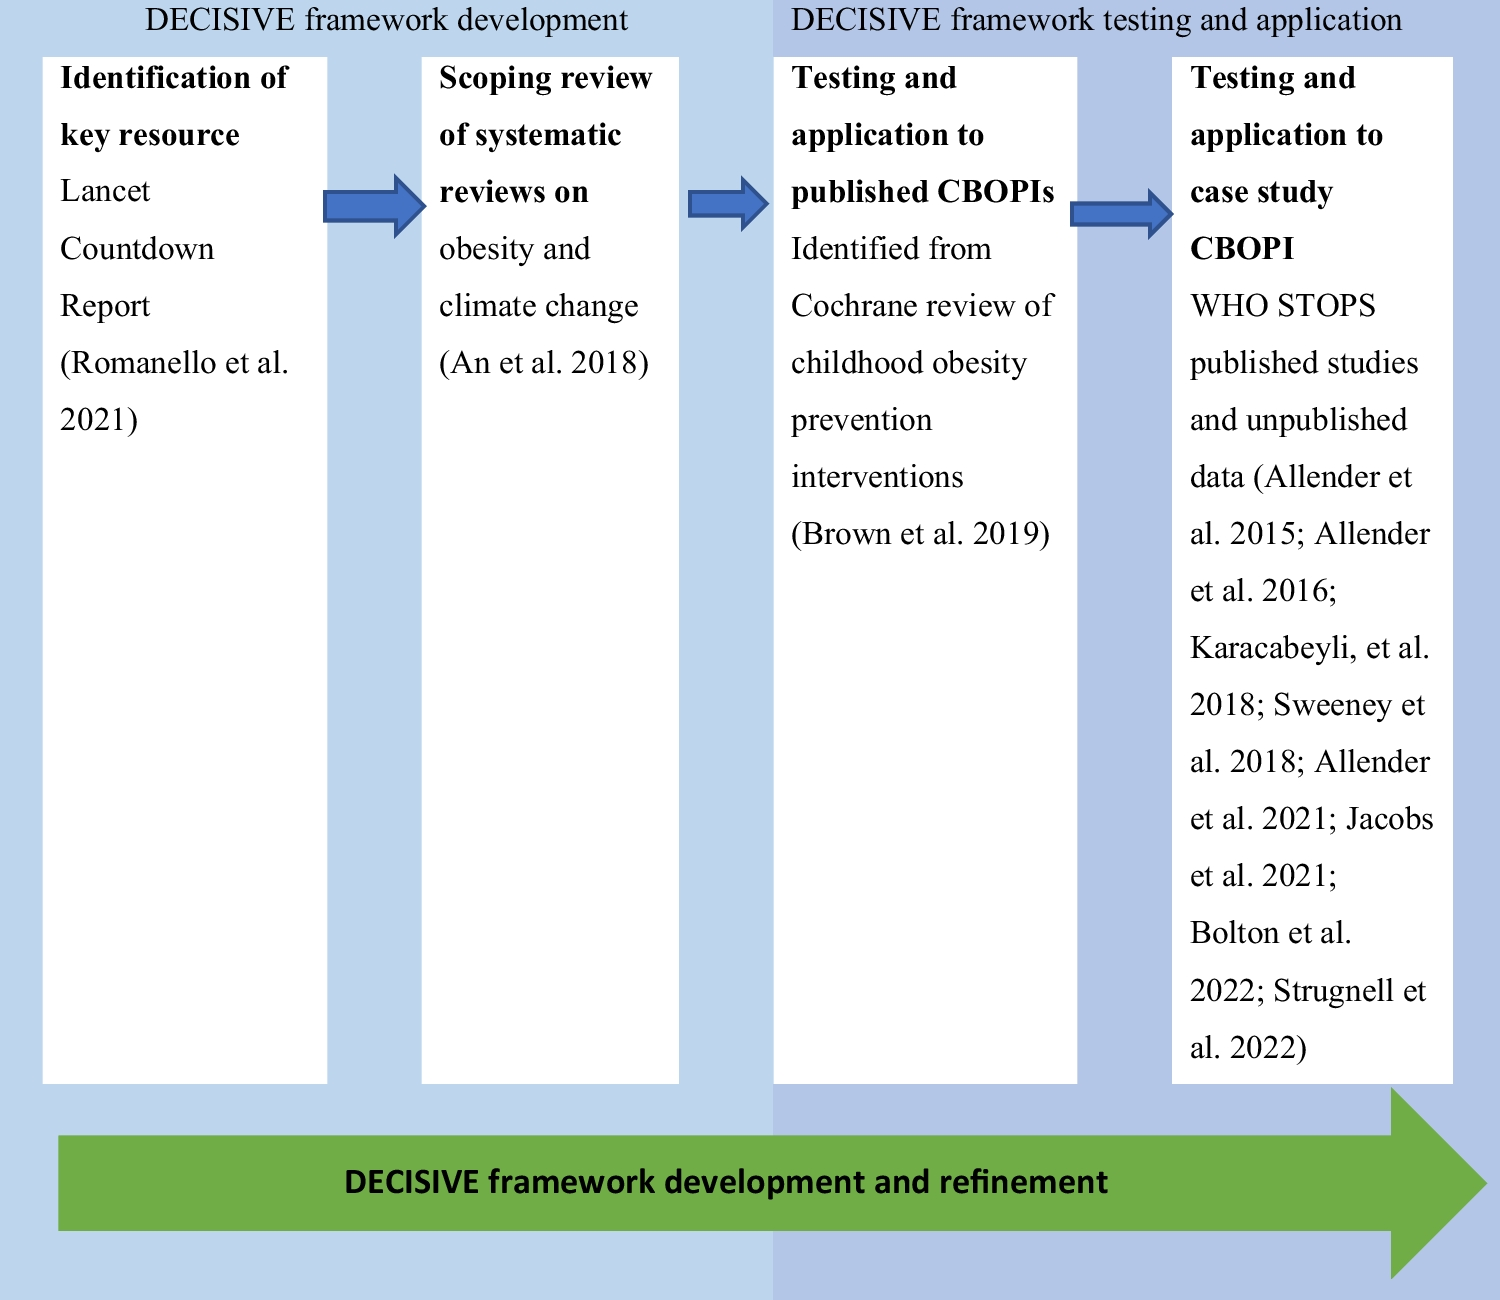
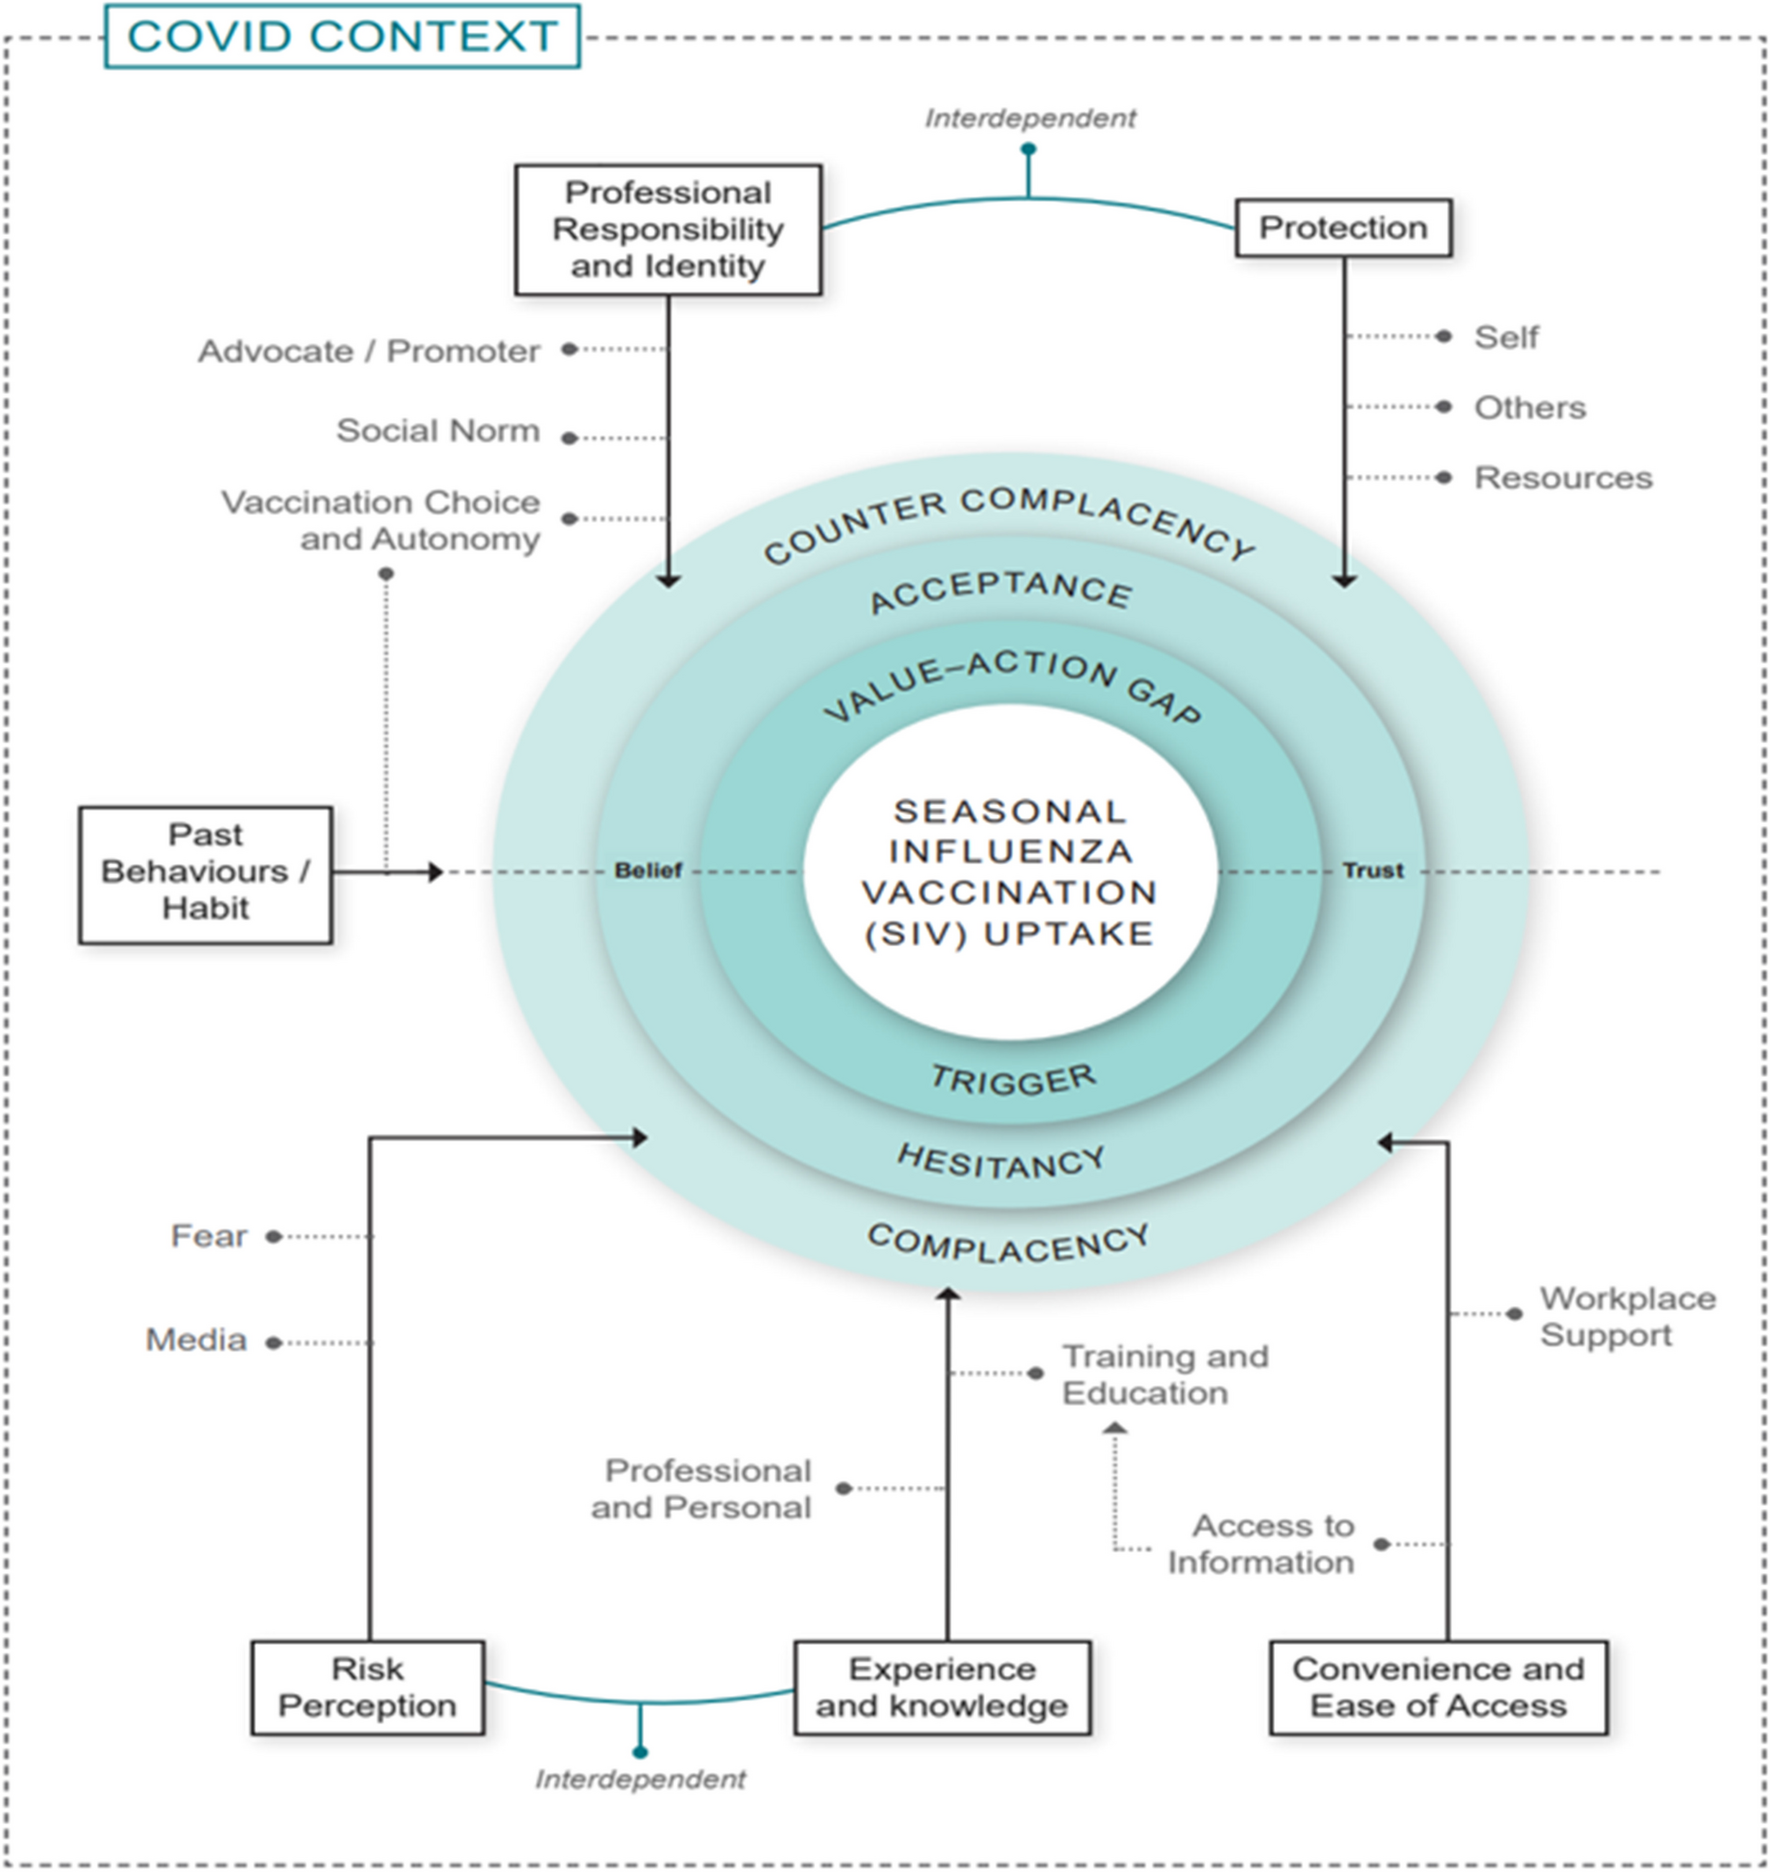
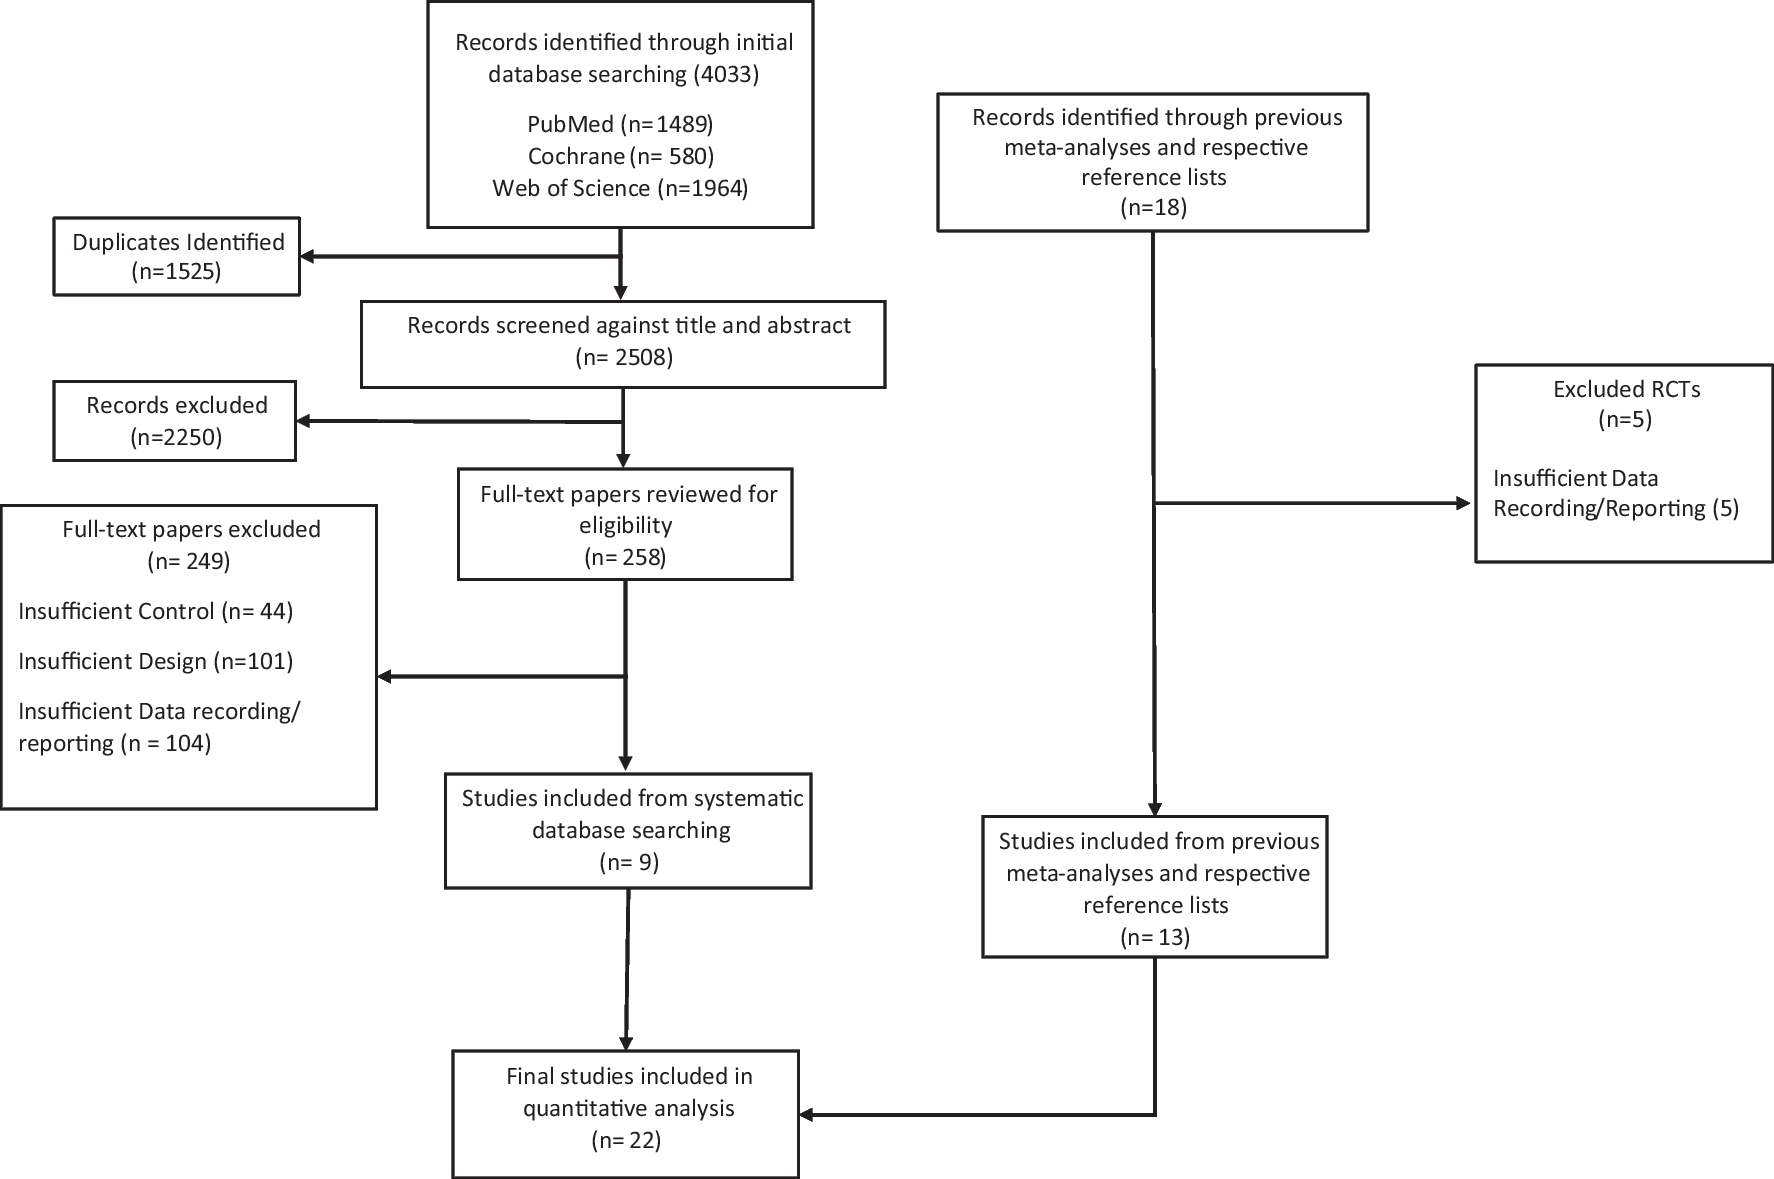
記住我

The global number of deaths in patients with lip and oral cavity cancer attributable to smoking in 1990 was 37,406.69, with an age-standardized mortality rate of 0.94 (95% CI 0.80, 1.10), while the global number of DALYs was 1,040,593.38, with an age standardized DALYs rate of 25.01 (95% CI 20.73, 29.33). In 2019, the number of deaths from this type of cancer attributable to smoking was 63,433.56, with an age-standardized mortality rate of 0.77 (95% CI 0.62, 0.93), and the number of DALYs was 1,656,259.98, with an age-standardized mortality rate of 19.69(95% CI 15.61, 23.93). The global number of deaths and DALYs for lip and oral cavity cancer attributable to smoking showed increasing trends year by year from 1990 to 2019, while the age-standardized mortality and DALYs rates showed decreasing trends (EAPC = –0.76 and –0.88, respectively), as shown in Table 1.
Table 1 Trends of mortality, DALYs and corresponding age-standardized mortality rate, and age-standardized DALY rate attributable to smoking in 1990 and 2019DALYs and mortality in different sex and age groupsThe number of deaths and DALYs, age-standardized mortality rate, and age-standardized DALYs rate of lip and oral cavity cancer were higher in men than in women globally in 1990 and 2019 (Table 1). The age-standardized mortality rate (men EAPC = –0.80; women EAPC = –0.94) and age-standardized DALYs rate (men EAPC = –0.87; women EAPC = –1.1) decreased from 1990 to 2019 for both men and women. The age-standardized mortality and DALYs rates decreased slightly more in women than in men, as shown in Table 1 and Fig. 1.
Fig. 1
Age-specific number (bar plot) and rate (line plot) of DALYs (A) and deaths (B) of lip and oral cavity cancer attributable to smoking in 2019 by sex. DALY, disability-adjusted life year
Overall, the number of deaths and DALYs were much higher in men than in women in all age groups, with peaks in the 60–64 age group. Meanwhile, women had the highest number of deaths in the 65–69 age group. The number of DALYs was highest in the 55–59 age group in men but in the 60–64 age group in women. Mortality rates were much higher in men than in women in all age groups, and the age-standardized mortality rates increased with increasing age in both men and women. The curve of the age-standardized DALYs rate in men was bell-shaped, i.e., it first increased and then decreased with age, peaking at 65–69, whereas the age-standardized DALYs rate in women increased slowly with age (Fig. 1).
DALYs and mortality in different countries and regionsFrom 1990 to 2019, the number of deaths and DALYs increased steadily in all SDI regions, with much lower number of deaths and DALYs in low-SDI regions. The age-standardized mortality and DALYs rates varied between different regions. The age-standardized mortality and DALYs rates showed overall decreasing trends in all regions except middle-SDI regions in which slight overall increasing trends were observed from 1990 to 2019 (age-standardized mortality rate, EAPC = 0.16; age-standardized DALYs rate, EAPC = 0.07). Specifically, middle-SDI regions showed an increasing trend from 1990 to 2012, and then a decreasing trend year by year. High-SDI regions showed a steady decline year by year, and the decline was largest in these regions (age-standardized mortality rate, EAPC = –1.60; age-standardized DALYs rate, EAPC = –1.74). The age-standardized mortality and DALYs rates were markedly higher in low-middle-SDI regions than in other regions in all years (Table 1, Figs. 2 and 3).
Fig. 2
The change trends of number and age-standardized lip and oral cavity cancer DALY, and mortality rate attributable to smoking among different SDI quintiles from 1990 to 2019. (A) Number of DALYs. (B) Number of deaths. (C) Age-standardized DALY rate. (D) Age-standardized mortality rate. DALY = disability adjusted life-year
Fig. 3
The EAPC of lip and oral cavity cancer age standardized rates attributable to smoking from 1990 to 2019 by regions. (A) The EAPC of age-standardized DALY rate. (B) The EAPC of age-standardized mortality rate. EAPC = estimated annual percentage change. DALY = disability adjusted life-year
In 2019, the three regions with the highest age-standardized mortality and DALYs rates were South Asia (1.59; 39.68), Eastern Europe (1.33; 40.59), and Central Europe (1.30; 37.67). The three regions with the lowest age-standardized mortality and DALYs rates were Central Latin America (0.23; 5.12), Western Sub-Saharan Africa (0.15; 3.85), and Andean Latin America (0.12; 2.79). From 1990 to 2019, East Asia, Oceania, and South Asia showed the greatest increase in the number of deaths and DALYs, and Australia, Eastern Europe, and high-income North America showed the smallest increase in the number of deaths and DALYs. Of the 21 geographical regions included in the analysis, East Asia (EAPC = 2.32), Oceania (EAPC = 0.07), and Eastern Europe (EAPC = 0.03) showed the greatest increase in mortality, whereas Australia (EAPC = –3.58), Central Latin America (EAPC = –2.42), and high-income North America (EAPC = –2.16) showed the largest decline in mortality. The three regions with the highest EAPC values for DALYs were East Asia (2.30), Oceania (0.03), and Eastern Europe (–0.01), and the regions with the largest decline in the number of DALYs were also the regions with the largest decline in mortality, namely Australia (EAPC = –3.52), Central Latin America (EAPC = –2.51), and high-income North America (–2.38). It is noteworthy that East Asia showed the largest increase in the mortality and DALYs rates, as shown in Table 1 and Fig. 3.
Of the 204 countries and regions analyzed, the three countries with the highest age-standardized mortality and DALYs rates were Kiribati, Pakistan, and Palau and the three countries with the lowest age-standardized mortality and DALYs rates were Nigeria, Peru, and Ghana. The three countries with the greatest increase in the number of deaths from 1990 to 2019 were the United Arab Emirates, Cabo Verde, and the Northern Mariana Islands, and the three countries with the smallest increase in the number of deaths during that period were Norway, France, and Croatia. The countries with the greatest increase in the number of DALYs were the United Arab Emirates, Cabo Verde, and Qatar, and the three countries with the smallest increase in the number of DALYs were Croatia, France, and Italy. From 1990 to 2019, the countries with the largest increase in mortality and DALYs rates were the Northern Mariana Islands (EAPC = 3.79) and Cabo Verde (EAPC = 2.84). The three countries with the greatest decrease in mortality rates were Australia (EAPC = –3.69), Colombia (EAPC = –3.54), and Canada (EAPC = –3.53). The three countries with the greatest decline in DALYs rates were Colombia (EAPC = –3.72), Canada (EAPC = –3.70), and Singapore (EAPC = –3.69), as shown in Table 1, Figs. 1 and 2.
留言 (0)