
Remember me

Coronary heart disease (CHD) is a leading cause of death worldwide. In the United States, an estimated 20.1 million adults aged 20 years or above have CHD (Virani et al., 2021), and in China, about 11.4 million people aged 15 years or above are diagnosed with CHD (The Writing Committee of the Report on Cardiovascular Health and Diseases in China, 2022). A rapid increase in the prevalence of CHD is expected because of the rising prevalence of cardiac risk factors (e.g., hypertension, diabetes mellitus) and population aging (National Center for Cardiovascular Diseases, 2021). Type D personality, also called distressed personality, is defined as the interaction of high levels of negative affectivity and social inhibition (Denollet et al., 2010). Type D personality has been associated with 19%–51% of patients with CHD (Enatescu et al., 2021; Mesa-Vieira et al., 2021) and is an established psychosocial risk factor affecting CHD prognosis.
Empirical evidence indicates that cardiac patients with type D personality face an increased risk of adverse health outcomes (Grassi et al., 2022; Manoj et al., 2020). For example, patients with CHD who have a type D personality face an up to 3 times higher risk of experiencing a cardiovascular event than those with other personality types (Leu et al., 2019). In addition, compared with patients with no type D personality, patients with type D personality who undergo percutaneous coronary intervention face 3.7-fold and 2.7-fold higher risks of depression and anxiety, respectively, during follow-up (AL-Qezweny et al., 2016). Having a type D personality may also worsen the effects of other psychosocial risk factors such as depression, negatively affecting well-being and further impairing quality of life (Jo et al., 2019).
Psychophysiological and behavioral pathways have been proposed to elucidate the link between type D personality and adverse health outcomes (Enatescu et al., 2021; Kupper & Denollet, 2018), with the former focused on physiological responses elicited by a range of psychological disorders experienced by individuals with type D personality (Enatescu et al., 2021; Kupper & Denollet, 2018) and the latter focused on the predisposing, negative effects of type D personality on various health-related behaviors such as lifestyle modification and adherence to medication or cardiac rehabilitation that lead to poor cardiac prognoses (Kupper & Denollet, 2018). In addition, patients with type D personalities typically cope less effectively with their illness than their non-type-D counterparts (Grassi et al., 2022). Thus, these two pathways suggest potentially efficacious targets to improve health outcomes in patients with type D personalities.
Despite the poor health outcomes associated with type D personality, few interventional studies have been published on this subpopulation. Sogaro et al. (n = 59) investigated the effects of cardiac rehabilitation on health outcomes in cardiac patients with type D personality and found significant improvements in psychological health and quality of life after attending a 4-week intensive cardiac rehabilitation program (Sogaro et al., 2010). However, compared with their non-type-D counterparts, those with type D personality still showed poorer psychological well-being. A systematic review was conducted to synthesize the evidence on interventions for cardiovascular patients with type D personality, providing preliminary but low-quality evidence (e.g., nonrandomized controlled trials, small sample sizes) on the use of cardiac rehabilitation in this subpopulation (Cao et al., 2016). In addition, whether cardiac rehabilitation may be generalized to this population in China requires careful consideration because of the limited cardiac rehabilitation resources available. Therefore, in this study, we aimed to develop an educational intervention to modify the behavioral pathway and to test the effects of this intervention on psychological health, lifestyle behaviors, and quality of life in patients with CHD and type D personality in China using a randomized controlled trial design.
Methods Study Design, Participants, and SettingsA randomized controlled trial with repeated measures was adopted. Patients who were admitted to the cardiac wards of two university-affiliated hospitals in Changsha, China, from October 2015 to August 2016 were approached and screened based on the inclusion and exclusion criteria. The inclusion criteria included (a) age ≥ 18 years, (b) diagnosis of CHD confirmed by a physician and type D personality as determined using the Type D Scale-14 (Denollet, 2005), (c) being available for telephone follow-up, and (d) being able to provide written consent. Following Huang (2008), patients who scored ≥ 6 on the Negative Affectivity subscale and ≥ 9 on the Social Inhibition subscale on the Type D Scale-14 were classified in this study as meeting the criteria for type D personality (Huang, 2008). Patients with physical immobility as indicated by medical records; diagnosed with psychiatric illness, a cognitive disorder such as dementia, or a terminal disease such as cancer; or currently participating in another study were excluded.
RandomizationA research assistant who was not involved in any other procedures of the study generated the randomization sequence using an online randomization program (http://www.randomization.com/). The same research assistant prepared opaque and sealed envelopes with a card inside indicating group allocation. These envelopes were sequentially numbered and distributed to participants based on their order of enrollment in this study. Finally, the participants were assigned randomly to either the intervention or control group.
Sample SizeSample size was calculated based on a previous Chinese study on patients with acute myocardial infarction that reported a medium intervention effect (Cohen's effect size of 0.54) on psychological health (Wang et al., 2012). Using G*Power (Version 3.1), a sample of 110 participants was estimated for this study with a power of 80% at a significance level of .05. Considering an attrition rate of 15%, 128 patients with CHD and type D personality (64 per group) was required.
InterventionSocial cognitive theory by Bandura (2012) was used to guide this study. According to the social cognitive theory, human behavior is a dynamic process influenced by personal (e.g., beliefs, perceptions, and feelings toward the illness) and environmental (e.g., access to health resources after discharge, support from outside) factors. Previous studies have suggested that cardiac patients with type D personality hold misperceptions toward their illness (e.g., symptoms cannot be effectively controlled), have poor social support, and are less likely to seek professional advice on illness management (Mols et al., 2020; Park et al., 2021). Therefore, in this study, an educational intervention based on the social cognitive theory was developed that focuses on correcting misperceptions and providing support and resources to facilitate and enhance behavioral change in patients with CHD and type D personality.
The 12-week educational intervention incorporated two face-to-face, in-hospital education sessions and six telephone follow-ups after hospital discharge. The first face-to-face education session involved (a) assessing the perception of the participants toward their illness to recognize misperceptions, evaluating their psychological distress, and identifying the underlying causes and (b) providing education based on the results of the assessment that addressed CHD information, risk factors, and medical treatment and the influence of lifestyle (e.g., diet, physical activity, stress) on CHD prognosis. In the second session, the participants were trained on skills necessary to cope with their illness and facilitate self-management after discharge. These skills included consuming a healthy diet, exercise, and symptom and stress management. The participants were also instructed to use goal-setting techniques to achieve behavioral change. Each face-to-face session lasted for at least 1 hour. A booklet on CHD management and a logbook were provided to facilitate behavioral change. Telephone follow-ups were initiated during the first week after hospital discharge. During each call, participants were assessed for behavior change progress as well as problems and barriers encountered, with feedback and possible solutions provided based on individual participant need. Each call lasted 15–20 minutes.
The usual care received by both groups included routine medical and nursing care provided by the hospitals. Brief information about CHD and treatment as well as general advice on lifestyle change were provided by nurses during the normal course of their duties. The intervention group received the educational intervention in addition to usual care, whereas the control group received usual care only.
Measures and Measurements Demographic and clinical dataDemographic data on age, gender, marital status, educational level, and employment status and clinical characteristics, including New York Heart Association class, history of hypertension and diabetes, cardiac intervention received, blood pressure, and lipid profile, were collected.
Anxiety and depressionAnxiety and depression were measured using the Chinese version of the Hospital Anxiety and Depression Scale (Wang et al., 2009). This scale comprises a seven-item depression subscale and a seven-item anxiety subscale, with total scores for each subscale ranging from 0 to 21 and higher scores indicating higher levels of depression and anxiety, respectively. Satisfactory internal consistency of the Chinese version of the Hospital Anxiety and Depression Scale was established on a myocardial infarction sample with Cronbach's alphas of .85, .79, and .79 for the overall scale and anxiety and depression subscales, respectively (Wang et al., 2009).
Quality of lifeQuality of life was measured using the Chinese version of the Seattle Angina Questionnaire (SAQ). The 19-item SAQ is a disease-specific questionnaire designed to measure quality of life in cardiac patients (S. H. Liu, 2003) that consists of 19 items to assess five dimensions of quality of life, including physical limitation, angina stability, angina frequency, treatment satisfaction, and disease perception. A standard score for each dimension is calculated using the formula: [(sum of item scores − the lowest possible scale score) / the range of the scale] × 100. The validity and reliability of the Chinese version of the SAQ were previously established in a Chinese sample of patients with CHD (S. H. Liu, 2003).
Health-promoting behaviorsThe Chinese version of the Health-Promoting Lifestyle Profile (Chen, 1999) is a 40-item instrument used to measure six domains of health-promoting behavior. Five of the six domains (excluding the domain of self-actualization) were employed to measure health-promoting behaviors in this study. The total possible score for these five domains ranges from 0 to 96, with higher scores indicating better health-promoting behaviors. The Chinese version of the Health-Promoting Lifestyle Profile has shown good psychometric properties, with Cronbach's alphas of .92 for the entire scale and .69–.84 for the subscales (Chen, 1999).
Self-efficacySelf-efficacy was measured in this study using the Chinese version of the General Self-Efficacy Scale (Zhang & Schwarzer, 1995). The general self-efficacy consists of 10 items used to evaluate beliefs related to effectively dealing with stressful life events. Each item is rated on a 4-point Likert scale. Total possible scores range from 10 to 40, with higher scores indicating higher levels of self-efficacy. The Chinese version of the General Self-Efficacy Scale has shown satisfactory internal consistency (Cronbach's alpha of .91; Zhang & Schwarzer, 1995).
Data Collection ProcedurePatients admitted to the cardiac wards were approached and initially screened by a trained nurse based on the inclusion and exclusion criteria. Those who met these criteria were then further screened for type D personality using the Type D Scale-14, with eligible patients then invited to participate. Written informed consent was obtained from those who agreed to participate after the study purpose and procedures, potential benefits and risks, and the right to withdrawal at any time were explained. Next, baseline data (T0) were collected by two trained research assistants. The participants were interviewed and asked to complete the questionnaires independently. Clinical data were abstracted from patients' medical records. Follow-up data were collected at 1 month (T1) and 3 months (T2) after study enrollment by the same research assistants. Regular audit reviews (every 2 weeks) between the researcher and the two research assistants were conducted to ensure interrater reliability.
Data AnalysisData were analyzed using IBM SPSS Statistics Version 25.0 (IBM, Inc., Armonk, NY, USA). Descriptive statistics (e.g., means, standard deviations, frequency, percentage) were used as appropriate. Between-group differences were examined using independent t test, analysis of variance, chi-square test, or nonparametric test as appropriate. Generalized estimating equation (GEE) model was used to examine changes in outcome variables between the two groups. In the GEE analysis, AR(1) was chosen for the working correlation matrix, whereas a linear model was chosen for the link function, as the outcome data in this study were normally distributed. Potential covariates were identified when either (a) variables for which a p < .25 between study groups at baseline was indicated (Bursac et al., 2008) or (b) variables were identified in the literature as having potential intervention effects in patients with type D personality (i.e., educational level, disease severity, baseline self-efficacy, negative affectivity score; Cao et al., 2016; L. Liu et al., 2018). These variables were then treated in GEE analysis as covariates. Both crude (unadjusted) and adjusted models from the GEE analysis were output. Goodness of fit for the adjusted GEE model was examined. Intention-to-treat analysis was adopted. The significance level was set as .05 and two tailed.
Ethics ConsiderationsEthical approval for this study was obtained from the Joint Chinese University of Hong Kong-New Territories East Cluster Clinical Research Ethics Committee (CREC Ref. No. 2015.352). Written consent was obtained from each participant after explaining to them the study purpose, procedures, benefits, and potential risks. The right to withdraw or discontinue participation at any time without any penalty along with confidentiality and anonymity were assured to participants. This article is reported in accordance with Consolidated Standards of Reporting Trials guidelines.
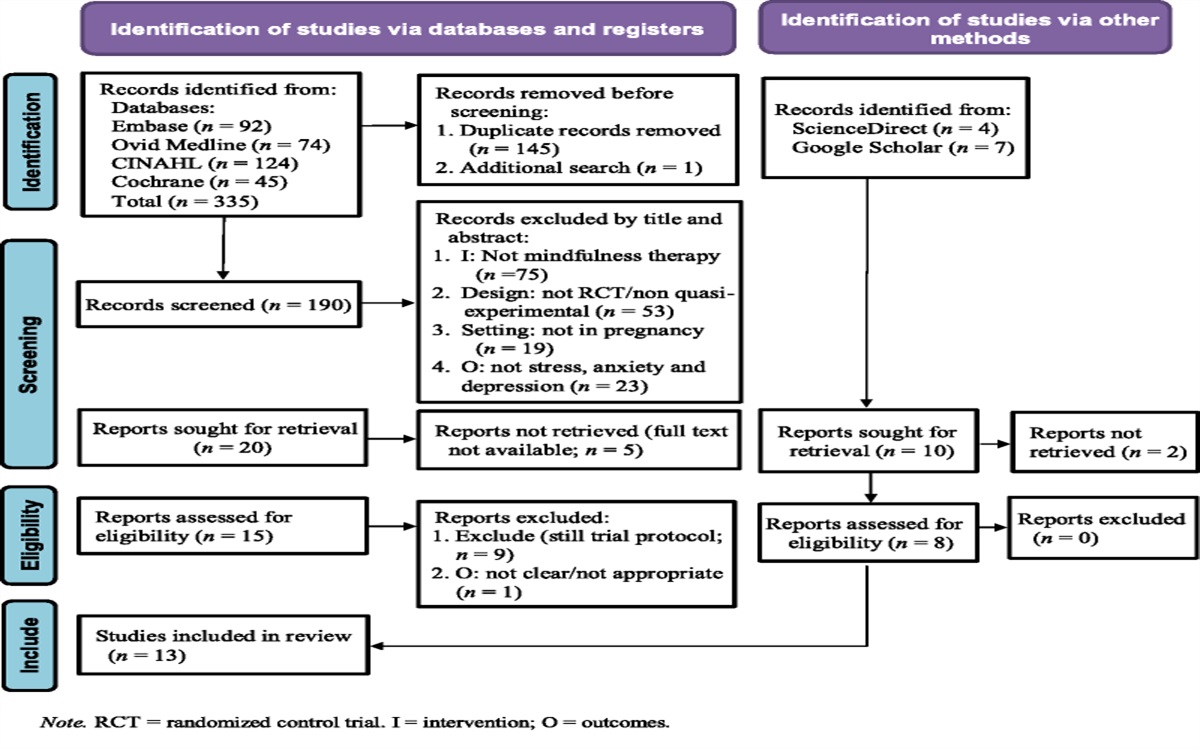
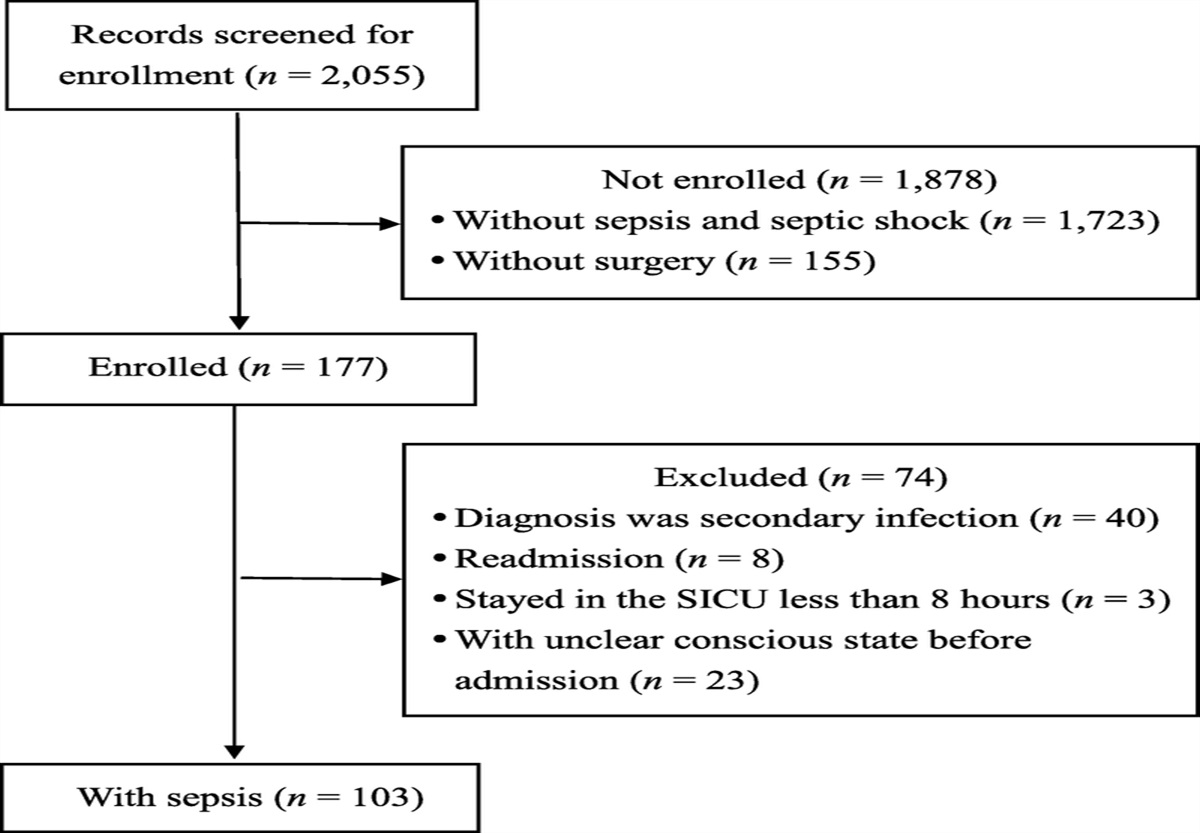
Results Participant RecruitmentOne hundred sixty-six of 1,836 patients were initially screened, with 128 patients finally enrolled as participants and randomized. Six and ten participants dropped out at 1 month (T1) and 3 months (T2), respectively. The main reasons for their withdrawal included lack of interest, time conflicts, and being unable to be reached. The participant recruitment flow is presented in Figure 1.
 Figure 1:
 Flow Diagram of Participant Recruitment
Sociodemographic and Clinical Characteristics of ParticipantsSociodemographic and clinical characteristics of the participants are presented in Table 1. The mean age was 61.02 (SD = 9.47) years, and over 70% were male. Over half had received a cardiac intervention (percutaneous transluminal coronary angioplasty or percutaneous coronary intervention), and 55.5% had hypertension. In terms of anxiety and depression, 36.7% reported anxiety and 34.4% experienced depression at baseline. With the exception of hypertension status, no significant differences in terms of sociodemographic, clinical, or outcome variables between the two study groups were found (Table 1). More hypertension cases were observed in the intervention group than the control group (χ2 = 5.35, p = .021). Hypertension, social inhibition score, and potential confounders (educational level, disease severity, negative affectivity score, and baseline self-efficacy) suggested by the literature were adjusted in the GEE analysis.
Table 1 - Sociodemographic and Clinical Characteristics of Participants and Intergroup Differences Characteristic Total (N = 128) Control (n = 64) Intervention (n = 64) t/χ2 p n % n % n % Age (years; M and SD) 61.02 9.47 61.17 9.40 60.88 9.60 0.18 .860 NA score (M and SD) 13.85 4.74 13.56 4.53 14.14 4.97 −0.69 .492 SI score (M and SD) 12.91 3.86 12.27 3.38 13.56 4.22 −1.92 .057 Gender (male) 92.00 71.90 19.00 29.70 17.00 26.60 0.18 .694 Marital status 1.0 Married 125 97.70 63 98.40 62 96.90 Single/divorced/widowed 3 2.30 1 1.60 2 3.10 Educational level 1.09 .581 Primary school or less 33 25.80 18 28.10 15 23.40 Secondary school 75 58.60 38 59.40 37 57.80 College or above 20 15.60 8 12.50 12 18.80 Employment status 0.05 .818 Employed 23 18.00 12 18.80 11 17.20 NYHA class 2.48 .290 I 21 16.40 9 14.10 12 18.80 II 69 53.90 32 50.00 37 57.80 III 38 29.70 23 35.90 15 23.40 Receiving PCI (yes) 70 54.70 34 53.10 36 56.20 0.13 .723 Hypertension (yes) 71 55.50 29 45.30 42 65.60 5.35 .021 Diabetes (yes) 35 27.30 20 31.20 15 23.40 0.94 .321 M SD M SD M SD t p Systolic blood pressure 129.00 17.16 129.89 14.60 129.39 19.53 0.16 .870 Diastolic blood pressure 77.79 11.39 78.64 11.26 76.94 11.54 0.85 .400 Total cholesterol 4.22 1.21 4.16 1.27 4.28 1.15 −0.59 .557 Triglycerides 1.85 1.38 1.81 1.49 1.89 1.25 1,926.5 a .526 High-density lipoprotein 1.10 0.28 1.10 0.31 1.10 0.26 −0.08 .938 Low-density lipoprotein 2.44 0.91 2.40 0.98 2.48 0.86 −0.48 .632 Anxiety 6.81 3.75 6.77 3.87 6.86 3.65 −0.14 .888 Depression 6.65 3.01 6.53 3.01 6.77 3.03 −0.44 .661 Health-promoting behaviors (total score) 45.98 11.98 46.53 10.30 45.44 13.52 0.52 .608 Quality of life Physical limitation 58.26 13.38 59.38 12.44 57.15 14.30 0.94 .349 Angina stability 29.88 31.85 32.03 32.27 27.73 31.53 0.76 .448 Angina frequency 70.23 27.79 73.12 24.75 67.34 30.46 1.13 .261 Treatment satisfaction 55.92 11.36 56.18 9.87 55.65 12.75 0.26 .796 Disease perception 33.20 4.81 31.51 18.33 34.09 15.84 −1.11 .266 Self-efficacy 33.20 17.15 24.97 4.90 25.05 4.76 −0.09 .927Note. NA = negative affectivity; SI = social inhibition; NYHA = New York Heart Association; PCI = percutaneous coronary intervention.
a Mann–Whitney U test.
The control group showed a significant decrease in anxiety and depression over time in both the crude and adjusted models (all ps < .05). Compared with the control group, the intervention group showed a greater decrease in anxiety (Group × Time 1: β = −1.20, 95% CI [−2.23, −0.17]; Group × Time 2: β = −1.84, 95% CI [−2.91, −0.77]) and depression (Group × Time 1: β = −1.18, 95% CI [−1.94, −0.42]; Group × Time 2: β = −1.41, 95% CI [−2.27, −0.55]) at both T1 and T2. The GEE results for anxiety and depression are shown in Table 2.
Table 2 - GEE Results of Intervention Effects on Anxiety and Depression Outcome Variable Crude Model Adjusted Model a β 95% CI β 95% CI Anxiety Group 0.09 [−1.20, 1.39] −0.17 [−1.36, 1.02] T1 −1.79 [−2.56, −1.02] −1.80 [−2.57, −1.03] T2 −1.76 [−2.54, −0.98] −1.80 [−2.59, −1.03] Intervention × T1 −1.22 [−2.25, −0.19] −1.20 [−2.23, −0.17] Intervention × T2 −1.88 [−2.95, −0.81] −1.84 [−2.91, −0.77] Depression Group 0.23 [−0.80, 1.27] 0.13 [−0.78, 1.03] T1 −1.04 [−1.62, −0.47] −1.05 [−1.62, −0.49] T2 −0.91 [−1.63, −0.19] −0.94 [1.66, −0.22] Intervention × T1 −1.20 [−1.96, −0.44] −1.18 [−1.94, −0.42] Intervention × T2 −1.45 [−2.31, −0.59] −1.41 [−2.27, −0.55]Note. Only the model estimates of regression coefficients of the dummy variables for group (0 = the control group [reference], 1 = the intervention group), time points (T1 and T2 with the baseline [T0] as reference), and group interaction terms (Intervention × T1 and Intervention × T2) are shown for the generalized estimating equation (GEE) model. Group indicates group difference on anxiety and depression at baseline. T1 and T2 denote the changes of anxiety and depression in the control group at 1 and 3 months, respectively, with reference to the baseline level. Intervention × T1 and Intervention × T2 indicate the additional changes in anxiety and depression in the intervention group compared with the control group at 1 and 3 months, respectively.
a Educational level, New York Heart Association class, hypertension, self-efficacy, social inhibition score, and negative affectivity score were adjusted in the GEE model. The goodness of fit (quasi-likelihood under independence model criterion) of the adjusted model was 2922.50 for anxiety and 2330.80 for depression.
Although the control group showed improvements in health-promoting behaviors, these improvements did not reach significance (Table 3). The intervention group reported more-significant improvements than the control group in overall health-promoting behaviors across the study period (Group × T1: β = 5.70, 95% CI [2.30, 9.10]; Group × T2: β = 11.50, 95% CI [7.77, 15.23]; Table 3). With regard to specific behaviors, health responsibility, exercise, and stress management improved more significantly in the intervention group than the control group at both T1 and T2, whereas significant improvements in nutrition behavior and interpersonal support were observed at T2 only.
Table 3 - GEE Results for Intervention Effects on Health-Promoting Behaviors Outcome Variable Crude Model
Comments (0)