
記住我

To diagnose hypertension in clinical practice, the gold standard is ambulatory blood pressure (BP) monitoring where the cutoff point for hypertension in daytime recordings is 135/85 mmHg, in nighttime recordings 120/70 mmHg, and in 24-hour recordings 130/80 mmHg [1]. As ambulatory BP monitoring requires resources and may cause discomfort, the diagnosis of hypertension is commonly achieved by repeated home BP measurements. The cutoff point of hypertension in home measurements is also 135/85 mmHg [1].
BP is characterized by high variability, and based on wrist-worn tracker analyses of heart rate [2], a single day contains about ~100 000 SBP and DBP values. The standard home recording of BP is carried out in the seated position [1], and excludes information about posture-related changes in BP. The cuff-based BP measurement was recently reported to underestimate SBP by 6 mmHg and overestimate DBP by 6 mmHg, and these effects were progressively increased with advancing age [3,4]. The authors suggested that more personalized methods of BP measurements should be developed [3]. The common phenotypes white-coat hypertension and masked hypertension add complexity to the diagnosis of hypertension and evaluation of cardiovascular risk [5,6]. Even moderate changes in BP in the absence of hypertension are associated with cardiovascular risk, and recent evidence suggests that the risk increases gradually from SBP level of 90 mmHg [7,8].
The study of hemodynamic changes associated with hypertension is usually carried out in the laboratory [9–12]. For instance, a wealth of information regarding wave reflections and arterial stiffness has been achieved under laboratory conditions [10,13–16]. The inclusion of head-up tilt in the measurements has provided information about the influence of posture on cardiovascular regulation [10,12,17,18]. The BP response to upright posture is variable, ranging from orthostatic hypotension to orthostatic hypertension, whilst the divergent BP reactions to upright posture have also an impact on patient prognosis [19–23]. The hemodynamic changes in response to upright posture are also influenced by antihypertensive medication [10], cardiovascular disease [24], age [25], and sex [18].
As a major proportion of research focusing on the hemodynamics of hypertension has been performed under laboratory conditions, our objective was to compare the results of tonometric laboratory BP recordings versus ambulatory daytime BP measurements and evaluate possible laboratory cutoff values for hypertension. This information mainly serves research purposes but may be helpful in the estimation of the reliability and validity of the laboratory measurements for real-life situations. We also compared supine and upright BP during laboratory measurements with ambulatory daytime BP and evaluated the accuracy of the laboratory measurements to classify patients as normotensive and hypertensive.
Methods Study populationThe study included subjects participating in our study on noninvasive hemodynamics, recruiting patients with primary and secondary hypertension and normotensive subjects (clinical trial registration NCT01742702) [26,27]. Written consent was given by all participants. The study complies with the declaration of Helsinki and has been approved by the Tampere University Hospital ethics committee (code R06086M).
We included those participants of the study who had participated in the recording of ambulatory 24-hour BP and laboratory measurements. We excluded subjects with incomplete ambulatory or laboratory recordings and subjects with chronic renal insufficiency stage 4–5 [28]. The present study consisted of 410 participants with a mean age of 50 years and mean BMI of 28 kg/m2. Based on ambulatory daytime recordings [1], 69 participants were normotensive and 190 were unmedicated hypertensive patients, and 151 were medicated hypertensive patients (Table 1). The diagnosis and treatment of hypertension were conducted in each subject’s regional primary or secondary health care unit. Altogether 42 patients had secondary hypertension: primary aldosteronism (n = 29), cortisol-induced hypertension (n = 5), renal hypertension (n = 5), and renovascular hypertension (n = 3). Medications used by the participants are presented in Supplementary Table 1, Supplemental digital content 1, https://links.lww.com/BPMJ/A195.
Table 1 - Basic clinical characteristics, laboratory values, and mean blood pressure during ambulatory daytime recordings in normotensive subjects, unmedicated hypertensive patients, and medicated hypertensive patients Variable Normotensive (n = 69) Unmedicated hypertensive (n = 190) Medicated hypertensive (n = 151) Male/female (n) 37/32 118/72 112/39a Age (years) 45 (15) 47 (12) 57 (12)a,b BMI (kg/m2) 25 (4) 28 (5)a 29 (5)a Cornell voltage product (ms × mm) 1640 (1000) 1800 (630) 1940 (1000)a Creatinine (µmol/L) 76 (15) 80 (51) 81 (18) Sodium (mmol/L) 140.9 (2.0) 141.2 (1.8) 140.6 (2.7) Potassium (mmol/L) 3.7 (0.2) 3.8 (0.3) 3.7 (0.4) Glucose (mmol/L) 5.4 (0.7) 5.6 (0.6) 6.3 (1.5)a,b Total cholesterol (mmol/L) 4.8 (1.0) 5.4 (1.0)a 5.0 (1.1)b HDL cholesterol (mmol/L) 1.7 (0.5) 1.5 (0.4)a 1.4 (0.4)a LDL cholesterol (mmol/L) 2.8 (0.9) 3.5 (0.9)a 3.2 (1.0)b Triglycerides (mmol/L) 1.0 (0.5) 1.3 (0.7)a 1.4 (0.7)a SBP (mmHg) Ambulatory daytime 123 (7) 144 (11)a 140 (15)a,b Laboratory mean(supine+upright) 124 (13) 145 (15)a 140 (17)a,b Diastolic blood pressure (mmHg) Daytime diastolic 78 (4) 92 (7)a 85 (8)a,b Laboratory mean(supine+upright) 73 (8)c 87 (9)a,c 82 (10)a,cLaboratory values are calculated from the means of the last 3 min during the 5-minute supine and the last 3 min during the 5-minute head-up tilt recordings; mean (SD).
HDL, high-density lipoprotein; LDL, low-density lipoprotein.
aP < 0.05 versus normotensive.
bP < 0.05 versus unmedicated hypertensive.
cP < 0.05 versus corresponding ambulatory daytime diastolic blood pressure.
All participants went through ambulatory, office, and laboratory BP recordings, performed with a median of 7 days apart (25th–75th percentiles 0–18 days). Ambulatory BP recording was performed with Microlife WatchBP O3 (Microlife AG, Widnau, Switzerland) [29] or Mobil-O-Graph (IEM GmbH, Stolberg, Germany) [30]. Daytime BP values were recorded at 20-minute intervals and nighttime at 30-minute intervals. The mean daytime values were applied to the present study. Seated office BP was measured according to the guidelines [1] using a sphygmomanometer (Heine Gamma G7, Herrsching, Germany).
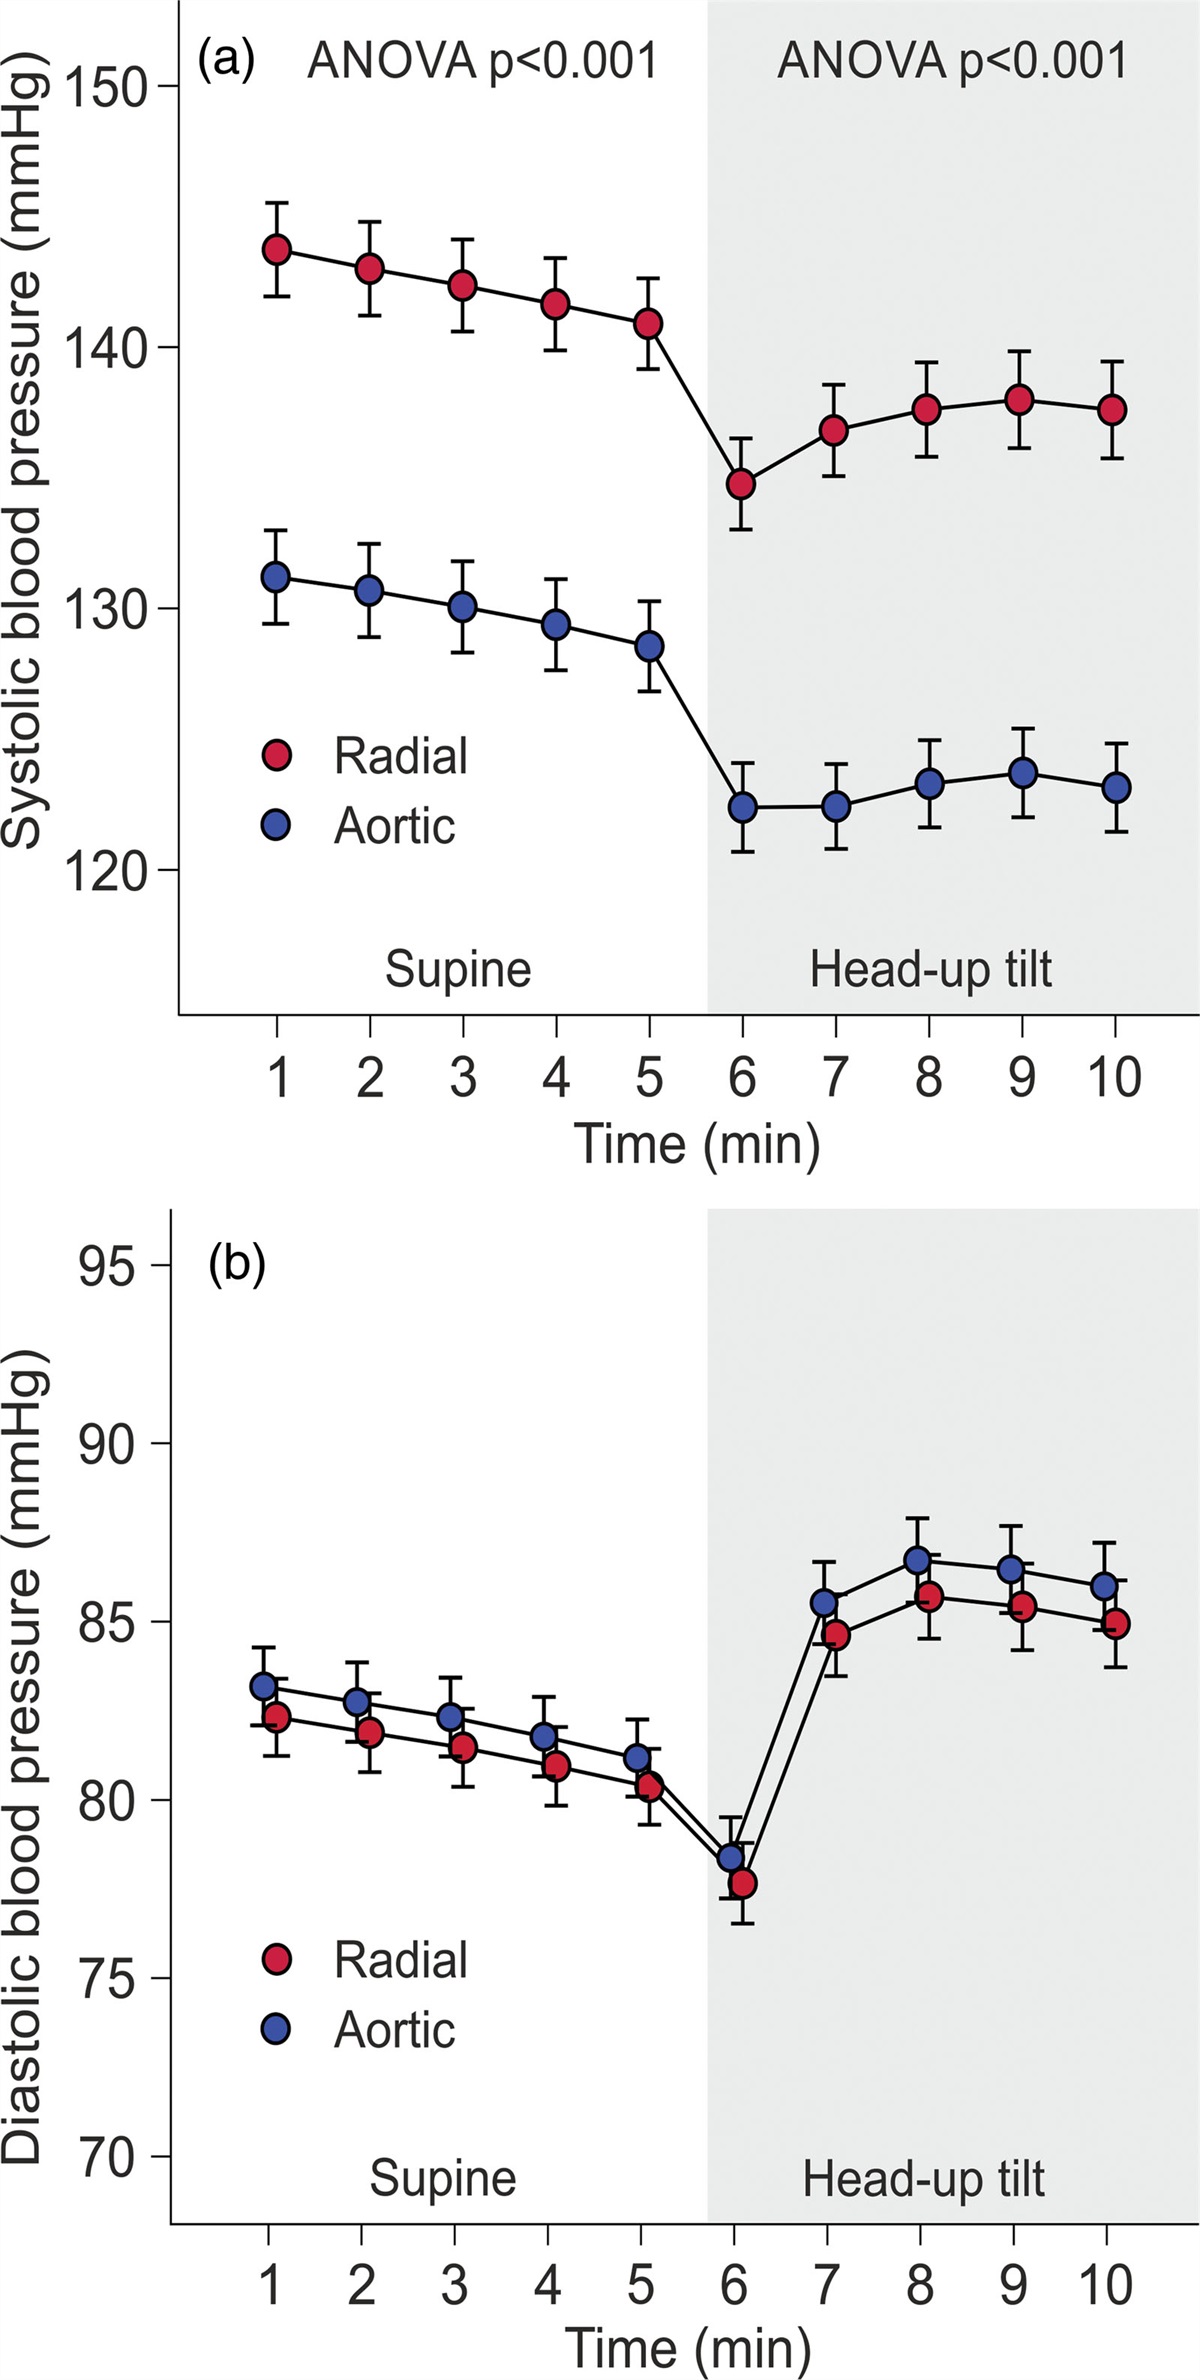
In the laboratory, radial BP from the left wrist was recorded using a tonometric sensor (Colin BP-508T; Colin Medical Instruments Corp., San Antonio, Texas, USA), calibrated approximately every 2.5 min with contralateral brachial BP measurements, coupled with the SphygmoCor PWMx monitoring system (AtCor Medical, Sydney, Australia). Previously, the Colin tonometric device provided accurate data throughout a wide BP range satisfying the Association for the Advancement of Medical Instrumentation standards for mean SBP and DBP measurements but was found to minimally exceed the allowable SD [31]. The subjects were to abstain from smoking, caffeine, and heavy meals for 4 h, and from alcohol for 24 h prior to the recordings. The left arm with the wrist sensor was abducted to 90 degrees in arm support, which held the measurement probe at the heart level in supine and upright positions. Before the measurement, an introductory head-up tilt was performed to familiarize the study subject with the protocol [25]. Aortic BP was derived from the radial BP signal by the SphygmoCor software [13]. Hemodynamic data were recorded for 5 min in the supine position and 5 min during head-up tilt. Mean BP values were calculated for the last 3 min in the supine position, the last 3 min during head-up tilt, and for the average of these 3-minute periods in supine+head-up tilt positions. During the last 3 min in each position, the BP signal was most stable (Fig. 1).
 Fig. 1:
 Line graphs show radial and aortic tonometric SBP (a), and DBP (b) in the study population consisting of normotensive subjects (n = 69), unmedicated hypertensive patients (n = 151), and medicated hypertensive patients (n = 190) during 10-minute laboratory recordings; minutes 1–5 in supine position, minutes 6–10 during passive head-up tilt; mean and 95% confidence interval of the mean.
Laboratory analysesBlood samples were collected after ~12 h of fasting. Plasma electrolytes, creatinine, C-reactive protein, glucose, and lipid determinations were carried out using Cobas Integra 700/800 (F. Hoffmann-LaRoche Ltd., Basel, Switzerland) or Cobas 6000, module c501 (Roche Diagnostics, Basel, Switzerland). Standard 12-lead electrocardiograms were registered and the Cornell voltage-duration product was calculated [32].
Statistical analysesThe laboratory results and BP values were analyzed using analysis of variance and calculation of Pearson and Spearman correlations, as appropriate. In some subjects, SBP increased and in some decreased in response to the head-up tilt. Subsequently, the subjects were divided into tertiles according to the change in radial SBP in response to the head-up tilt, and results were analyzed using analysis of variance for repeated measurements. To test whether the laboratory measurements classified subjects similarly to ambulatory BP, the participants were divided into four subgroups: (1) normotensive in ambulatory and laboratory recordings, (2) hypertensive in ambulatory but normotensive in laboratory recordings, (3) normotensive in ambulatory but hypertensive in laboratory recordings, and (4) hypertensive in both recordings. The sensitivity and specificity of the laboratory recordings to define hypertension versus ambulatory and office BP measurements were examined using receiver operating characteristic (ROC) curves. The statistics were performed using SPSS version 26.0 (IBM SPSS, Armonk, New York, USA), and Bonferroni correction was applied in post-hoc analyses. The results in the tables were presented as means and standard deviations of the mean, in the figures as means and 95% confidence intervals of the mean. P < 0.05 was considered statistically significant.
Results Study populationIn total, 143 (35%) of the subjects were women, and participant ages ranged from 19 to 70 years (Table 1). The medicated hypertensive patients had the highest proportion of males, participant age, and Cornell voltage-duration product (Table 1). The mean BMI and triglyceride concentration were higher, and high-density lipoprotein cholesterol was lower, in unmedicated and medicated hypertensive patients than in normotensive participants. Fasting plasma glucose was highest in medicated hypertensive patients, whereas total and low-density lipoprotein cholesterol levels were highest in unmedicated hypertensive subjects. Plasma creatinine, sodium, and potassium were corresponding in all groups (Table 1). Ambulatory daytime SBP and DBP were highest in unmedicated hypertensive and lowest in normotensive subjects (Table 1). On average, radial and aortic SBP decreased, and DBP increased in response to head-up tilt (Fig. 1).
Use of mean(supine+upright) blood pressure values in comparisons with ambulatory blood pressureWhen divided into tertiles according to the change in SBP during head-up tilt, BP either increased or decreased when upright (Fig. 2). Upright SBP decreased in tertiles 1 and 2 and increased in tertile 3; DBP decreased in tertile 1 and increased in tertiles 2 and 3 (P < 0.05 for all changes) (Fig. 2). The mean(supine+upright) BP values were applied for the evaluation of the cutoff for hypertension in the laboratory.
 Fig. 2:
 Line graphs show radial tonometric SBP (a) and diastolic blood pressure (b) of study participants divided into tertiles according to the magnitude of the change in radial SBP during head-up tilt; minutes 1–5 in supine position, minutes 6–10 during passive head-up tilt; mean and 95% confidence interval of the mean.
Individuals with different BP levels present variations in the white-coat effect [33]. Therefore, we compared ambulatory and laboratory BPs in the normotensive and hypertensive groups. The mean(supine+upright) SBP did not differ from ambulatory daytime SBP in normotensive subjects or unmedicated and medicated hypertensive patients, whereas the mean(supine+upright) DBP was 3–5 mmHg lower than ambulatory DBP in all groups (Table 1).
In the participants, office SBP and DBP were higher, and office heart rate lower than corresponding values during ambulatory BP recordings (Table 2). In the laboratory, supine radial SBP was higher than ambulatory daytime SBP (P < 0.05), whereas upright and mean(supine+upright) SBP was corresponding to ambulatory SBP (Table 2). In all laboratory recordings, aortic SBP and radial DBP were lower than ambulatory brachial SBP and DBP values, respectively (P < 0.05). Supine and mean(supine+upright) aortic DBP were lower than ambulatory DBP, whereas upright aortic DBP did not differ from ambulatory DBP (Table 2). Heart rate in the office, and in supine and mean(supine+upright) analyses were lower, while during the head-up tilt, heart rate was higher than in ambulatory recordings (P < 0.05) (Table 2).
Table 2 - Mean values of ambulatory daytime blood pressure, office blood pressure, radial and aortic blood pressure, and heart rate Ambulatory Office Laboratory measurement Supine Head-up tilt Mean(supine+upright) SBP (mmHg) 139 (14) 145 (18)a Radial 142 (18)a 138 (18) 140 (17) Aortic 129 (18)a 123 (17)a 126 (16)a DBP mmHg) 87 (9) 91 (12)a Radial 81 (11)a 85 (12)a 83 (11)a Aortic 82 (11)a 86 (17) 84 (11)a Heart rate (1/min) 71 (10) 67 (10)a 63 (9)a 75 (11)a 69 (10)aLaboratory values are calculated from the means of the last 3 min during the 5-min supine and the last 3 min during the 5-min head-up tilt recordings; mean (SD).
BP, blood pressure.
aP < 0.05 versus respective ambulatory BP.
Scatter plots of ambulatory daytime BP versus mean (supine+upright) radial tonometric BP are shown in Fig. 3. The line graphs in the scatter plots suggested that i) systolic laboratory BP 136 mmHg corresponded to ambulatory 135 mmHg, and ii) diastolic laboratory BP 82 mmHg corresponded to ambulatory 85 mmHg (Fig. 3). Respectively, the corresponding cutoff to define hypertension in the aortic recordings was 123/83 mmHg.
 Fig. 3:
 Correlograms of mean ambulatory daytime blood pressure (BP) versus mean(supine+upright) radial tonometric BP; SBP (a), DBP (b), dotted black lines represent cutoff points for hypertension, green numbers denote the proportion of subjects classified similarly, and red numbers denote the proportion of subjects classified dissimilarly to hypertensive and normotensive subjects.
With the above cutoffs, 311 (76%) of the participants were classified similarly in ambulatory and laboratory recordings: 76 (19%) subjects were normotensive and 235 (57%) were hypertensive (Table 3). Sixty-eight (17%) patients were hypertensive only during ambulatory monitoring but had normal laboratory BP. Altogether 24 of these 68 subjects had normal BP in the office indicating masked hypertension. Moreover, 31 (8%) subjects were hypertensive only during tonometric radial artery recordings, but their ambulatory values were normal (Table 3). Altogether 19 of these 31 subjects were hypertensive also in the office indicating white-coat hypertension.
Table 3 - Classification of subjects to hypertensive and normotensive groups when applying the radial cut-point 136/82 mmHg in laboratory measurements: 311 (75.8%) of the subjects were classified similarly in ambulatory and laboratory recordings Normotensive (n = 76) Hypertensive in ABP daytime only (n = 68) Hypertensive in laboratory only (n = 31) Hypertensive in both ABP daytime and laboratory (n = 235) Mean systolic ABP daytime (mmHg) 122 (7) 138 (9)a 127 (6)a,b 147 (11)a,b,c Mean diastolic ABP daytime (mmHg) 77 (5) 88 (6)a 80 (3)a,b 91 (8)a,b,c Laboratory radial SBP mean(supine+upright) (mmHg) 120 (10) 127 (7)a 139 (9)a,b 150 (13)a,b,c Laboratory radial DBP mean(supine+upright) (mmHg) 71 (7) 76 (4)a 83 (5)a,b 89 (9)a,b,c Laboratory aortic SBP mean(supine+upright) (mmHg) 107 (9) 115 (7) 125 (10)a,b 136 (13)a,b,c Laboratory aortic DBP mean(supine+upright) (mmHg) 72 (7) 77 (4) 84 (5)a 90 (9)a,bLaboratory values are calculated from the means of the last 3 min during the 5-min supine and the last 3 min during the 5-min head-up tilt recordings; mean (SD).
ABP, ambulatory blood pressure.
aP < 0.05 versus normotensive.
bP < 0.05 versus hypertensive in ABP.
cP < 0.05 versus hypertensive in laboratory. When applying the aortic BP cutoff point 123/83 mmHg, 313 (76.3%) of the subjects were classified similarly in ambulatory and laboratory recordings.
ROC curve analyses of the radial cutoff 136/82 mmHg and the aortic cutoff 123/83 mmHg versus the ambulatory cutoff 135/85 mmHg are presented in Fig. 4. The laboratory radial systolic cutoff 136 mmHg had a sensitivity of 71.5% and specificity of 77.3%, and the laboratory radial diastolic cutoff 82 mmHg had a sensitivity of 71.7% and specificity of 72.8% to define hypertension (Fig. 4a). The laboratory aortic systolic cutoff 123 mmHg had a sensitivity of 70.0% and specificity of 76.8%, and the laboratory aortic diastolic cutoff 83 mmHg had a sensitivity of 71.4% and specificity of 73.0% to define hypertension (Fig. 4b). Additionally, when compared with the office cutoff 140/90 mmHg, the laboratory radial SBP cutoff 136 mmHg had a sensitivity of 71.4% and specificity of 75.8%, and the laboratory radial DBP cutoff 82 mmHg had a sensitivity of 71.4% and specificity of 68.4% to define hypertension.
 Fig. 4:
 Receiver operating characteristic curves depicting the prediction of brachial ambulatory blood pressure (BP) ≥135/85 mmHg by the mean(supine+upright) radial tonometric SBP (red line) and DBP (red line) (a), and by the mean(supine+upright) aortic SBP (red line) and DBP (red line) (b).
The correlations between laboratory and ambulatory BPs were also analyzed separately in subjects who had never received BP-lowering medications and in patients treated with antihypertensive agents. The correlations of these approaches for SBP were 0.68 in the unmedicated group and 0.69 in medicated group, and for DBP 0.70 in the unmedicated group and 0.61 in the medicated group. These results indicate that antihypertensive medications were not a source of confounding in the present study.
DiscussionA high proportion of the active human life is spent in the upright position, while the hemodynamic responses to upright posture are influenced e.g. by antihypertensive medication [34], liquorice intake [9], cardiovascular disease [24], age [25], and sex [18]. Here we compared radial tonometric BP status during head-up tilt versus ambulatory daytime BP, and evaluated the effect of body posture on BP. As a significant proportion of research regarding the hemodynamics of hypertension has been performed under laboratory conditions [10,11,35,36], we evaluated a potential cutoff point for hypertension during tonometric laboratory recordings. We stress that the present results should not be considered as an attempt to find a novel approach for the diagnosis of hypertension but as an effort to compare the tonometric method with ambulatory daytime brachial BP for research purposes. The study population was representative, as it consisted of men and women, normotensive subjects, and unmedicated and medicated hypertensive patients. The hypertensive groups had higher BMI and worse lipids than the normotensive subjects [1], while the medicated hypertensive patients were the oldest, had the highest plasma glucose, and the highest proportion of males.
According to the correlograms of ambulatory daytime BP versus mean(supine+upright) radial tonometric BP, the laboratory BP 136/82 mmHg corresponded to ambulatory daytime BP 135/85 mmHg. Previously, no reference values for hypertension have been defined for noninvasive laboratory recordings [12,18,35]. BP is characterized by high variability depending on measuring conditions, age, stressor factors, and body position [1,3,5,11,12]. As the mean resting ambulatory heart rate in >92 000 individuals was 65/min [2], there are ~100 000 SBP and DBP values within 24 h, and the definition of the cutoff for hypertension is not straightforward.
Radial SBP and pulse pressure are higher than the aortic values due to pulse pressure amplification [37]. Recently, four different BP phenotypes of SBP amplification were discovered: amplification of both aortic to brachial and brachial to radial SBP, only aortic to brachial amplification, only brachial to radial amplification, and neither aortic to brachial nor brachial to radial amplification [37]. The latter two phenotypes had higher aortic BP, which could not be differentiated using standard cuff measurements [37]. The central hemodynamic variables, including aortic pulse pressure and pulse wave velocity, predict cardiovascular risk better than brachial measurements [15,16]. Several variables reflecting central circulation can be derived from the peripheral tonometric signal [9–12,18], but the tonometric BP recording is sensitive to measurement errors, for example, due to upper arm movements during the recordings [38].
Weiss et al. considered the accuracy of tonometric BP values to be moderate in 22 surgical patients [38], while Steiner et al. found that mean BP values differed in ~34% of the readings by >10 mmHg from intra-arterial readings among 15 neuro-intensive care patients [39]. However, Kemmotsu et al. reported that tonometry provided accurate and reliable monitoring of BP in 28 patients undergoing orthopedic surgery [40], while Nelesen and Dimsdale found that radial tonometric BP monitoring had low artifact rating and high accuracy during stressor tests among 20 subjects when compared with noninvasive recordings using Dinamap and Finapres [41]. In the present study, we calculated average BPs during 1-minute-long and 3-minute-long recording periods from a much larger group of 410 participants to increase the reliability of the measurements. Of note, the pulse waveforms were captured from the radial artery, but the signal was calibrated by oscillometric cuff-based measurements from the contralateral brachial artery. Therefore, the actual comparison of BP levels was between radial tonometric signal calibrated from brachial BP versus ambulatory daytime brachial BP.
In the present study, office BP was higher than ambulatory BP in each study group. Higher ambulatory daytime than office heart rate can be explained by out-of-office physical activity. Our laboratory recordings confirmed that body position has a significant effect on the level of BP [10,12,18,42]. On average, SBP decreased and diastolic increased during head-up tilt [
留言 (0)