
記住我


The current study included 63 pediatric patients with de novo T-ALL with a median age of 7 (range of 1 to 18) years old. Males represented 69.8% (44/63), and females were 30.2% (19/63). Seventeen patients (26.9%) had intermediate T-phenotype, while 26 (41.3%) had late T-phenotype. The median of modal chromosome number (MCN) was 46 (range: 41–91); 11/63 patients (17.5%) had hyperdiploidy, while 6/63 (9.5%) had hypodipiody.
Abnormal cytogenetics were detected in 68.3% (43/63) T-ALL patients. Structural changes were more common than numerical ones with 62.8% (27/43) and 20.9% (9/43) of abnormal cases, respectively, while 16.3% (7/43) of abnormal cases displayed both structural and numerical anomalies. Baseline demographic, clinical, and laboratory characteristics are shown in Table 1.
Table 1 Clinical and laboratory characteristics of the study cohortFrequency of ETP and TCR aberrations in pediatric T-ALLThe ETP was observed in 7/63 (11.1%) of the patients. Upon screening by FISH, 4 types of TCRA/D aberrations were found among the 63 pediatric patients: (I) TCRA/D translocations in 20/63 (31.7%) patients, (II) TCRA/D amplifications in 11/63 (17.5%) patients, (III) TCRA/D deletions in 3/63 (4.8%) patients, and (IV) collective TCRA/D abnormalities, including the previously mentioned 3 aberrations, in 30/63 (47.6%) patients (Fig. 1).
Fig. 1
Frequency of TCR/D, TCR-β, and ETP alterations in pediatric T-ALL cases
TCRA/D translocation was the sole structural abnormality in 15/20 (71%) patients, while 5/20 (29%) harbored additional structural and/or numerical aberrations. The identified partners were chromosome 8 (n = 2.10%), chromosome 11 (n = 2.10%), and chromosome 6 and chromosome 12 (one case each), while 14 cases were of unidentified partner chromosome. Of note, 3/20 (15%) patients had concurrent TCRA/D amplification, while 1 patient had TCRA/D deletion.
Out of 11 cases with TCRA/D amplification, 7 cases (63.6%) gained one or more copy of chromosome 14 in hyperdiploid karyotypes, while 4 cases (36.3%) showed TCRA/D duplications. Notably, all cases with TCRA/D deletions had monosomy 14 in hypodiploidy karyotypes. Aberrations involving TCR-β were found in 13/63 patients (20.6%); 9/13 (69.2%) showed TCR-β structural abnormalities of which 3 (23%) cases with t(1;7)(p32;q34), while 4/13 (30.8%) gained extra-copy of TCR-β in hyperdiploid karyotypes.
Association of ETP with ALL patients’ characteristicsBased on the immunophenotype, 7/63 (11.1%) patients were classified as ETP and 56/63 (88.9%) as non-ETP. Patients with ETP were significantly older than the other T-ALL patients (P = 0.013). Initial WBC count less than 50,000/µl was seen significantly in 71.4% of ETP compared to 20.3% of non-ETP (P = 0.001). The ETP patients showed significantly lower percentage of PB blast cells compared to non-ETP patients [50% (0–85%) vs 85% (0–99%); respectively, P = 0.037]. Of note, all patients (100%) with ETP-ALL had lymph node enlargement at presentation, but the relation was not statistically significant.
Regarding cytogenetics, patients with ETP-ALL were more likely to have hyperdiploid karyotype compared to non-ETP patients (57.1% vs 12.5%, respectively, P = 0.009) with a nonsignificant trend to have complex karyotypes (42.9% vs 12.5%, respectively, P = 0.073, Table 2).
Table 2 Clinical features, laboratory characteristics, and outcome of ALL in relation to ETP subtypeInterestingly, there was 85.7% (6/7) of the ETP-ALL patients showed increased incidence of total TCRA/D abnormalities compared to 42.9% (24/56) in non-ETP patients, P = 0.047. Similarly, there was a significant association between ETP-ALL and TCRA/D amplifications (P = 0.014), as TCRA/D amplifications were present in 57.1% (4/7) of ETP patients compared to 12.5% (7/56) in non-ETP patients (Fig. 2).
Fig. 2
Frequency of TCR aberrations at the initial diagnosis according to the immunophenotype subgroups of T-ALL patients. Early-T phenotypes are double negative for CD4 and CD8; intermediate-T phenotypes were double positive for CD4 and CD8. Late T-phenotype: single positive for either CD4 or CD8
Association between TCR aberrations and ALL patients’ characteristicsAmong patients presenting with bleeding, 71.4% were positive to TCRA/D translocations (P = 0.028). Patients with TCRA/D amplification had lower WBC count (median-range): 52 (3–546) vs 240 (2–967), P = 0.02), lower percentage of BM blast cells (median-range): 80 (38–92) vs 90 (0–99), P = 0.05), compared to TCRA/D amplification-negative cases. Additionally, patients with TCRA/D translocations were positively associated with aberrant myeloid markers (P = 0.06); had additional chromosomal abnormalities (54.5% vs 23.1%, P = 0.036); and, subsequently, presented in complex karyotypes (45.5% vs 9.6%, P = 0.003) compared to those who did not show TCRA/D amplification (Table 3).
Table 3 Clinical features, laboratory characteristics, and outcome in relation to TCRA/D translocation and TCRA/D amplificationNotably, there was a highly statistically significant relation between TCR-copy number variation groups (CNV) and MCN, where positive cases to TCRA/D amplification had higher MCN with a median of 50 (range: 46–91) chromosomes (P < 0.01). While all cases with TCRA/D deletion cases had MCN lower than 46 with a median of 45 (range: 41–45) chromosomes (P < 0.001, supp. 2). There was a significant association between TCRA/D-abnormalities and hyperdiploidy, as 10/11 (90.9%) of the patients with hyperdiploidy showed TCRA/D abnormalities (P = 0.006).
On the other hand, patients with TCR-β aberrations had lower WBC count (median-range):75 (2–883) vs 269 (2–967), P = 0.002), lower risk of CNS involvement at presentation (53.8% vs 94%, P = 0.003), positive association with CD7 expression (84.6% vs 51%, P = 0.05) compared to the ALL patients without TCR-β aberrations (Table 3).
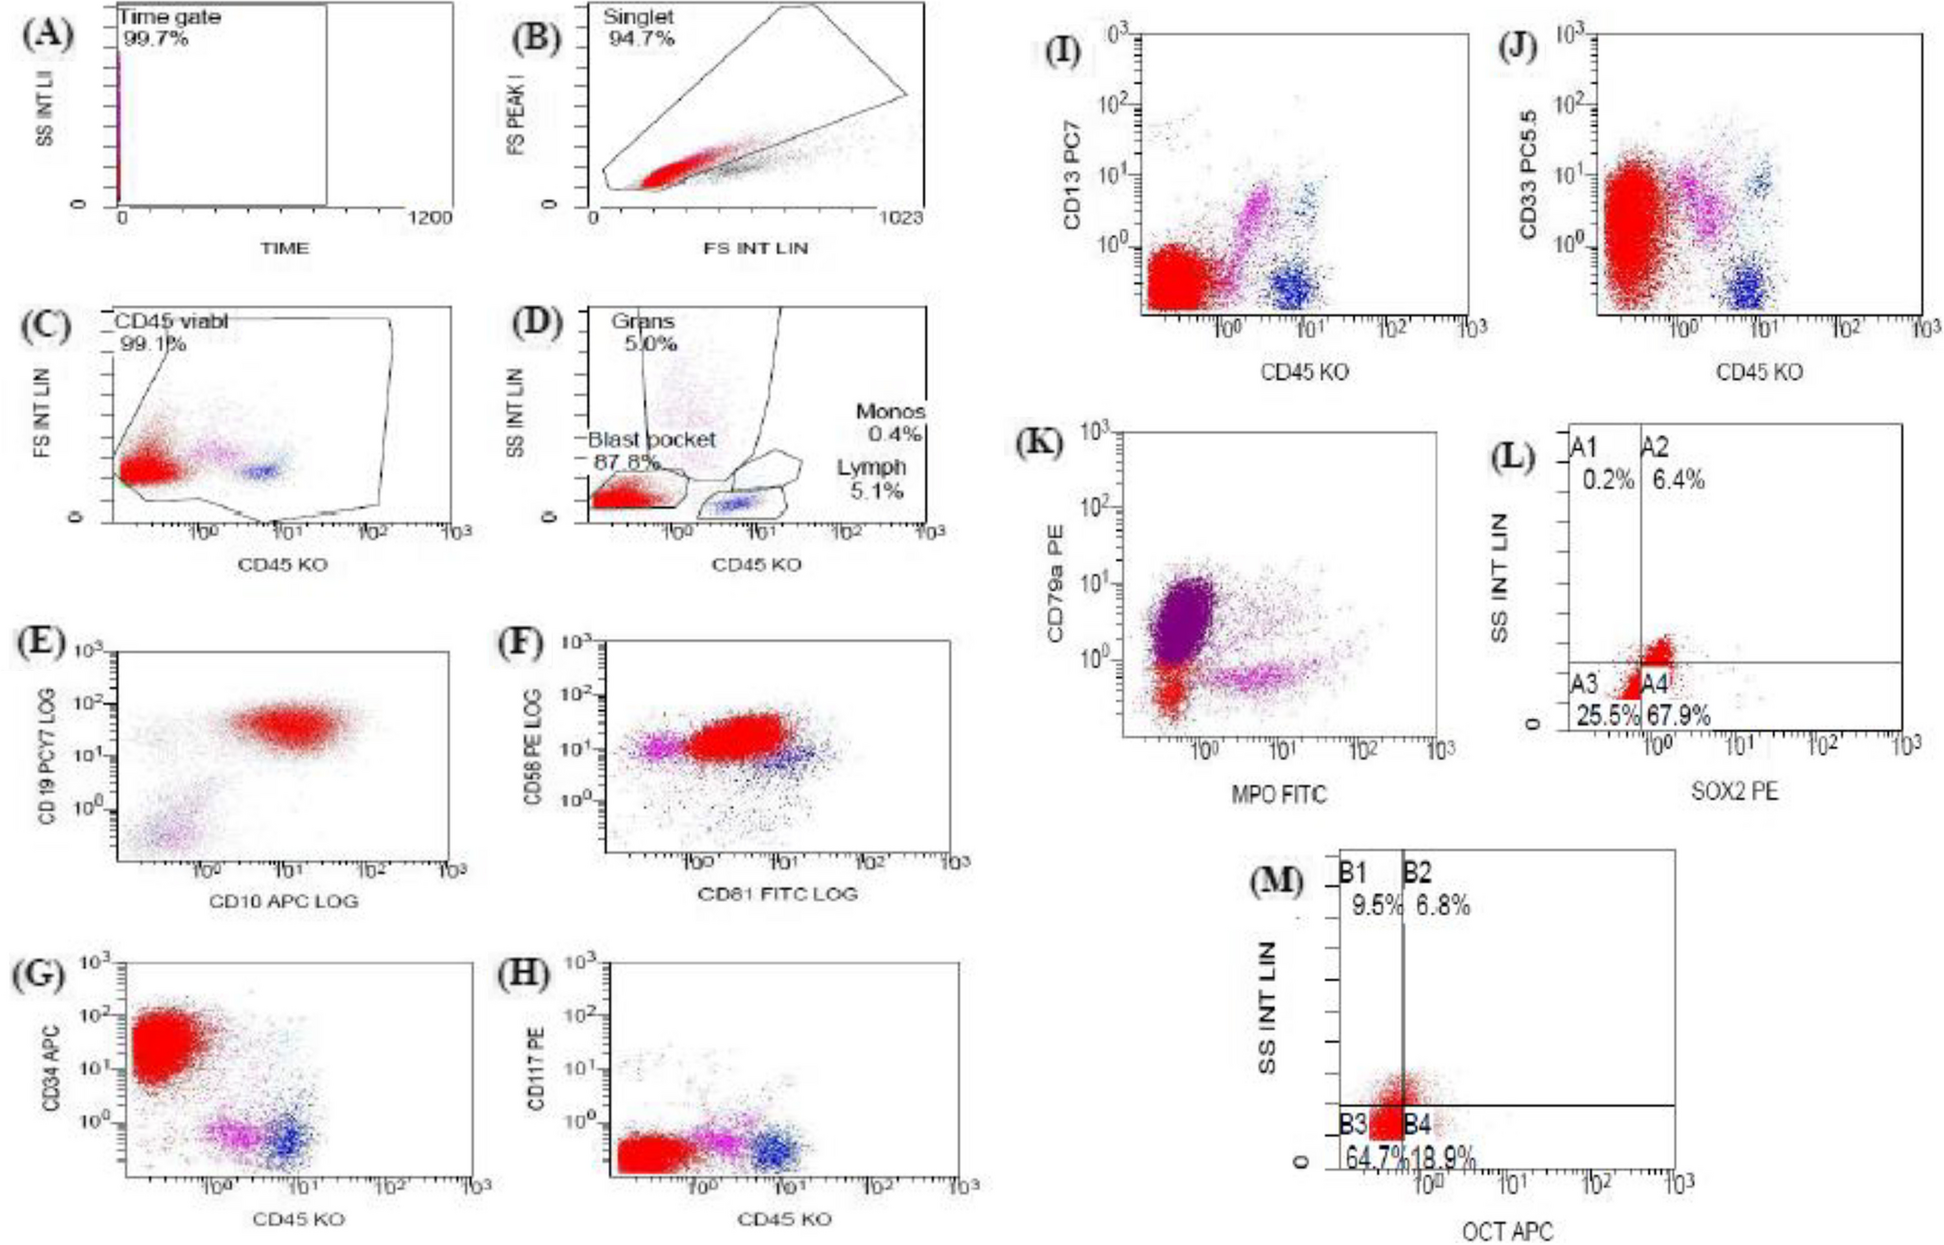
Impact of ETP and TCR aberrations on the T-ALL patients’ response to treatmentMinimal residual disease (MRD) was performed by flow cytometry for 46 patients on day 15, and for 42 patients on day 42 according to the adequacy of the samples and the presence of leukemia-associated immunophenotypes (Table 1).
Patients with ETP-ALL showed a nonsignificant inferior clearance rate of leukemic cells compared to the other T-ALL patients, as all patients had detectable MRD (≥ 0.01%) after 15 days of treatment (Table 2). Only two patients had MRD ≥ 1% at the end of induction of whom one patient had ETP-ALL. However, due to the low number of patients, no statistical analysis could be done.
Eleven patients died during induction, 7 were from treatment-related causes (TRM), while 4 were from disease-related causes. Two of the seven patients with ETP (28.6%) died in induction from disease-related cause, while 9/56 patients with non-ETP (16%) died mainly due to TRM.
The morphological CR of the assessed ALL patients was significantly associated with the presence of TCR-β aberrations (P = 0.028), while a nonsignificant association between TCRA/D amplification and the achievement of the morphological CR was noted (P = 0.095, Fig. 3). In addition, patients with TCR-β abnormalities were more likely to have negative MRD on day 42 compared to TCR-β-negative patients (80% vs 29.7%, P = 0.047, Tables 3 and 4).
Fig. 3
A–F showing the association of ETP and TCR abnormalities with the patients’ complete remission, while G–L showing the association of ETP and TCR abnormalities with the patients’ morphological complete remission. The colored parts represent the percent of patients who were positive for the ETP or TCR abnormalities
Table 4 Clinical features, laboratory characteristics, and outcome in relation to total TCR-B aberrations and TCRA/D abnormalityImpact of ETP and TCR aberrations on the clinical outcome of the assessed ALL patientsWith a median follow-up of 22 (range: 1–86) months, eleven patients (17.5%) died during the induction, 8 cases (12.7%) relapsed after achieving CR of which 1 (14.3%), and 2 (64.2%) patients were positive to ETP and TCR abnormalities, respectively. The total number of deaths at the end of the study was 27 cases (42.9%). Characteristics of the relapsed pediatric T-ALL patients are illustrated in supp. 3.
Notably, 5/13 (38.5%) of patients with TCR-β aberrations died before the end of the induction compared to 6/50 (12%) of the negative cases (P = 0.04). The present study showed that there was no significant impact of TCR aberrations or ETP on the DFS or the OS of the assessed T-ALL patients (P > 0.05, Fig. 4).
Fig. 4
Survival of pediatric T-ALL according to TCR aberrations status and ETP. A, B, C, D, I, and K Disease-free survival (DFS) and E, F, G, H, J, and L overall survival (OS) of different TCR aberrations
留言 (0)