
記住我

In children who are in the critical period of visual development, amblyopia can result from disturbances in the normal development of visual pathways.1 Approximately 19 million children worldwide have visual impairment caused by retinal disease, glaucoma, cataracts, or uncorrected refractive errors.2 These diseases require early screening and diagnosis3; otherwise, they could lead to a decreased quality of life and increased socioeconomic burden.4 Currently, visual acuity testing is the most commonly used method for visual health screening in children. It assesses the ability to distinguish fine details at maximum contrast using the Snellen or Early Treatment of Diabetic Retinopathy Study (ETDRS) charts, 5 instead of those with different sizes at different contrasts. The contrast sensitivity test measures the contrast threshold at different spatial frequencies, describes the differences in patients with the same visual acuity, 6 and is considered a more comprehensive method for assessing visual function.7 A decrease in contrast sensitivity function (CSF) readings can be observed in some pathologic conditions, such as preterm labor, 8 amblyopia, 9 early glaucoma,6 and multiple sclerosis.10
The contrast sensitivity tests commonly used in clinical practice include alphabetic charts, Pelli–Pobson charts, and raster chart CSV-1000 tests, but these can only test at limited spatial frequencies.11,12 In addition, the clinical use of laboratory CSF tests is limited by their duration of 30 to 60 min per test.13 The quick CSF (qCSF) test program has recently been demonstrated to be accurate and reliable.14–16 Based on the Bayesian adaptive algorithm,17 qCSF tests acquire the CSF curve and the corresponding parameters using 10 digits within 25 stimuli,12 which further improved the feasibility for clinical application. The qCSF test has broadly been used for assessment in amblyopia treatment,18 visual quality,19,20 binocular visual function,21 peripheral vision,22 and retinal function disorder.23,24
Previous studies have shown that age is the primary factor affecting CSF in adults with optimal refraction correction,25,26 whereas there is a weak correlation between CSF and age in children with refractive correction.27 However, the characteristics and correlated parameters of qCSF are still unclear in children with unaided acuity. Previous findings suggested that even a 0.25D undercorrection significantly affected the qCSF result.19 Therefore, assessment of the characteristics and correlated parameters of qCSF in ametropia children without refraction correction will help provide a reference for the promotion of qCSF testing. Thus, this study aimed to explore the distribution and related factors of qCSF in Chinese children to further assist optometrists in evaluating pediatric visual health. Toward this goal, qCSF readings in children under unaided acuity were evaluated according to age, sex, and refraction.
PATIENTS AND METHODSThis case series study was approved by the Ethics Committee of the Eye and ENT Hospital of Fudan University (2,020,107, date: July 1, 2021) and was conducted according to the tenets of the Declaration of Helsinki. Informed consent was obtained from all the participants and their legal guardians.
This study enrolled children aged 6 to 14 years old who visited the Eye and ENT Hospital of Fudan University between November 2021 and January 2022. The exclusion criteria were (1) history of orthokeratology lenses or low-concentration atropine and other drug use and (2) history of ophthalmic disease, surgery or trauma; history of systemic diseases; and severe psychological or psychiatric diseases.
ExaminationsFor axial length and corneal curvature measurements, a Humphrey IOL Master700 (Carl Zeiss Meditec, Germany) was used. For cycloplegia, the tropicamide phenylephrine eye drops (Mydrin-P ophthalmic solution; Santen, Osaka, Japan) were applied five times at 5-min intervals. The RT-5100 phoropter (Nidek Technologies, Japan) was used to assess manifest refraction and corrected distance visual acuity evaluation under full cycloplegia (absence of light reflex), 30 min after the last application of the eye drops.
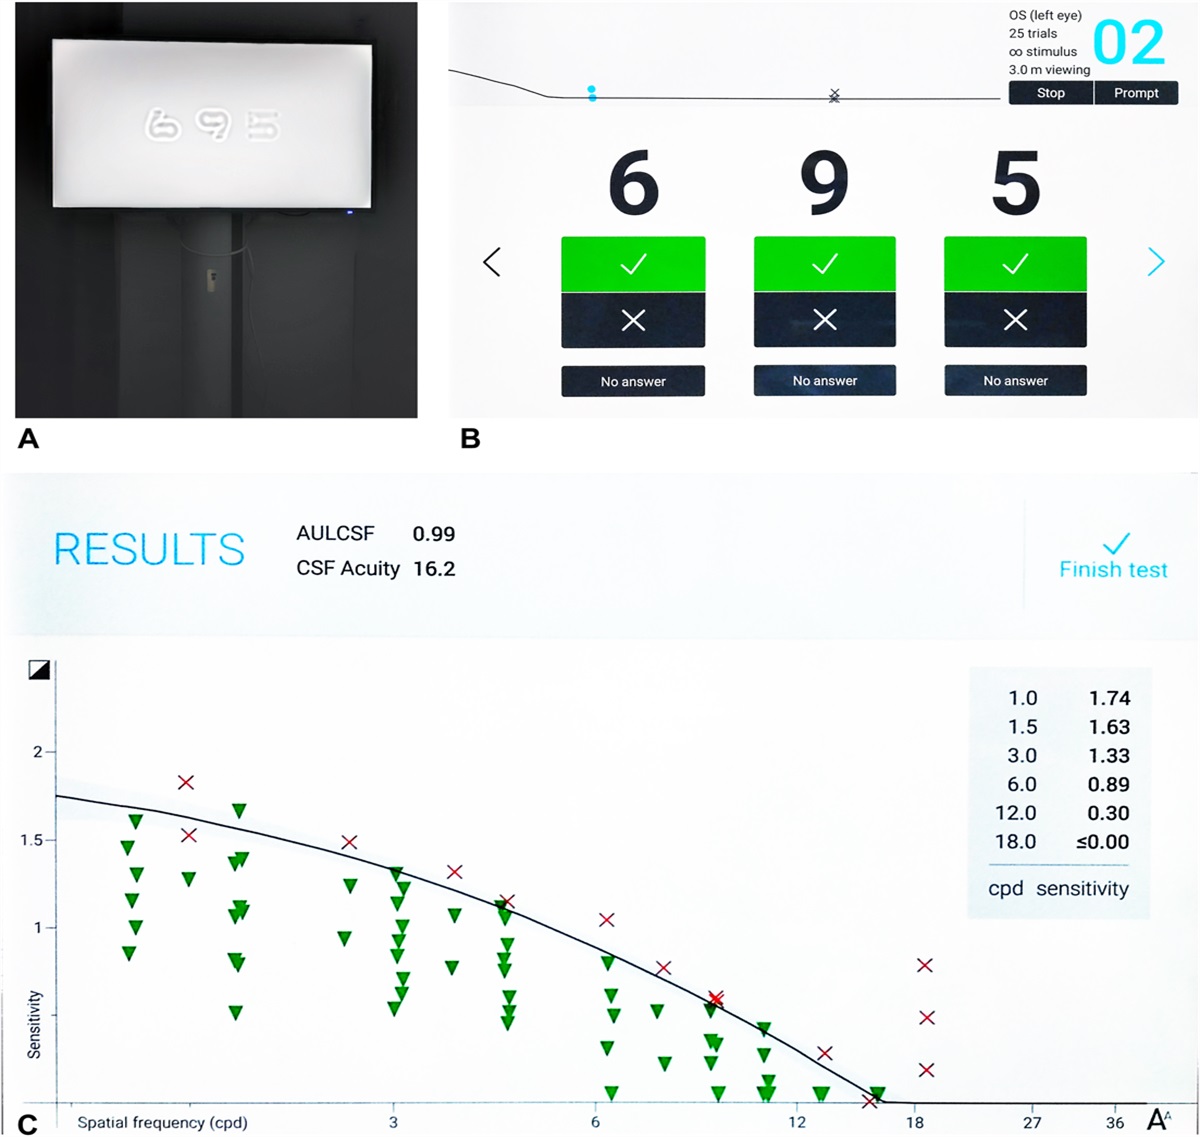
Quick Contrast Sensitivity Function TestAn NEC P403 monitor (Gension & Waltai Digital Video System Co, Ltd., China) was used to display numbers (from 0 to nine in sloan fonts) as visual stimulus,28 with a resolution of 1920×1,080 pixels, a display area of 116.84×77.89 cm, a maximum and standard brightness of 700 and 550 cd/m2, respectively, and a contrast ratio of 4,000:1 (Fig. 1). Using a Bayesian adaptive procedure, the qCSF test displayed 25 stimuli at different spatial frequencies on the screen, each with three numbers at a different contrast ratio. The test was conducted under full cycloplegia without refractive correction. Patients view the visual stimuli horizontally at 3 m in a mesopic environment and two eyes were examined separately with the contralateral one covered. They were taught to report any numbers they saw on the screen, and the tester input their responses in a pad immediately: correct answers, incorrect answers, or no numbers observed (Fig. 1B). The CSF curve was depicted directly by the computer, and the results include area under log CSF (AULCSF), CSF acuity, and contrast sensitivity (log units) at six different spatial frequencies (1.0, 1.5, 3.0, 6.0, 12.0, 18.0 cycle per degree [cpd]) (Fig. 1C). The general spatial visual representation is described by the AULCSF, whereas CSF acuity reflects the cut-off spatial frequencies of CSF curves.29,30
 FIG. 1.:
 Testing interface of qCSF, (A) Three filtered digits are displayed on the screen as visual stimuli. (B) The technician's terminal is displayed on a tablet. (C) The qCSF results.
Statistical AnalysisContinuous variables were presented as the mean±SD and range, whereas categorical variables were presented as frequency. The Kolmogorov–Smirnov test was used for normality analysis. Levene test was used for the homogeneity of the variance test. The Student t test was used to evaluate the differences in normally distributed continuous variables between two groups. One-way analysis of variance was used to evaluate differences in normally distributed continuous variables between three or more groups, and the corrected Bonferroni method was used for multiple post-hoc comparisons. The Wilcoxon signed-rank test was used to verify differences in non-normally distributed data. Pearson correlation coefficient was used to evaluate the correlation between the continuous variables. A generalized linear model was used as a multifactor parameter test method, excluding the influence of various factors (age, sex, visual parameters, and ocular biology parameters) and binocular inclusion.
In the subgroup analysis, the subjects were stratified according to age (6–8 years and 9–14 years), refraction sphere (RS) (high RS [−4.0 to −1.25 D], low RS [−1.0 to 0 D], and hyperopia [0.125–2.0 D]), refraction cylinder (RC) (high RC [<−1.0 D], low RC [−0.75 to −0.25 D], and no astigmatism [0 D]), and spherical equivalent (high SE [−5.0D to −1.125 D], low SE [−1.0 to 0 D], and hyperopia [0.125–1.75 D]). The −1.00 D was selected to distinguish between groups, because it was one of the indications for spectacle prescription. A better eye or a lower RS/RC/SE eye was defined as an eye with a refraction error closer to hyperopia or 0 than that of the other eye. All statistical analyses were performed using the Statistical Package for the Social Sciences (version 25.0; SPSS, Inc., Chicago, IL). Statistical significance was set at P<0.05.
RESULT Patient CharacteristicsA total of 106 eyes of 53 subjects were included in the study. The patient characteristics are shown in Table 1. Age and spherical equivalent (SE) distributions are shown in Figure 2A. All examinations were completed successfully, with a data loss of less than 5%. The mean values of qCSF parameters under unaided refraction are shown in Figure 2B.
TABLE 1. - Patient Demographics Characteristic Mean±SD Range Age (years) 9.04±2.06 6, 14 Gender (male/female) 29/24 Axial length (mm) 23.98±0.83 20.25, 25.82 Refraction sphere (D) −0.65±1.47 −4.00, 2.00 Refraction cylinder (D) −0.59±0.68 −3.50, 0 Spherical equivalent (D) −0.94±1.53 −5.00, 1.75 K-flat (D) 42.67±1.52 38.50, 49.00 K-steep (D) 43.97±1.53 39.00, 50.50 Km (D) 43.32±1.49 38.88, 49.75 CDVA (LogMAR) 0.01±0.02 0, 0.15CDVA, corrected distance visual acuity; D, diopter; K-flat, flat keratometry; Km, mean keratometry; K-steep, steep keratometry.
 FIG. 2.:
 Subject characteristics of age, refraction, and qCSF. (A) Distribution of age and spherical equivalents. (B) Mean contrast sensitivity (log units) at different spatial frequencies (left panel). Mean area under the line of the contrast sensitivity function (AULCSF) and contrast sensitivity function (CSF) acuity (right panel).
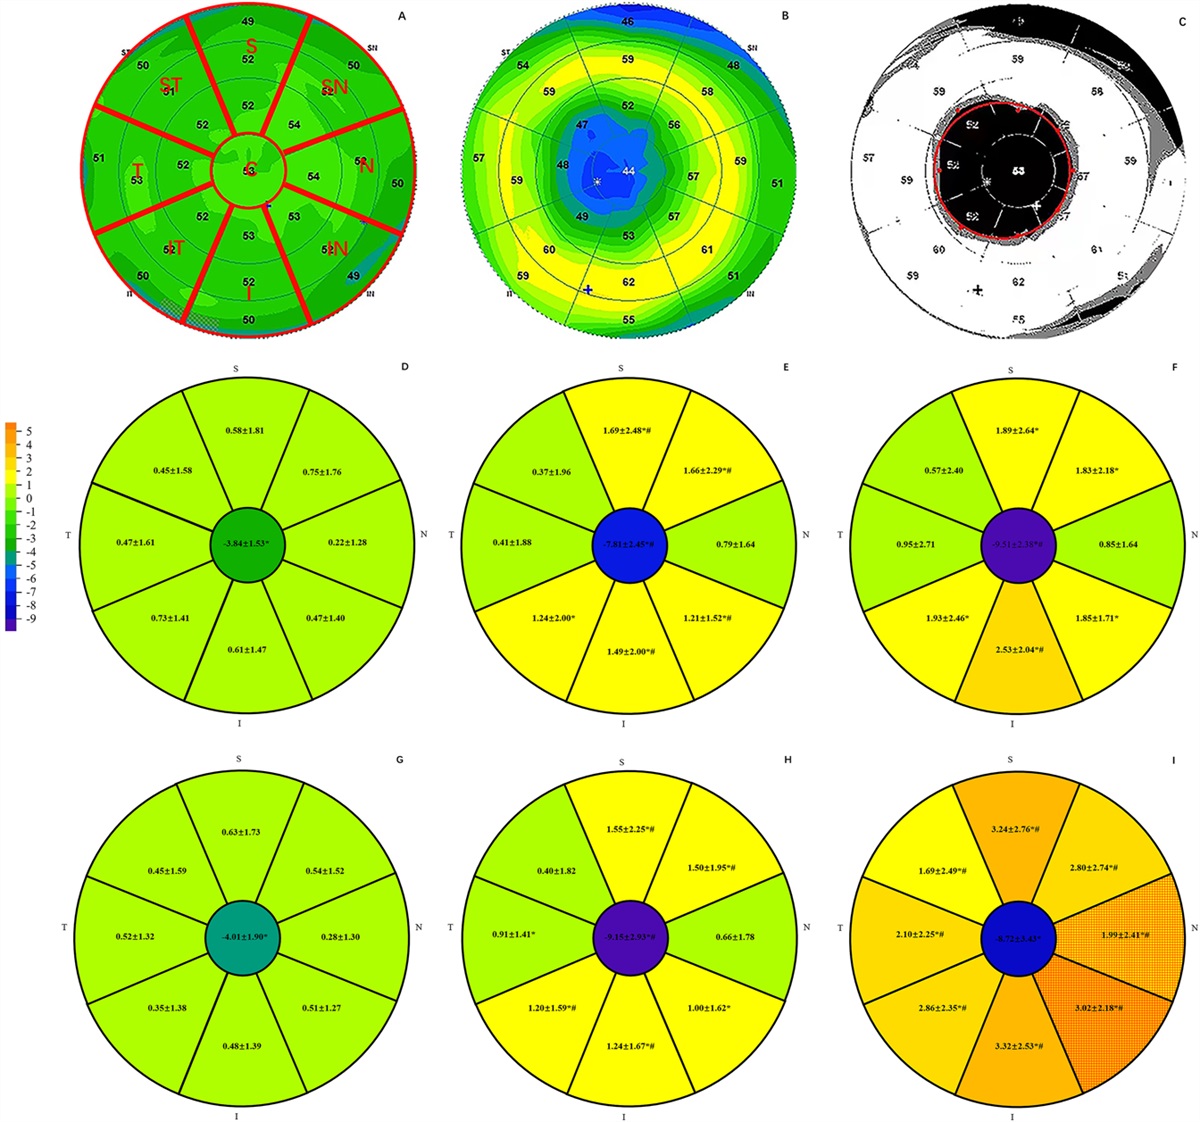
Correlation AnalysisTable 2 presents the Pearson correlations between qCSF parameters and other factors, including age and refraction. Age was negatively correlated with AULCSF and CS at 6.0 cpd (r=−0.202, −0.251; P<0.05). GLM analyses demonstrated that RS was the major factor affecting the change in qCSF parameters. Positive correlations were observed between the RS and AULCSF (r2=0.679; P<0.01) and between the RS and CSF acuity (r2=0.543; P<0.05) (Fig. 3).
TABLE 2. - Association Between qCSF (Quick Contrast Sensitivity Function) Parameters With Other Factors in Pearson Correlation Analysis qCSF AULCSF CSF Acuity CS (1.0 cpd) CS (1.5 cpd) CS (3.0 cpd) CS (6.0 cpd) CS (12.0 cpd) CS (18.0 cpd) Age r −0.202 −0.130 −0.021 −0.085 −0.182 −0.251 −0.169 −0.170 P 0.038 0.184 0.832 0.386 0.062 0.009 0.084 0.081 RS r 0.824 0.737 0.707 0.807 0.850 0.749 0.427 0.241 P 0.000 0.000 0.000 0.000 0.000 0.000 0.000 0.013 RC r 0.143 0.158 0.083 0.075 0.108 0.162 0.225 0.174 P 0.145 0.107 0.397 0.445 0.270 0.097 0.020 0.075 SE r 0.821 0.741 0.696 0.790 0.839 0.754 0.459 0.270 P 0.000 0.000 0.000 0.000 0.000 0.000 0.000 0.005 AL r −0.430 −0.362 −0.379 −0.439 −0.479 −0.385 −0.097 −0.085 P 0.000 0.000 0.000 0.000 0.000 0.000 0.341 0.406 Km R −0.331 −0.339 −0.204 −0.239 −0.301 −0.324 −0.354 −0.215 P 0.001 0.001 0.051 0.022 0.004 0.002 0.001 0.040Values with statistical significance are shown in bold.
AL, axial length; AULCSF, area under log CSF; cpd, cycle per degree; CS, contrast sensitivity; Km, mean keratometry; RC, refraction cylinder; RS, refraction sphere; SE, spherical equivalent.
 FIG. 3.:
 Correlations between RS and qCSF parameters. Simple linear regressions between RS and (A) AULCSF, (B) CSF acuity, and CS (log units) at (C) 1.0 c/d, (D) 1.5 c/d, (E) 3.0 c/d, (F) 6.0 c/d, (G) 12.0 c/d, and (H) 18.0 c/d. The solid lines illustrate the line of linear regressions, and the dotted line illustrates the confidential intervals. Top left: equation of linear regression, coefficient of determination (r2), and P values of generalized linear models. The significance of r2 is shown by asterisks (*** P<0.001; ** P<0.01; * P<0.05).
Group AnalysisAs shown in Table 3 and Figure 4, CS at medium spatial frequencies (3.0 and 6.0 c/d) were significantly higher in the 6 to 8-year-old group than in the 9 to 14-year-old group (0.71±0.48 vs. 0.57±0.42 at 3.0 cpd, 0.42±0.40 vs. 0.28±0.34 at 6.0 cpd, all P<0.05) (Fig. 4A). The differences in qCSF parameters among the three RS groups were similar to those among the three SE groups, in which CS at medium spatial frequencies (3.0 cpd and 6.0 cpd) changed in a gradient (Fig. 4B, D). In the low SE group (SE within −1 to 0 D), the CS at low spatial frequencies was not significantly different than that in the hyperopia group (1.09±0.16 vs. 1.13±0.16 at 1.0 cpd; 1.05±0.16 vs. 1.17±0.15 at 1.5 cpd; P>0.05), whereas the CS at high spatial frequencies were significantly lower than that in the hyperopia group (0.07±0.13 vs. 0.23±0.25, P<0.05).
TABLE 3. - Comparison of qCSF (Quick Contrast Sensitivity Function) Readings in Different Groups Groups n AULCSF CSF Acuity CS (1.0 cpd) CS (1.5 cpd) CS (3.0 cpd) CS (6.0 cpd) CS (12.0 cpd) CS (18.0 cpd) Ages (years) 6∼8 48 0.50±0.36 9.15±6.36 0.92±0.38 0.87±0.43 0.71±0.48 0.42±0.40 0.11±0.20 0.02±0.05 9∼14 58 0.39±0.30 7.96±5.62 0.90±0.35 0.82±0.38 0.57±0.42 0.28±0.34 0.06±0.13 0.01±0.03 RS (D) −4.0∼−1.25 38 0.11±0.14 3.20±2.75 0.57±0.37 a 0.43±0.34 a 0.16±0.23 0.02±0.10 0.00±0.03 0.00±0.00 −1.0∼0 37 0.49±0.23 9.39±4.89 1.08±0.18 1.01±0.20 0.75±0.31 0.34±0.30 0.06±0.13 0.01±0.03 0.125∼2.0 31 0.78±0.20 13.93±4.44 1.12±0.17 1.14±0.16 1.08±0.18 0.73±0.28 0.21±0.23 a 0.03±0.07 RC (D) −4.0∼−1 27 0.36±0.28 6.99±4.70 0.83±0.36 0.77±0.37 0.54±0.43 0.25±0.31 0.03±0.06 0.00±0.00 −0.75∼−0.25 40 0.45±0.33 8.58±5.61 0.98±0.30 0.88±0.39 0.64±0.46 0.35±0.37 0.07±0.16 0.01±0.04 0 39 0.49±0.36 9.45±6.96 0.88±0.41 0.85±0.44 0.69±0.46 0.40±0.41 0.13±0.21 0.02±0.06 SE (D) −5.0∼−1.125 43 0.12±0.13 3.30±2.63 0.61±0.38 a 0.46±0.35 a 0.17±0.23 0.02±0.09 0.00±0.03 0.00±0.00 −1∼0 37 0.55±0.20 10.36±4.57 1.09±0.16 1.05±0.16 0.84±0.24 0.41±0.29 0.07±0.13 0.01±0.03 0.125∼1.75 26 0.81±0.20 14.43±4.45 1.13±0.16 1.17±0.15 1.11±0.17 0.78±0.26 0.23±0.25 a 0.03±0.07Values with statistical significance between all (two/three) groups are shown in bold.
aThere is no statistical significance between two genders, vs other two groups, P<0.05.
RS: refraction sphere; RC: refraction cylinder; D: diopter; SE: spherical equivalent; AULCSF: Area Under Log CSF; cpd: cycle per degree.
 FIG. 4.:
 Analyses of qCSF parameters by groups of age and refraction. (A) Differences in qCSF parameters among age groups. (B) Differences in qCSF parameters in the groups of refraction spheres. (C) Differences in qCSF parameters in groups of refraction cylinders. (D) Differences in qCSF parameters in groups with spherical equivalents.
Binocular Quick Contrast Sensitivity Function ReadingsTable 4 displays the correlations between binocular qCSF parameters and other factors as analyzed using GLM. Figure 5 depicts the distribution of binocular qCSF parameters and associated factors. The RS of the better eye was positively correlated with binocular AULCSF, CSF acuity, and CS at medium spatial frequencies (3.0 and 6.0 c/d) (B=0.200, 4.015, 0.261, 0.262; P<0.05). Furthermore, the SE of the better eye showed similar correlations with the corresponding qCSF parameters (B=0.181, 3.826, 0.224, 0.241; P<0.05). At low spatial frequencies, age was positively correlated with CS at 1.0 cpd (B=0.046, P<0.05), whereas the RS of the better eye was positively correlated with CS at 1.5 cpd (B=0.133, P<0.05).
TABLE 4. - Correlation Between Binocular qCSF Readings With Other Factors Analyzed With Generalized Linear Model Parameters AULCSF CSF Acuity CS (1.0 cpd) CS (1.5 cpd) CS (3.0 cpd) CS (6.0 cpd) CS (12.0 cpd) CS (18.0 cpd) B P B P B P B P B P B P B P B P Ages (years) 0.005 0.759 0.363 0.293 0.046 0.010 0.033 0.053 0.006 0.737 −0.009 0.639 0.005 0.739 −0.001 0.840 RS Higher 0.028 0.567 −0.095 0.931 0.085 0.133 0.066 0.225 0.021 0.725 0.003 0.953 0.032 0.488 0.019 0.304 Lower 0.200 <0.001 4.015 0.001 0.062 0.314 0.133 0.025 0.261 <0.001 0.262 <0.001 0.073 0.150 0.004 0.832 RC Higher −0.264 0.233 −5.927 0.150 −0.295 0.121 −0.269 0.211 −0.232 0.402 −0.338 0.180 −0.146 0.315 −0.048 0.347 Lower 0.393 0.123 9.283 0.051 0.311
留言 (0)