
記住我

Diabetes mellitus – commonly known as diabetes – comprises a group of complex metabolic disorders mainly characterized by hyperglycemia. It is caused due to inadequate insulin secretion or impaired insulin action, or a combination of both [1–3]. There are four main types of diabetes: type 1 diabetes (T1DM), type 2 diabetes (T2DM), specific diabetes with known genetic and non-genetic etiologies, and gestational diabetes [1,4]. Of these, T1DM and T2DM account for the majority of total diabetes diagnoses [5]. T1DM is an autoimmune condition characterized by the progressive destruction of insulin-producing β-pancreatic cells [1,4]. Conversely, T2DM is mainly characterized by insulin resistance and hyperinsulinemia [3,4,6]. In chronic cases, diabetes is associated with long-term complications including but not limited to renal failure, blindness (retinopathy), diabetic foot disorders, and cardiovascular disease, which reduces life expectancy and causes death [2,7]. According to statistics provided by the 2017 International Diabetes Federation, diabetes is among the top 10 causes of death worldwide with a global prevalence of 8.8% among adults between 20 and 79 years of age [2,8–10]. These numbers are expected to increase to 10.9% in 2045 [10], posing a substantial socioeconomic burden [11].
Various metabolic, environmental, genetic, and behavioral risk factors individually and synergistically contribute to the progression from a prediabetic condition to an overt disease [9]. In the case of T2DM (the most common form of diabetes) [5], it includes age [12], gender [13], obesity [14,15], hypertension [16,17], smoking habits [18,19], sedentary lifestyle patterns [12], and polycystic ovary syndrome (PCOS) [20]. The multifactorial nature of this disease, its slow onset, and the presence of comorbidities necessitates careful and early diagnosis, personalized treatment regimens, and disciplined self-management programs to control disease progression and reduce the burden on the healthcare system [21–24]. However, these tailored solutions are not readily available to all due to limited healthcare resources and high associated costs.
Digital healthcare interventions can help individuals to overcome these myriad challenges by providing smart, scalable, and cost-effective technologies to prevent, manage and treat diabetes [25–27]. Waya is a simple and promising digital solution launched in May 2020 to prevent diabetes. It guides overweight, obese, or patients with prediabetes to monitor and manage their weight, diet, and lifestyle through simple exercises, valuable nutritional advice, useful challenges, and educational videos. The aim of this research was to characterize the demographic patterns of its user. Additionally, we study the prevalence of diabetes and its associated risk factors within the Waya cohort and compare its epidemiological pattern with that of the general German population in 2014–2015. This study potentially highlights variations in the prevalence pattern over time.
Methods Study designUsers of the digital prevention program Waya (Supplemental Figure 1, Supplemental Digital Content 1, https://links.lww.com/CAEN/A38) who registered between 1st May and 16th October 2020 and who provided their consent for the usage of their health data content were considered for this study. An app-based health survey was conducted using a multi-choice questionnaire. User response was collected and stored in a GDPR-compliant manner. Inclusion criteria were: age 18–80 years, height >150 cm, BMI ≤50 kg/m2, and responder of a specific parameter.
Parameters evaluatedSociodemographic parameters such as gender, age, height, and BMI of the Waya population were analyzed. BMI, a measure of the nutritional status of an individual was calculated using the standard formula (27340299):
BMI=Bodyweight(kg)Height2(m2)
On the basis of their BMI, the nutritional status of an individual was divided into categories as shown in Table 1. This information was used to evaluate the percentage of overweight and obese individuals in the study population. Additionally, the prevalence of other risk factors of diabetes such as smoking status, hypertension, PCOS, and diabetes itself was analyzed.
Table 1 - BMI classification according to WHO [28] Calculated BMI Nutritional Status <18.5 Underweight 18.5–24.9 Normal weight 25.0–29.9 Overweight >30 Obese (class I–III)Population data from the ‘German Health Update’ (GEDA) study was used to compare features of the cohort of Waya users to those of the general German adult population (aged 18–65 years and above). The GEDA study was a cross-sectional health survey conducted on behalf of the German Federal Ministry of Health by the Robert Koch Institute (RKI) between November 2014 and July 2015 [29]. Only studies related to obesity [30], hypertension [31], smoking status [32], and diabetes [33] were considered for analysis. Table 2 briefly outlines the population size and gender of respondents for each GEDA 2014/2015-European Health Interview Survey (EHIS) population-based study. In case of hypertension and diabetes, the adjusted weight for gender was used.
Table 2 - Population size and gender of responders for German Health Update 2014/2015-European Health Interview Survey cross-sectional studies Study parameter Total no of responders No. females No. males Obesity 23 791 13 006 10 785 Smoking status 23 960 13 108 10 852 Hypertension 23 967 12 247a 11 720a Diabetes 23 345 11 929a 11 416a aCalculated numbers based on the reported weighted gender percentages [29].Descriptive statistics were used to characterize the Waya population. The mean, SD, and proportions were calculated using Rstudio [R version 4.0.2 (2020-06-22)]. Test for equal proportions between the Waya population and the GEDA 2014/2015-EHIS population was evaluated using Pearson’s chi-square test [34–37]. A P value <0.05 indicated significant differences between the two populations.
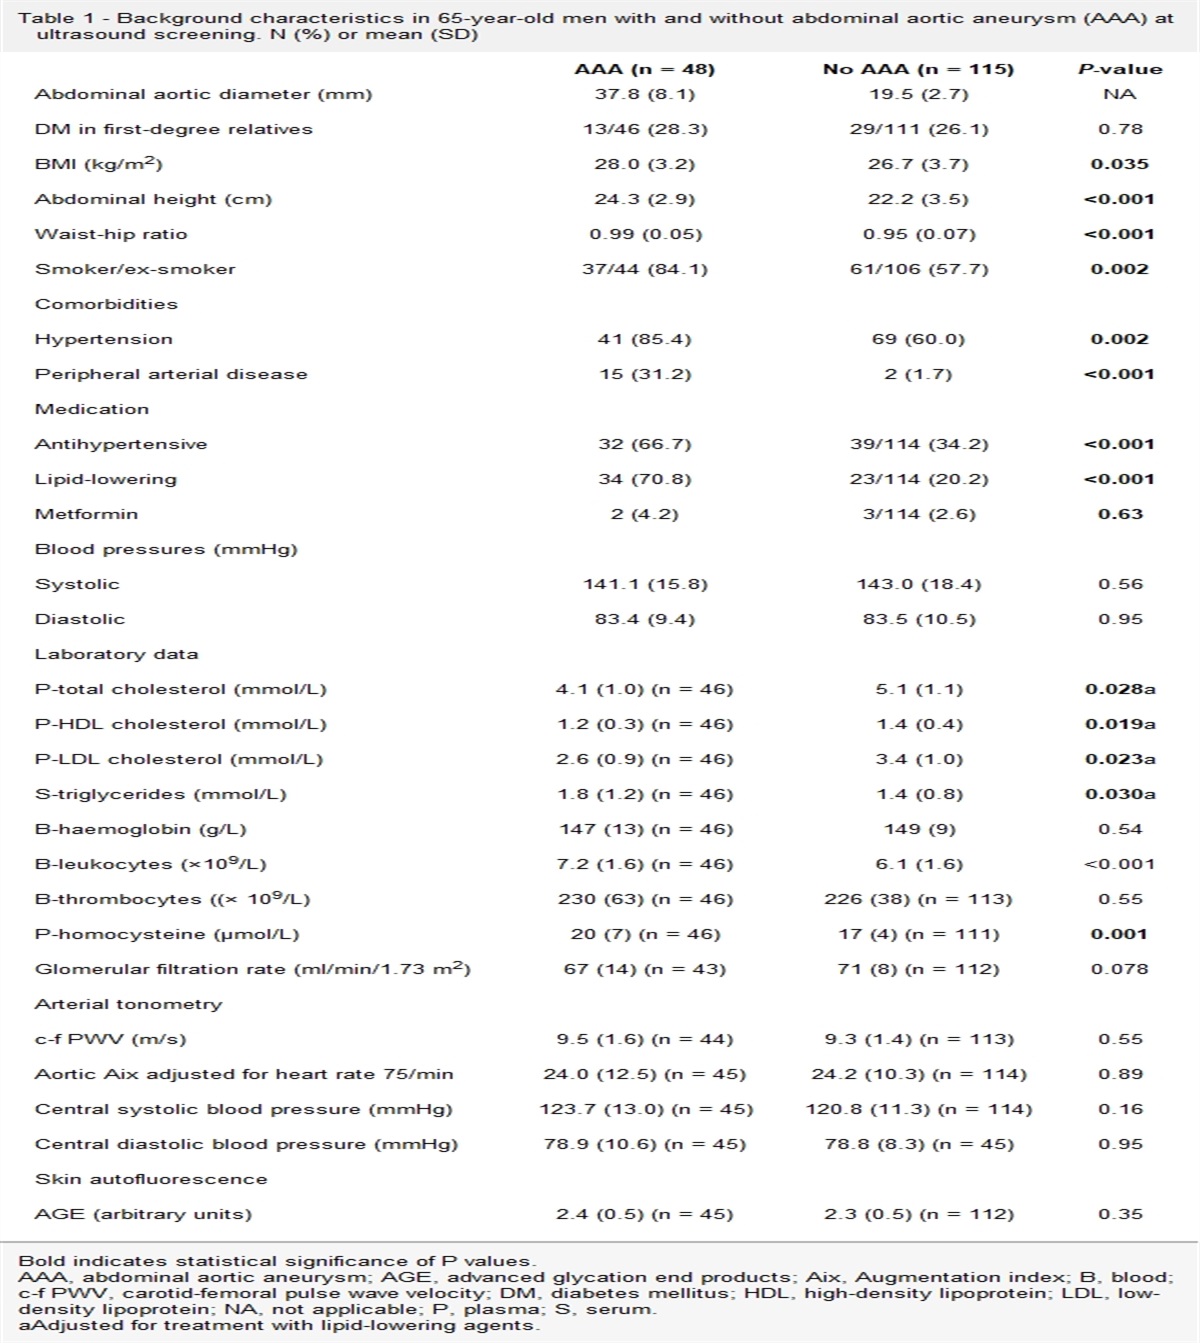
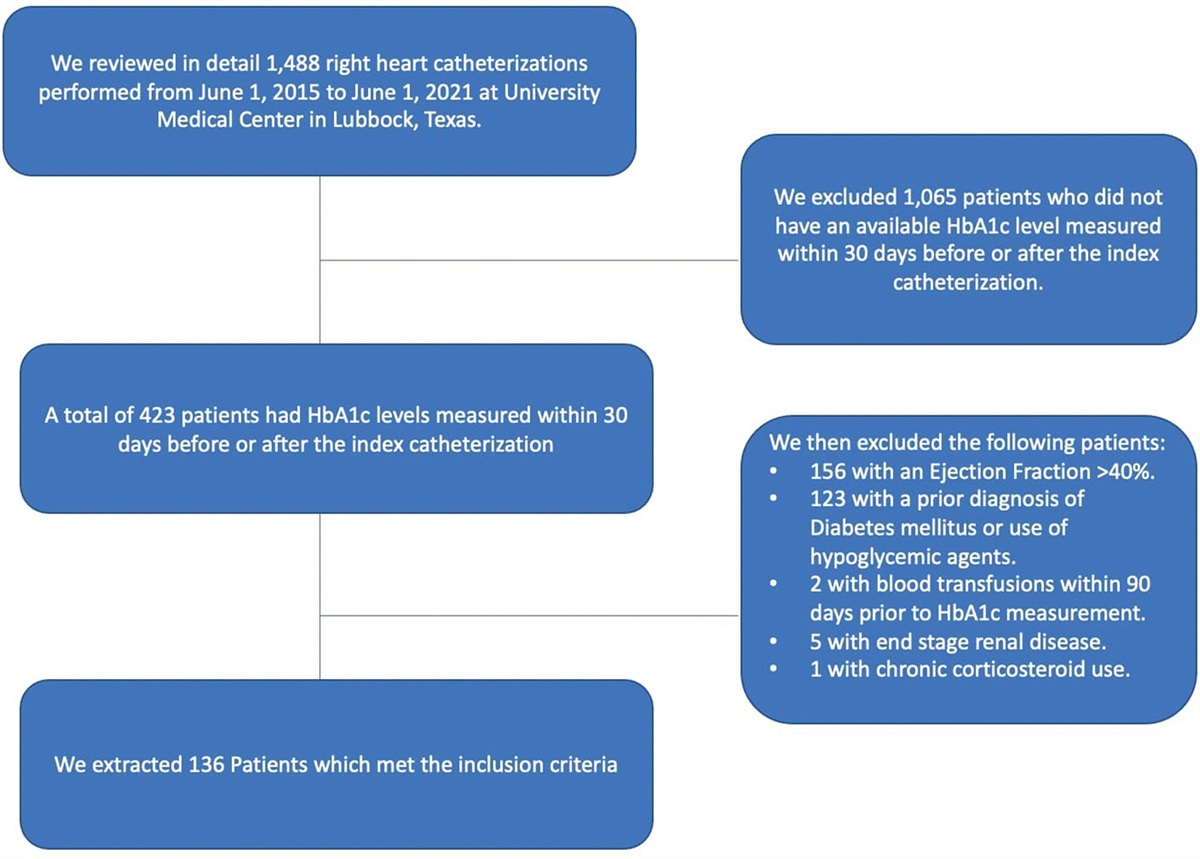
Results Gender, age, and height distribution of Waya usersAmong 903 Waya users, data from 837 users were available for analysis. We observed a higher percentage of female users (86.1%) compared to male users (13.9%). There were 721 females who subscribed to Waya. In contrast, only 116 males subscribed to and used the app. The average age of female users was 38 years of age while that of males was 39.5 years of age. The mean height of females was 167.1 cm and that of males was 181.5 cm (Table 3).
Table 3 - (Standard Deviation (SD)) to introduce the abbreviation Gender No. users Percentage users (%) Mean age (SD) in years Mean height (SD) in cm Female 721 86.1 38 (11.7) 167.1 (6.3) Male 116 13.9 39.5 (11.4) 181.5 (7.4)On the basis of the self-reported weight and height input, BMI of each Waya user was calculated. Among the 721 female Waya users, 6 (0.83%) were underweight, 202 (28%) had a normal BMI, 229 (31.8%) were overweight, and 284 (39.4%) were obese (Fig. 1a). Among the 116 males, 2 (1.7%) were underweight, 27 (23.3%) had a normal BMI, 44 (37.9%) were overweight and 43 (37.1%) were obese.
 Fig. 1:
 (a) BMI distribution in women and men. The graph above depicts the percentage distribution of underweight, normal BMI, overweight and obese participants in the two populations. The ‘n’ value is the total number of men and women who participated in the study (*P < 0.05). (b) Smoking behavior in women and men. The graph above depicts the percentage distribution of active smokers, former smokers, and non-smokers within the Waya and GEDA cohorts. The ‘n’ value is the total number of men and women who participated in the current analysis (*P < 0.05 for the specific category). Among Waya users, one woman and one man did not answer the question related to their smoking status. (c) Prevalence of arterial hypertension among women and men. This graph depicts the percentage of women and men who suffer from arterial hypertension in the Waya and GEDA cohorts. For Waya users, the number of women = 720 (as one did not complete this question), and the number of men = 116. For the GEDA cohort, the number of women = 12 247 and that of men = 11 720 (*P < 0.05). (d) Prevalence of diabetes among women and men. This graph depicts the percentage of men with diabetes and women in the Waya and GEDA cohorts. For Waya users, the number of women = 720 (as one did not complete this question), and the number of men = 116. For the GEDA cohort, the number of women = 11 929 and that of men = 11 416 (*P < 0.05). GEDA, German Health Update.
In comparison to the Waya users, substantial differences could be observed in the BMI status of both women and men in the GEDA 2014/2015 population (Fig. 1a). A higher proportion of women in the GEDA cohort were underweight (2.9% vs. 0.83% in the Waya cohort, P < 0.05) or had a normal BMI (50.4% vs. 28% in the Waya cohort, P < 0.05). A relatively lower proportion of women was obese (18% vs. 39.4% in the Waya cohort, P < 0.05), and the proportion of overweight women was similar (28.8% vs. 31.8%, P = 0.096). Among men, the proportion of underweight (0.8% vs. 1.7% in the Waya cohort, P = 0.56), as well as overweight individuals (43.3% vs. 37.9% in the Waya cohort, P = 0.29), was similar between the two populations, a larger proportion had a normal BMI (37.6% vs. 23.3% in Waya, P < 0.05) and a smaller proportion was obese (18.3% vs. 37.1% in Waya, P < 0.05).
Smoking statusSmoking behavior of users was recorded in three different categories: active smokers, former smokers, and non-smokers. Among Waya users, 119 women (16.5%) and 14 men (12.2%) were active smokers, 190 women (26.4%) and 45 men (39.1%) were former smokers, and 411 women (57.1%) and 56 men (48.7%) were non-smokers. As shown in Fig. 1b, the proportion of smokers in the GEDA cohort was significantly larger (women: 20.8% vs. 16.5% in Waya, P < 0.05; men: 27% vs. 12.2% in Waya, P < 0.05) in comparison to Waya users. As a result, the proportion of non-smokers was lower (women: 52.6% vs. 57.1% in the Waya cohort, P < 0.05; men: 38% vs. 48.8% in the Waya cohort, P < 0.05). The percentage of former smokers between the two groups remained the same (women: 26.6% vs. 26.4% in the Waya cohort, P = 0.93; men: 35% vs. 39.1% in the Waya cohort, P = 0.405).
HypertensionWithin the Waya population, 87 women (12.1%) and 26 men (22.4%) suffered from arterial hypertension. On comparing these proportions with the 12-month prevalence of arterial hypertension in the GEDA population, a significantly higher proportion of affected individuals was observed (women: 30.9% vs. 12.1% in the Waya cohort, P < 0.05; men: 32.8% vs. 22.4% in the Waya cohort, P < 0.05, Fig. 1c).
Polycystic ovary syndromeAmong the 721 women in the Waya cohort, we observed 13 women (1.8%) to be affected with PCOS. As there were no available population studies specifically targeting German women for the prevalence of PCOS at the time of writing, we could not further compare these results with any existing surveys.
DiabetesAmong Waya users, 28 women (3.9%) and 6 men (5.2%) were diabetic. Similar to the trend observed in hypertension, a higher proportion of women (7% vs. 3.9%, P < 0.05) were diabetic in the GEDA cohort. However, the proportion of diabetic men was similar between the two groups (5.2% vs. 8.6%, P = 0.26) (Fig. 1d).
DiscussionIn this study, we characterized the demographic features such as gender, age, height, and weight of users of a digital prevention course based on their responses to patient-reported outcome questionnaires. We observed a higher number of female users in comparison to male users. On further studying the prevalence of diabetes and its associated risk factors, we noted significant differences in the real-world population data collected in 2014–2015 by Robert Koch Institute and in the data collected in 2020 by the Waya app. These findings highlight the importance of Waya in collecting valuable real-world data, which might be a very useful asset in terms of studying the prevalence of diabetes and its risk factors over time. Monitoring disease progression and re-evaluating incidence rates at regular intervals is crucial on both national and international levels as it guides healthcare officials – as well as the government – to take the relevant measures required to improve the quality of life in patients.
Gender differences among Waya app usersOn grouping 837 Waya users based on gender, we observed a large number of female users (86.1%) in comparison to male users (13.8%). One of the main reasons for this observation is that women are more proactive in exploring and using nutrition and self-care apps compared to men [38]. An online survey conducted on 958 Germans in 2012 showed that women experience a higher social drive and joy in searching for health-related information on the internet than men. Furthermore, women had higher health and nutrition awareness on an aggregate level than men even though they were reluctant to make use of medical support in comparison to their male counterparts [39]. Waya is an interactive app that benefits users through a balanced diet plan, physical activities, challenges, and chat functions. This kind of interactive setup might explain the higher number of women using Waya in comparison to men. In the future, we plan on integrating more gamification features to also make the app more attractive for men to use. Additionally, the risk of an unhealthy lifestyle and being overweight should be made aware of during physical check-ups. Especially since medical applications like Waya are (partially) covered by health insurance in Germany, physicians could raise awareness of these easily accessible applications.
BMI distributionTo evaluate the prevalence of obesity – a known predictor of diabetes [14,15] – we studied the BMI distribution pattern in the Waya population. We observed a larger proportion of overweight and obese users compared to those who had a normal BMI or were underweight. This trend was expected as Waya is mainly intended to guide overweight and obese individuals through a structured weight loss program. Additionally, over 20% of users with a normal BMI highlight that such an app can also be used to maintain a healthy lifestyle with a balanced diet and routine exercises.
On further assessing the similarity of proportions between Waya users and the GEDA cohort, we observed a relatively higher percentage of individuals (women and men) with a normal BMI and a corresponding decrease in the percentage of obese individuals within the GEDA population compared to the population of Waya users. However, the proportion of overweight participants remained similar across the two groups. In the case of the underweight category, only the proportion of women was significantly larger in the GEDA cohort while the proportions of men remained unaltered. These variations are expected considering the purpose of the app, as explained above.
Obesity contributes directly to incident cardiovascular risk factors, including dyslipidemia, T2DM, hypertension, and sleep disorders [40]. The prevalence of obesity has been increasing in most countries since the 1980s [40]. Also in Germany, there has been a significant rise in the prevalence of obesity in recent years [1,30]. The GEDA 2014/2015-EHIS data showed a 2% increase in the prevalence of overweight and obese individuals compared to the 2010 study [30]. This alarming rise impacts health outcomes and increases the economic burden [14,41–43]. The recent collation of five different population surveys associated with the KORA project showed a direct correlation between medical expenses with BMI. On the basis of the grade of obesity, participants were expected to spend an excess of 300–1800€ per annum on medical expenses compared to normal individuals [41]. This burden makes obese individuals more eager to find easily accessible weight loss remedies and self-management programs compared to overweight participants. As a result, the BMI distribution observed in our population is more specific to our target group and may not entirely reflect the prevalence of the general German population.
Increased risk of T2DM [44], cardiovascular disease, and certain types of cancer [45,46], are associated with physical inactivity. On the contrary, physical activity reduces the risk of cardiovascular diseases and mortality [47] and has a positive long-term effect on weight gain, obesity, coronary heart disease, T2DM, as well as dementia, and Alzheimer’s disease [48]. In our previous study [49], we could observe an increased level of physical activity independent of age and gender. Waya focuses on guiding its users to monitor and manage their weight, diet, lifestyle, and physical activity through simple exercises, nutritional advice, and educational articles and videos, thereby contributing to an affordable, intervention to reduce weight and increase physical activity, in turn reducing the risk of cardiovascular diseases.
Smoking statusSmoking is one of the top preventable risk factors associated with diabetes [18], cardiovascular disease [50,51], respiratory disease [52], and cancer [53]. This prompted us to aim to understand the smoking behavior of Waya app users and compare their prevalence with previously reported observations. Our results clearly showed a higher proportion of non-smokers (>50% women and 48% men) compared to former smokers and current smokers. Furthermore, there were significant differences in the proportions of smokers and non-smokers between the Waya and GEDA populations. The proportions of smokers were much lower and those of non-smokers were much higher among Waya users compared to the GEDA population.
A previous health survey conducted by the RKI revealed a considerable 8- to 11-point decline in the percentage of adult smokers since 2003 [54]. Similar trends were also observed in the Epidemiological Survey of Substance Abuse [55] and the studies conducted by the Federal Centre for Health Education [56]. Our results are in line with recent trends observed in Germany. Over the course of the last 20 years, the German government has taken out numerous measures to curb the growth of the smoking population. These include age restrictions, higher taxes, and increased awareness of the health risks caused by smoking [57]. Owing to these strict measures and awareness, we believe that over time many have taken an informed decision to stop smoking (or not to start at all), explaining the rise in non-smokers and the growing prevalence of former smokers. Although the numbers look promising, there is still room for improvement when considering the premature death rate caused by smoking [32,58].
Hypertension and diabetesIn this study, we assessed the prevalence of arterial hypertension among Waya users given its high risk in the development of diabetes [16,17]. Our analysis showed a lower prevalence of arterial hypertension within the Waya population compared to the 12-month prevalence observed in the GEDA study. One of the main reasons for this difference is that we report point prevalence (i.e. the prevalence of arterial hypertension at that specific time point), whereas the GEDA study reports a 12-month prevalence [31]. Considering the fact that arterial hypertension can be controlled through medication and regular physical activity [59,60], users with controlled blood pressure would ideally not report arterial hypertension.
In the case of diabetes, we observed similar trends (i.e. lower prevalence in the Waya population (women and men) compared to the GEDA study). However, the change in proportion in the case of men is not significant. Owing to the strong association between diabetes and arterial hypertension and their frequency of co-occurrence [61,62], this observation was expected. We also believe that the reason for non-significance in the case of men is due to the low sample size (n = 116) compared to that of women (n = 720).
The German Health Interview and Examination Survey for Adults (DEGS1 study) conducted between 2008 and 2011 reported that age and socioeconomic status play a substantial role in the rising prevalence of diabetes [63]. The relatively low average age of users (38–39.5 years) could possibly explain the lower prevalence rate of diabetes. Additionally, Waya is mainly intended to prevent or control the development of diabetes. These factors cumulatively explain the low prevalence of diabetes among Waya app users.
Polycystic ovary syndromePCOS is a complex, partly heterogeneous endocrine disorder affecting women of reproductive age [20,64]. It is most commonly associated with obesity [65,66], hypertension [67], and diabetes [68]. We are among the first to study the prevalence of PCOS specifically in German women. Our results showed a PCOS prevalence of 1.8% among Waya users compared to the commonly accepted worldwide prevalence of 6–10% [69]. Within the confines of our research, the prevalence varied from fewer than 10 to 20% among respondents [70]. Our study provides valuable first insights and steps toward better understanding the prevalence of PCOS in Germany (n = 721). However, given the high dependency of PCOS prevalence on the diagnostic criteria and geographic distribution [69,70], further studies may be required to strongly suggest that the results observed in our cohort reflect the general prevalence of PCOS in Germany.
Limitations of the studyThe current study has a number of limitations with respect to data analysis and interpretation. Because the study mainly relies on self-reported data, the probability of a small percentage of false data inputs by users cannot be ignored. We assessed the prevalence of every risk factor independently and have not considered the interplay and association between co-existing factors. Due to the short time frame of the study, we collected health-related information from users only at the time of onboarding. This limits the scope of the study and prevents us from reaching a conclusion on the long-term effects of each risk factor for diabetes. In addition to the above, the low representation of males in our study population does not allow us to draw meaningful conclusions on gender-based prevalence patterns, instead providing initial hints towards probable trends.
Conclusion and outlookOur study provides a number of interesting insights into the sociodemographic patterns and prevalence of diabetes and its risk factors among users of a digital prevention course in Germany. We aim to further study the impact of the digital prevention course Waya on the quality of life of users and its influence on weight management and nutrition.
AcknowledgementsWe confirm that this article has not been submitted nor published elsewhere in part or in whole.
Conflicts of interestThere are no conflicts of interest.
References 1. Petersmann A, Nauck M, Müller-Wieland D, Kerner W, Müller UA, Landgraf R, et al. Definition, classification and diagnosis of diabetes mellitus. Exp Clin Endocrinol Diabetes. 2018; 126:406–410. 2. Khan RMM, Chua ZJY, Tan JC, Yang Y, Liao Z, Zhao Y. From pre-diabetes to diabetes: diagnosis, treatments and translational research. Medicina (Kaunas). 2019; 55:546. 3. Zaccardi F, Webb DR, Yates T, Davies MJ. Pathophysiology of type 1 and type 2 diabetes mellitus: a 90-year perspective. Postgrad Med J. 2016; 92:63–69. 4. Kleinberger JW, Pollin TI. Personalized medicine in diabetes mellitus: current opportunities and future prospects. Ann N Y Acad Sci. 2015; 1346:45–56. 5. Forouhi NG, Wareham NJ. Epidemiology of diabetes. Medicine (Abingdon). 2014; 42:698–702. 6. Dendup T, Feng X, Clingan S, Astell-Burt T. Environmental risk factors for developing type 2 diabetes mellitus: a systematic review. Int J Environ Res Public Health. 2018; 15:78. 7. Contreras I, Vehi J. Artificial intelligence for diabetes management and decision support: literature review. J Med Internet Res. 2018; 20:e10775. 8. Cho NH, Shaw JE, Karuranga S, Huang Y, da Rocha Fernandes JD, Ohlrogge AW, et al. IDF Diabetes Atlas: global estimates of diabetes prevalence for 2017 and projections for 2045. Diabetes Res Clin Pract. 2018; 138:271–281. 9. Olfert MD, Wattick RA. Vegetarian diets and the risk of diabetes. Curr Diab Rep. 2018; 18:101. 10. Saeedi P, Petersohn I, Salpea P, Malanda B, Karuranga S, Unwin N, et al. IDF Diabetes Atlas Committee. Global and regional diabetes prevalence estimates for 2019 and projections for 2030 and 2045: results from the International Diabetes Federation Diabetes Atlas, 9(th) edition. Diabetes Res Clin Pract. 2019; 157:107843. 11. Laxy M, Knoll G, Schunk M, Meisinger C, Huth C, Holle R. Quality of diabetes care in germany improved from 2000 to 2007 to 2014, but improvements diminished since 2007. evidence from the population-based KORA studies. PLoS One. 2016; 11:e0164704. 12. Noh JW, Jung JH, Park JE, Lee JH, Sim KH, Park J, et al. The relationship between age of onset and risk factors including family history and life style in Korean population with type 2 diabetes mellitus. J Phys Ther Sci. 2018; 30:201–206. 13. Kautzky-Willer A, Harreiter J, Pacini G. Sex and gender differences in risk, pathophysiology and complications of type 2 diabetes mellitus. Endocr Rev. 2016; 37:278–316. 14. Ganz ML, Wintfeld N, Li Q, Alas V, Langer J, Hammer M. The association of body mass index with the risk of type 2 diabetes: a case-control study nested in an electronic health records system in the United States. Diabetol Metab Syndr. 2014; 6:50. 15. Al-Goblan AS, Al-Alfi MA, Khan MZ. Mechanism linking diabetes mellitus and obesity. Diabetes Metab Syndr Obes. 2014; 7:587–591. 16. Kim MJ, Lim N-K, Choi S-J, Park H-Y. Hypertension is an independent risk factor for type 2 diabetes: the Korean genome and epidemiology study. Hypertens Res. 2015; 38:783–789. 17. Nilsson PM. Elevated blood pressure predicts type 2 diabetes, but why? J Hypertens. 2008; 26:1740–1741. 18. Maddatu J, Anderson-Baucum E, Evans-Molina C. Smoking and the risk of type 2 diabetes. Transl Res. 2017; 184:101–107. 19. Campagna D, Alamo A, Di Pino A, Russo C, Calogero AE, Purrello F, et al. Smoking and diabetes: dangerous liaisons and confusing relationships. Diabetol Metab Syndr. 2019; 11:85. 20. Lanzo E, Monge M, Trent M. Diagnosis and management of polycystic ovary syndrome in adolescent girls. Pediatr Ann. 2015; 44:e223–e230. 21. Rothe U, Manuwald U, Kugler J, et al.Quality criteria/key components for high quality of diabetes management to avoid diabetes-related complications. J Public Health (Berl). 2021; 29:1235–1241. 22. American Diabetes, A. Standards of medical care for patients with diabetes mellitus. Diabetes Care. 2003; 26(Suppl 1):S33–S50. 23. Trikkalinou A, Papazafiropoulou AK, Melidonis A. Type 2 diabetes and quality of life. World J Diabetes. 2017; 8:120–129. 24. Powers MA, Bardsley J, Cypress M, Duker P, Funnell MM, Fischl AH, et al. Diabetes self-management education and support in type 2 diabetes: a joint position statement of the American Diabetes Association, the American Association of Diabetes Educators, and the Academy of Nutrition and Dietetics. Clin Diabetes. 2016; 34:70–80. 25. Kaufman N, Khurana I. Using digital health technology to prevent and treat diabetes. Diabetes Technol Ther. 2016; 18(Suppl 1):S56–S68. 26. Cahn A, Akirov A, Raz I. Digital health technology and diabetes management. J Diabetes. 2018; 10:10–17. 27. Pal K, Dack C, Ross J, Michie S, May C, Stevenson F, et al. Digital health interventions for adults with type 2 diabetes: qualitative study of patient perspectives on diabetes self-management education and support. J Med Internet Res. 2018; 20:e40. 29. Lange C, Finger JD, Allen J, Born S, Hoebel J, Kuhnert R, et al. Implementation of the European Health Interview Survey (EHIS) into the German health update (GEDA). Arch Public Health. 2017; 75:40. 30. Schienkiewitz A, Mensink G, Kuhnert R, Lange C. Overweight and obesity among adults in Germany. In: Journal of Health Monitoring. Robert Koch-Institut, Epidemiologie und Gesundheitsberichterstattung2017. 31. Neuhauser H, Kuhnert R, Born S. 12-month prevalence of hypertension in Germany. Robert Koch-Institut, Epidemiologie und Gesundheitsberichterstattung2017. 32. Zeiher J, Kuntz B, Lange C. Smoking among adults in Germany. Robert Koch-Institut, Epidemiologie und Gesundheitsberichterstattung2017. 33. Heidemann C, Kuhnert R, Born S, Scheidt-Nave C. Journal of Health Monitoring. Robert Koch-Institut2017. 34. McHugh ML. The chi-square test of independence. Biochem Med (Zagreb). 2013; 23:143–149. 35. Johnson WD, Beyl RA, Burton JH, Johnson CM, Romer JE, Zhang L. Use of Pearson’s Chi-square for testing equality of percentile profiles across multiple populations. Open J Stat. 2015; 5:412–420. 36. Newcombe RG. Interval estimation for the difference between independent proportions: comparison of eleven methods. Stat Med. 1998; 17:873–890. 37. Newcombe RG. Two-sided confidence intervals for the single proportion: comparison of seven methods. Stat Med. 1998; 17:857–872. 38. Bol N, Helberger N, Weert JCM. Differences in mobile health app use: a source of new digital inequalities? Info Soc. 2018; 34:183–193. 39. Bidmon S, Terlutter R. Gender differences in searching for health information on the internet and the virtual patient-physician relationship in Germany: Exploratory results on how men and women differ and why. J Med Internet Res. 2015; 17:e156. 40. Powell-Wiley TM, Poirier P, Burke LE, Després JP, Gordon-Larsen P, Lavie CJ, et al. Obesity and cardiovascular disease: a scientific statement from the American Heart Association. Circulation. 2021; 143:e984–e1010. 41. Yates N, Teuner CM, Hunger M, Holle R, Stark R, Laxy M, et al. The economic burden of obesity in Germany: results from the population-based KORA studies. Obes Facts. 2016; 9:397–409. 42. Yang XY, Zhang M, Luo XP, Wang JJ, Yin L, Pang C, et al. Body mass index, waist circumference and waist-to-height ratio associated with the incidence of type 2 diabetes mellitus: a cohort study. Zhonghua Yu Fang Yi Xue Za Zhi. 2016; 50:328–333. 43. DiBonaventura M, Nicolucci A, Meincke H, Le Lay A, Fournier J. Obesity in Germany and Italy: prevalence, comorbidities, and associations with patient outcomes. Clinicoecon Outcomes Res. 2018; 10:457–475. 44. González K, Fuentes J, Márquez JL. physical inactivity, sedentary behavior and chronic diseases. Korean J Fam Med. 2017; 38:111–115. 45. Knight JA. Physical inactivity: associated diseases and disorders. Ann Clin Lab Sci. 2012; 42:320–337. 46. Gaetano A. Relationship between physical inactivity and effects on individual health status. J Phys Educ Sport. 2016; 16(Supplement issue 2):1069–1074. 47. Löllgen H, Löllgen D. Risk reduction in cardiovascular diseases by physical activity. Internist (Berl). 2012; 53:20–29. 48. Reiner M, Niermann C, Jekauc D, Woll A. Long-term health benefits of physical activity – a systematic review of longitudinal studies. BMC Public Health. 2013; 13:813. 49. Balakrishnan P, Owen E, Eberl M, Friedrich B, Etter T. A retrospective real-world observational pilot analysis of Waya: a self-monitoring fitness app in Germany. Cardiovasc Endocrinol Metab. 2022; 11:e0266. 50. Mons Ute, Müezzinler A, Gellert C, Schöttker B, Abnet CC, Bobak M, de Groot L. CHANCES Consortium. Impact of smoking and smoking cessation on cardiovascular events and mortality among older adults: meta-analysis of individual participant data from prospective cohort studies of the CHANCES consortium. BMJ. 2015; 350:h1551. 51. Ptushkina V, Jacobs E, Schipf S, Völzke H, Markus MRP, Nauck M, et al. Regional differences of macrovascular disease in Northeast and South Germany: the population-based SHIP-TREND and KORA-F4 studies. BMC Public Health. 2018; 18:1331. 52. Forey BA, Thornton AJ, Lee PN. Systematic review with meta-analysis of the epidemiological evidence relating smoking to COPD, chronic bronchitis and emphysema. BMC Pulm Med. 2011; 11:36. 53. Pesch B, Kendzia B, Gustavsson P, Jöckel K-H, Johnen G, Pohlabeln H, et al. Cigarette smoking and lung cancer--relative risk estimates for the major histological types from a pooled analysis of case-control studies. Int J Cancer. 2012; 131:1210–1219. 54. Koch-Institut, R. Daten und Fakten: Ergebnisse der Studie ‘Gesundheit in Deutschland aktuell 2012’. Robert Koch-Institut2014. 55. Matos EG, Atzendorf J, Kraus L, Piontek D. Substanzkonsum in der Allgemeinbevölkerung in Deutschland. SUCHT. 2016; 62:271–281. 56. Orth B. Die Drogenaffinität Jugendlicher in der Bundesrepublik Deutschland 2015. Rauchen, Alkoholkonsum und Konsum illegaler Drogen: aktuelle Verbreitung und Trends. BZgA-Forschungsbericht. Bundeszentrale für gesundheitliche Aufklärung2016. 57. Kuntz B, et al. Zeitliche Entwicklung des Absatzes von Tabakwaren in Deutschland. Robert Koch-Institut, Epidemiologie und Gesundheitsberichterstattung2017. 58. Mons U. Tobacco-attributable mortality in Germany and in the German Federal States - calculations with data from a microcensus and mortality statistics. Gesundheitswesen. 2011; 73:238–246. 59. Noone C, Dwyer CP, Murphy J, Newell J, Molloy GJ. Comparative effectiveness of physical activity interventions and anti-hypertensive pharmacological interventions in reducing blood pressure in people with hypertension: protocol for a systematic review and network meta-analysis. Syst Rev. 2018; 7:128. 60. Pescatello LS, MacDonald HV, Lamberti L, Johnson BT. Exercise for hypertension: a prescription update integrating existing recommendations with emerging research. Curr Hypertens Rep. 2015; 17:87. 61. Movahed MR, Sattur S, Hashemzadeh M. Independent association between type 2 diabetes mellitus and hypertension over a period of 10 years in a large inpatient population. Clin Exp Hypertens. 2010; 32:198–201. 62. Zhao H, Zeng F, Wang X, Wang L. Prevalence, risk factors, and prognostic significance of masked hypertension in diabetic patients. Medicine (Baltim). 2017; 96:e8363. 63. Heidemann C, Du Y, Schubert I, Rathmann W, Scheidt-Nave C. Prevalence and temporal trend of known diabetes mellitus: results of the German Health Interview and Examination Survey for Adults (DEGS1). Bundesgesundheitsblatt Gesundheitsforschung Gesundheitsschutz. 2013; 56:668–677. 64. Kyrou I, Karteris E, Robbins T, Chatha K, Drenos F, Randeva HS. Polycystic ovary syndrome (PCOS) and COVID-19: an overlooked female patient population at potentially higher risk during the COVID-19 pandemic. BMC Med. 2020; 18:220. 65. Hallajzadeh J, Khoramdad M, Karamzad N, Almasi-Hashiani A, Janati A, Ayubi E, et al. Metabolic syndrome and its components among women with polycystic ovary syndrome: a systematic review and meta-analysis. J Cardiovasc Thorac Res. 2018; 10:56–69. 66. Hahn S, Tan S, Sack S, Kimmig R, Quadbeck B, Mann K, et al. Prevalence of the metabolic syndrome in German women with polycystic ovary syndrome. Exp Clin Endocrinol Diabetes. 2007; 115:130–135.
留言 (0)