
記住我

Hypertriglyceridemia is a hallmark of metabolic syndrome and type 2 diabetes mellitus (T2DM) and an independent risk factor for cardiovascular disease (CVD) [1,2]. High triglycerides are a marker for the presence of atherogenic triglyceride-rich lipoproteins (TRLs). Clearance of TRLs by the liver is achieved by the low-density lipoprotein receptor (LDL-R), heparan sulfate proteoglycans (HSPGs) and possibly the LDL-R-related protein 1 (LRP1) [3,4]. HSPGs are a diverse group of proteoglycans and are involved in several physiological processes throughout the body. Syndecan-1 is the primary HSPG that mediates the clearance of TRLs in the liver [3]. It contains a single transmembrane protein to which sugar polymers are attached, heparan sulfates, that bind TRLs and subsequently clear them from the circulation [5].
A study in mice identified that dysregulation of the heparan sulfate glucosamine-6-O-endosulfatase-2 (SULF2)-gene disrupts HSPG structure [6]. The SULF2 gene encodes the Sulf2 enzyme that decreases the sulfation grade of the heparan sulfate chains by removing essential 6-O sulfate residues, thereby preventing binding and clearance of TRLs from the circulation by HSPGs. In obese and diabetic mice, Sulf2 overexpression results in TRL accumulation in plasma [6,7]. Furthermore, liver biopsies from obese subjects showed a significant positive association between Sulf2 mRNA expression and fasting plasma triglycerides levels [8]. The rs2281279 single nucleotide polymorphism (SNP) in the SULF2 gene (with an estimated allele frequency of 28% in Europeans [9]) was evaluated in patients with and without T2DM [8,10–12]. The presence of the minor G allele of rs2281279 is thought to be associated with less Sulf2 [10] and therefore more functional HSPG, however, different studies showed conflicting results with regard to this SNP and metabolic parameters and CVD [8,10–12].
Proper HSPG function is particularly relevant in subjects homozygous for the ε2 allele in the APOE gene (approximately 1% of the general population) [13] because compared to other APOE genotypes, the ε2ε2 genotype results in a decreased affinity (<2%) of apolipoprotein E2 (apoE2) to the LDL-R, thereby impairing TRL clearance through this receptor [14]. The binding of apoE2 protein to HSPG is also decreased in ε2ε2 subjects (~60%) but the remaining binding capacity is considered sufficient for adequate TRL uptake [15]. Subjects with the ε2ε2 genotype are at risk to develop familial dysbetalipoproteinemia, a highly atherogenic disorder characterized by (postprandial) TRL accumulation and premature CVD [16]. For the development of familial dysbetalipoproteinemia a second metabolic hit – notably adiposity or insulin resistance – is required. It is hypothesized that insulin resistance can cause familial dysbetalipoproteinemia in ε2 homozygotes by overexpression of Sulf2 [17].
In the present study in patients at high cardiovascular risk, we aim to evaluate whether the presence of the minor G allele of rs2281279, is associated with favorable metabolic parameters and a decrease in the risk of vascular events and T2DM. Furthermore, we aim to evaluate whether the APOE genotype modifies the relationship between the presence of the minor allele G in rs2281279 and metabolic parameters.
Material and methods Study populationPatients originated from the Utrecht Cardiovascular Cohort-Second Manifestations of Arterial Disease (UCC-SMART) study. The UCC-SMART study is an ongoing, single-center, prospective cohort study including newly referred patients to the University Medical Center Utrecht from 18 years of age with established CVD or cardiovascular risk factors. A description of the study protocol has been published elsewhere [18]. The UCC-SMART study was approved by the local Medical Ethics Committee and written informed consent was obtained from all patients.
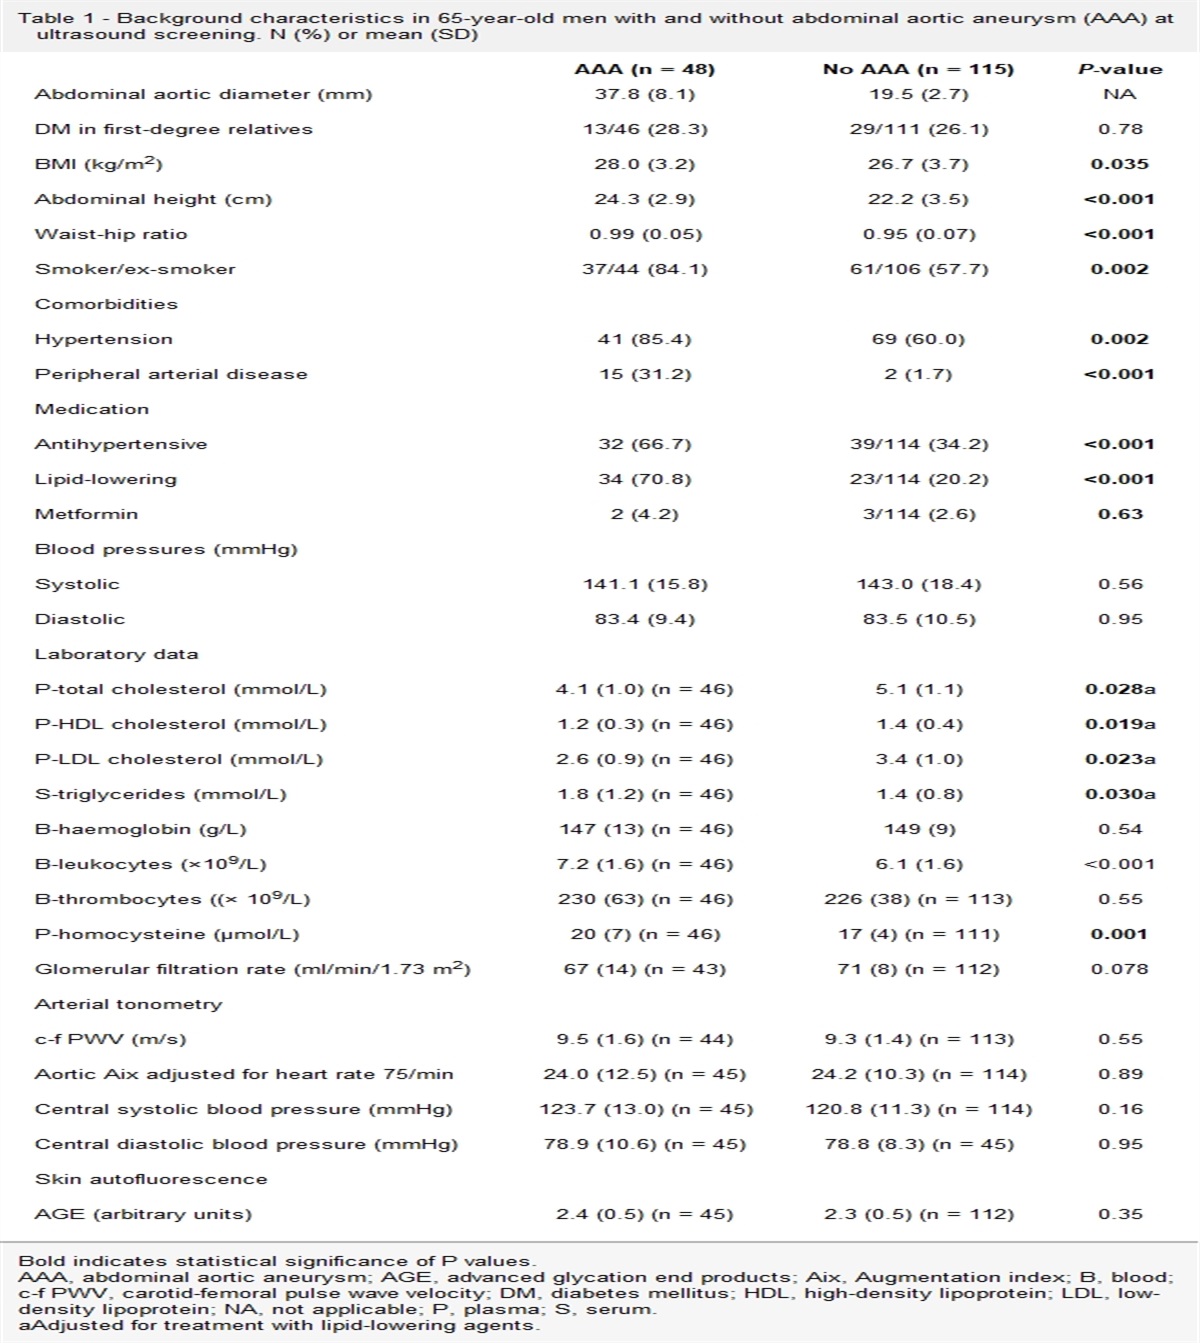
Vascular screening at baselineAfter inclusion, all patients underwent a vascular screening protocol, including health questionnaires, physical examination, laboratory testing, ankle-branchial index and abdominal, aortic and carotid ultrasound. Vascular disease at baseline was defined as the presence of clinically evident coronary artery disease (CAD), cerebrovascular disease (CeVD), peripheral arterial disease (PAD) or abdominal arterial aneurysm (AAA). For definitions of these types of CVD at baseline see Supplementary Table S1, Supplemental digital content 1, https://links.lww.com/CAEN/A39. T2DM was defined as either a referral or self-reported diagnosis of T2DM, or a fasting plasma glucose ≥7 mmol/L at study inclusion with the initiation of glucose-lowering treatment within 1 year, or baseline use of hypoglycemic agents or insulin. Medication use, smoking and alcohol use were self-reported. Lipid-lowering medication included the use of statins, fibrates, ezetimibe or bile acid sequestrants at baseline. Prescription of high-intensity statins was defined as atorvastatin ≥40 mg or rosuvastatin ≥20 mg. Patients with hypertension were defined as those who were prescribed antihypertensive medication or had an office SBP of ≥140 or DBP of ≥90 mmHg. Obesity was defined as a BMI >30 kg/m2. Metabolic syndrome (MetS) was defined according to the National Cholesterol Education Program Adult Treatment Panel III definition [19].
Patient selection and imputation of rs2281279To date, in total 13 667 patients are included in the UCC-SMART study. For the present study, data were used from all patients (patients with established CVD or hypertension, T2DM or dyslipidemia) enrolled in the UCC-SMART study between September 1996 and August 2010 because patients included in this period were genotyped (n = 6,970). Samples were genotyped using the Illumina Infinium Global Screening Array and extensive sample and SNP quality control was conducted according to community standards to remove low-quality samples and SNPs. In addition, only samples from European descent were kept, and related samples were excluded by keeping only a single sample from each pair, resulting in 5959 patients eligible for the analyses. Because the SNP of interest (rs2281279) was not genotyped in this cohort, imputation of this SNP was performed using the 1000 Genomes Project (1 KG) phase 3 and Genome of the Netherlands Consortium v5 as reference panels (PMID: 24974849 and 20981092). SHAPEIT2 was used for phasing and IMPUTE2 for subsequent imputation. The imputation quality (info score, r2) of this SNP was 0.836. Genotype probabilities were transformed to best-guess genotypes using a cutoff of 0.1 (from 0, 1 and 2). For this cutoff, 10% uncertainty was considered acceptable. This cutoff is also used in standard Genome-Wide Association Studies software (PLINK and QCTOOL/SNPTEST). Patients with a high probability of having an AA, AG or GG genotype for rs2281279 [imputation value <0.10 (AA), value between >0.90 and <1.10 (AG) and value >1.90 (GG)] were included. Patients with a low probability (genotype probability between >0.10 and <0.90 and between >1.10 and <1.90) were excluded (n = 1,573), resulting in 4386 patients eligible for the analyses.
Laboratory measurementsBaseline lipid levels were obtained in a fasting state. Total cholesterol, triglycerides and glucose were measured with a commercial enzymatic dry chemistry kit (Johnson & Johnson, New Brunswick, USA). High-density lipoprotein-cholesterol (HDL-C) was measured with a commercial enzymatic kit (Boehringer, Mannheim, Germany) and LDL-cholesterol (LDL-C) was calculated using the Friedewald formula up to triglycerides levels of 9 mmol/L [20,21]. Non-HDL-cholesterol (Non-HDL-C) was calculated as fasting total cholesterol minus HDL-C. From 2003 onwards, insulin was measured with an immunometric technique on an IMMULITE 1000 Analyzer (Diagnostic Products Corporation, Los Angeles, USA). Before 2003, insulin was not measured. The quantitative insulin sensitivity check index (QUICKI) was used to express insulin sensitivity. It was calculated using the formula: 1/[log(insulin in mU/L) minus log(glucose in mg/dL] [22]. In patients without T2DM, the Homeostatic Model Assessment for Insulin Resistance (HOMA-IR) was calculated as follows: Glucose (in mmol/L) × insulin (in mU/L)/22.5 [23].
Follow-upDuring follow-up, patients received questionnaires to evaluate possible cardiovascular events twice a year. Outcomes of interest for this study were the combination of nonfatal and fatal vascular events, limb events and T2DM. T2DM was not routinely assessed before July 2006. All patients without diabetes at baseline that were included before July 2006 received a questionnaire in 2006, to assess if they had been diagnosed with T2DM since inclusion. If an event was reported, hospital discharge letters, relevant laboratory results and radiologic examinations were collected and the event was classified independently by three physicians of the UCC-SMART endpoint committee. For detailed definitions of outcomes see Supplementary Table S2, Supplemental digital content 1, https://links.lww.com/CAEN/A39. Follow-up was defined as the time from inclusion until the development of the first event, death, loss to follow-up or the preselected date of 1 July 2019.
Data analysesTo prevent loss of statistical power and potential bias [24], missing data were imputed by single regression imputation. Missing values were <1.0%, except for use of high-intensity statins (10%) and waist- and hip circumference (16%). Insulin was not imputed because this was not measured before 2003, therefore 1919 (44%) patients had missing insulin, and consequently also QUICKI, values. Linear regression models were fitted to determine the cross-sectional association between rs2281279 genotype and triglycerides, non-HDL-C, insulin and QUICKI, with adjustment for age and sex. For TGs and insulin linearity was obtained after log transformation.
Cox proportional hazard models were fitted to determine the effect of the rs2281279 genotype on cardiovascular events, limb events and T2DM. Restricted cubic splines showed a linear relationship between rs2281279 genotype and outcomes, therefore confirming proportional hazards. The Cox proportional hazard assumption was also visually checked by plotting Schoenfeld residuals against time. For vascular events data from 4386 patients were used. For the T2DM event data from 3289 patients without DM at baseline for whom follow-up data on T2DM were available were used. For all regression analyses, an additive model with imputed rs2281279 genotype as a continuous determinant was used and a wild type (AA) was used as the reference category. Cox models were adjusted for age and sex. A P value of <0.05 was considered significant. Analyses were performed using RStudio (version 3.5.1, R Foundation for Statistical Computing, Vienna, Austria).
Sensitivity analysesTo evaluate whether the association between the rs2281279 genotype, metabolic parameters and outcomes was influenced by the presence of T1DM, hypertriglyceridemia (triglycerides >9 mmol/L) or vascular disease at baseline the analyses were repeated excluding these specific subgroups. To increase certainty with regard to the rs2281279 genotype a stricter cutoff (0.05 instead of 0.10) to transform genotype probabilities to best-guess genotypes was used (Supplementary Table S4 and S5, Supplemental digital content 1, https://links.lww.com/CAEN/A39). The effect of potential effect modifiers (vascular disease, BMI, age, sex, hypertension, metabolic syndrome and T2DM) were tested by adding an interaction term to the linear regression and Cox models.
SULF2 genotype and APOE genotypeDescriptive analyses are provided for patients with either an APOE ε2ε2 or ε3ε3 genotype in combination with an AA or GG genotype for rs2281279. We hypothesize that an ε2ε2 genotype in combination with an AA genotype in rs2281279 mimics an familial dysbetalipoproteinemia model because in that case both TRL clearing pathways are not properly functioning. Patients with an ε2ε2 genotype in combination with a GG genotype in rs2281279 mimic in that case ‘healthy’ ε2ε2 subjects. Subjects with an ε3ε3 genotype in combination with an AA genotype of rs2281279 mimic decreased HSPG function only. Finally, an ε3ε3 genotype and a GG genotype in rs2281279 mimic a healthy model with two functioning TRL clearance pathways.
Results Baseline characteristicsIn total 4386 patients at high risk for CVD were included. Baseline characteristics stratified for the imputed rs2281279 genotype are shown in Table 1. Mean age was 57.9 ± 12.2 years and 69% were male, 45% had a history of CAD, 16% of CeVD, 20% of PAD and 7% of AAA. Furthermore, 16% of the patients had T2DM and 50% fulfilled the criteria for metabolic syndrome. The AA genotype was present in 2438 (55%) patients, 1642 patients (37%) had an AG genotype and 306 patients (7%) had a GG genotype. The minor G allele frequency was 26%, which is comparable with the frequency earlier reported in the European population [9]. There were no relevant differences at baseline across rs2281279 genotypes, including age and sex. There were also no differences in the use of lipid-lowering medication, including subtypes of lipid-lowering, across the three groups.
Table 1 - Baseline characteristics according to rs2281279 genotype AA (n = 2438) AG (n = 1642) GG (n = 306) All patients (n = 4386) Male sex (n, %) 1687 (69%) 1103 (67%) 218 (72%) 3008 (69%) Age 58.0 ± 12.1 57.5 ± 12.4 58.8 ± 11.5 57.9 ± 12.2 Type of vascular disease Coronary heart disease (n, %) 1106 (45%) 733 (45%) 147 (48%) 1986 (45%) Peripheral vascular disease (n, %) 399 (16%) 245 (15%) 56 (18%) 700 (16%) Cerebrovascular disease (n, %) 481 (20%) 323 (20%) 65 (21%) 869 (20%) Abdominal aortic aneurysm (n, %) 166 (7%) 117 (7%) 15 (5%) 298 (7%) Diabetes mellitus type 2 (n, %) 409 (17%) 261 (16%) 48 (16%) 718 (16%) Medication use Lipid-lowering treatment 1368 (56%) 891 (54%) 180 (59%) 2439 (56%) Statins 1350 (55%) 885 (54%) 176 (58%) 2411 (55%) High-intensity statins 120 (5%) 91 (6%) 17 (6%) 228 (5%) Fibrates 48 (2%) 34 (2%) 6 (2%) 88 (2%) Ezetimibe 66 (3%) 47 (3%) 5 (2%) 118 (3%) Bile acid sequestrant 1 (0%) 2 (0%) 0 (0%) 4 (0%) Antihypertensive treatment 1631 (67%) 1087 (66%) 206 (67%) 2924 (67%) Platelet inhibitors 1418 (58%) 957 (58%) 191 (62%) 2566 (59%) Current smoking 776 (32%) 534 (33%) 101 (33%) 1411 (32%) Current alcohol consumption 1215 (50%) 790 (48%) 157 (51%) 2162 (49%) BMI (kg/m2) 26.8 ± 4.3 26.5 ± 4.2 26.9 ± 4.5 26.7 ± 4.3 Waist circumference (cm) 95 ± 13 94 ± 12 95 ± 13 94 ± 12 Waist-to-hip ratio 0.91 ± 0.08 0.90 ± 0.09 0.91 ± 0.09 0.91 ± 0.08 Metabolic syndrome 1226 (50%) 817 (50%) 168 (55%) 2211 (50%) SBP (mmHg) 142 ± 21 141 ± 22 141 ± 22 141 ± 22 DBP (mmHg) 83 ± 12 83 ± 12 83 ± 12 83 ± 12 Laboratory values Total cholesterol (mmol/L) 5.17 ± 1.45 5.17 ± 1.36 5.19 ± 1.39 5.17 ± 1.41 HDL-cholesterol (mmol/L) 1.23 ± 0.39 1.24 ± 0.39 1.21 ± 0.33 1.23 ± 0.38 Non-HDL-cholesterol (mmol/L) 3.93 ± 1.46 3.94 ± 1.37 3.98 ± 1.38 3.94 ± 1.42 LDL-cholesterol (mmol/L) 3.14 ± 1.23 3.15 ± 1.20 3.19 ± 1.26 3.15 ± 1.22 Triglycerides (mmol/L) 1.40 (1.00–2.10) 1.44 (1.00–2.10) 1.41 (1.00–2.30) 1.40 (1.00–2.10) Insulin (mU/L) 9 (6–14) 9 (6–15) 9 (6–15) 9 (6–14) Glucose (mmol/L) 6.3 ± 2.1 6.3 ± 2.0 6.4 ± 1.8 6.3 ± 2.0All data in n (%), mean with standard deviation or median (interquartile range).
HDL, high-density lipoprotein; LDL, low-density lipoprotein.
Fasting triglycerides levels were not different across genotypes [AA 1.40 (1.00–2.10) mmol/L; AG 1.44 (1.00–2.10) mmol/L; GG 1.41 (1.00–2.30); P = 0.52]. There was no effect of rs2281279 genotype on (log) triglycerides levels [β per additional G allele 0.004; 95% confidence interval (CI), −0.008 to 0.016] or non-HDL-C (β, 0.013; 95% CI, −0.054 to 0.080). There was also no effect on (log) insulin levels (β, −0.008; 95% CI, −0.026 to 0.010) and QUICKI (β, 0.001; 95% CI, −0.001–0.003) (Table 2). Estimates did not change in an unadjusted model or in a model additionally adjusted for BMI, use of lipid-lowering medication, SBP, smoking and T2DM.
Table 2 - Additive effect of the presence of rs2281279 (G allele) on metabolic parameters (n = 4386) Beta (95% CI) (log)Triglycerides 0.004 (−0.008 to 0.016) Non-HDL-cholesterol 0.013 (−0.054 to 0.080) (log)Insulina −0.008 (−0.026 to 0.010) QUICKIa 0.001 (−0.001 to 0.003)Model adjusted for age + sex.
CI, confidence interval; HDL, high-density lipoprotein; QUICKI, quantitative insulin sensitivity check index.
an = 2467.
In patients at high cardiovascular risk (n = 4386), median follow-up was 11.8 (IQR, 9.3–15.5) years in which 1026 cardiovascular events and 320 limb events occurred. An additional G allele in the rs2281279 SNP did not affect the risk of (recurrent) cardiovascular events [hazard ratio (HR, 1.03; 95% CI, 0.94–1.14)] or (recurrent) limb events (HR, 0.92; 95% CI, 0.77–1.10). In patients without diabetes at baseline for whom follow-up data were available (n = 3289), 395 new T2DM cases were diagnosed during a median follow-up of 12.3 (IQR, 10.0–16.0) years. An additional G allele in the rs2281279 SNP did not change the risk (HR, 1.09; 95% CI, 0.94–1.27) for T2DM during follow-up (Table 3). Results of an unadjusted model were similar to results of a model additionally adjusted for BMI, use of lipid-lowering medication, SBP, smoking and T2DM.
Table 3 - Additive effect of presence of rs2281279 (G allele) on vascular events and T2DM Number of patients Number of events (%) HR (95% CI) Cardiovascular events 4386 1026 (23%) 1.03 (0.94–1.14) Limb events 4386 320 (7%) 0.92 (0.77–1.10) T2DM 3289 395 (12%) 1.09 (0.94–1.27)Model adjusted for age + sex.
CI, confidence interval; HR, hazard ratio; T2DM, type 2 diabetes mellitus.
Analyses when excluding patients with T1DM (n = 96), patients with triglycerides >9 mmol/L (n = 36) or patients without vascular disease at baseline (n = 1144) did not change the results (data not shown). Furthermore, when using a stricter cutoff of 0.05 to transform genotype probabilities to best-guess genotypes, 3930 patients (AA; n = 2225, AG; n = 1445, GG; n = 260) were included. Using this cutoff did not change the results (Supplementary Table S3 and S4, Supplemental digital content 1, https://links.lww.com/CAEN/A39).
Vascular disease, BMI, age, sex, hypertension and MetS did not affect the relationship between rs2281279 genotype and (log) triglycerides and between rs2281279 genotype and cardiovascular events, respectively (P for all interactions >0.05).
However, T2DM was an effect modifier in the relation between the rs2281279 genotype and (log) triglycerides (p for interaction 0.04). Therefore, the results were stratified for T2DM status (Supplementary Table S5–S7, Supplemental digital content 1, https://links.lww.com/CAEN/A39). The effect of rs2281279 genotype on (log) triglycerides in patients without T2DM was β, 0.010 (95% CI, −0.002 to 0.023) and in patients with T2DM β, −0.020 (95% CI, −0.051 to 0.011) per additional G allele. In patients without T2DM, median triglycerides levels were 1.35 (IQR, 1.00–2.00) mmol/L in patients with an AA genotype (n = 2029) and 1.40 (IQR, 1.00–2.30) mmol/L in patients with a GG genotype (n = 258). In patients with T2DM, median triglycerides levels were 1.70 (IQR, 1.18–2.60) mmol/L in patients with an AA genotype (n = 409) and 1.74 (IQR, 1.28–2.33) mmol/L in patients with a GG genotype (n = 48) (Supplementary Table S6, Supplemental digital content 1, https://links.lww.com/CAEN/A39).
There was no interaction of T2DM status in the relation between rs2281279 genotype and non-HDL-C, (log)insulin or QUICKI (Supplementary Table S5, Supplemental digital content 1, https://links.lww.com/CAEN/A39). In addition, there was no interaction with T2DM in the relation between rs2281279 and vascular events (Supplementary Table S7, Supplemental digital content 1, https://links.lww.com/CAEN/A39).
Association between SULF2 genotype and APOE genotypeThe SULF2 AA + ε2ε2 group included 29 patients and the SULF2 GG + ε2ε2 group consisted of four patients. Comparing these ε2ε2 subgroups, there was a remarkable difference in SBP (149 ± 22 mmHg in SULF2 AA vs. 135 ± 6 mmHg in SULF2 GG), total cholesterol (in SULF2 AA 6.20 ± 3.52 mmol/L vs. 4.78 ± 1.58 mmol/L in SULF2 GG), triglycerides [2.48 (IQR, 1.75–4.11) mmol/L in SULF2 AA vs. 2.31 (IQR, 1.85–2.68) mmol/L in SULF2 GG], apolipoprotein B (apoB) levels (0.52 ± 0.16 g/L in SULF2 AA vs. 0.67 ± 0.11 g/L in SULF2 GG) and use of lipid-lowering therapy (69% in SULF2 AA vs. 25% in SULF2 GG) (Supplementary Table S8, Supplemental digital content 1, https://links.lww.com/CAEN/A39).
The SULF2 AA + ε3ε3 group included 1318 patients and the SULF2 GG + ε3ε3 included 166 patients. There were no important differences between the ε3ε3 subgroups (Supplementary Table S8, Supplemental digital content 1, https://links.lww.com/CAEN/A39). The most important differences when comparing the ε2ε2 subgroups with the ε3ε3 subgroups were age, BMI and plasma apoB and triglycerides levels.
DiscussionThe present study in 4386 patients at high cardiovascular risk, demonstrates that the rs2281279 genotype is not associated with metabolic parameters, including lipoproteins and insulin resistance, and does not increase the risk for vascular events or T2DM. In a patient with an ε2ε2 genotype, the AA genotype in rs2281279 seems to be associated with an unfavorable cardiovascular risk profile (larger waist, higher blood pressure and increased lipid levels).
The data of the present study do not support the important role of rs2281279 in TRL metabolism. This can be due to the fact that rs2281279 does not affect HSPG function or because HSPG itself is not important in TRL metabolism. However, it is well established that HSPG, compared to LDL-R, plays an important role in (postprandial) TRL metabolism. This was first demonstrated in five patients with homozygous familial hypercholesterolemia (without functional LDL-R). In this study, the authors found that the postprandial clearance of chylomicron remnants was normal [25], leading to the search of a specific remnant receptor. After a couple of years, it was demonstrated in several in-vitro studies [3,4,26] and genetic studies in mice [5] that HSPGs and particularly the syndecan-1 family were the TRL clearing receptor there were looking for. Also, rare genetic variants in humans that reduce the interaction or affinity of the apoE protein with HSPG, result in hypertriglyceridemia and even the typical familial dysbetalipoproteinemia lipid phenotype [15]. Taken together, the role of HSPG in TRL metabolism seems well established. Therefore, the absence of effect observed in this study might be due to the fact that rs2281279 is not a good proxy for the HSPG function. Although a previous study in human liver biopsies found an association between the rs2281279 genotype and SULF2 gene expression, functional studies investigating the association between rs2281279 and HSPG in TRL metabolism have not been performed [10].
The association of rs2281279 with fasting triglycerides levels was first identified in a cohort comprising 210 patients with T2DM and subsequently replicated in an independent cohort consisting of 1308 patients with T2DM [8]. Both cohorts found that the G allele was associated with lower fasting triglycerides levels. These associations, however, were unadjusted, and were only borderline significant in both cohorts, and might therefore be false positive.However, in two subsequent studies, one in 29 obese patients with T2DM and one in 68 normolipidemic healthy subjects, it was also found that carrying at least one minor G allele of rs2281279 was associated with a significantly lower (postprandial) triglycerides levels [8,10]. In addition, these studies found that the minor G allele lowered fasting glucose. However, these analyses were also unadjusted and the study in healthy subjects combined hetero- and homozygotes for the minor G allele. In contrast, a larger study of 165 nondiabetic subjects from a population-based cohort found no differences in both fasting triglycerides levels and postprandial triglycerides response according to the rs2281279 genotype [12]. In addition, a Finnish prospective cohort consisting of 339 subjects with hypertension and 441 controls also found no association between the rs2281279 genotype and any of the variables (including lipids and hypertension) [11]. Sensitivity analyses in patients with obesity did not change the results in this study. The results of the present study in patients at high risk of vascular disease are in line with the two studies in nondiabetic patients. Besides the methodological issues addressed above, the differences in findings might be due to the population under investigation, with a favorable effect of the G allele of rs2281279 only being present in patients with insulin resistance. Possibly SNP rs2281279 mediates the effect of insulin resistance on Sulf2, rather than directly affecting Sulf2.
In line with this, we found a significant interaction between T2DM and rs2281279 on (log) triglycerides, with the minor G allele being associated with decreased (log) triglycerides in patients with T2DM and increased (log) triglycerides in patients without T2DM. However, these differences were very small and did not result in clinically relevant differences in median triglycerides between rs2281279 genotypes in strata of T2DM.
In the present study, rs2281279 was not associated with vascular events, including limb events, in both patients with and without T2DM. A Finnish cohort consisting of healthy controls and subjects with hypertension also found no association for rs2281279 with CVD outcomes (cerebrovascular events and ischemic heart disease) during a follow-up of approximately 10 years [11]. Therefore, we conclude that rs2281279 is not associated with metabolic parameters or clinical endpoints in nondiabetic patients at high risk of CVD.
The second aim of this study was to evaluate whether the APOE genotype modifies the relationship between the rs2281279 genotype and metabolic parameters. Therefore patients were stratified according to SULF2 genotype (AA or GG) and APOE genotype (ε2ε2 or ε3ε3). Unfortunately, due to the rarity of the ε2ε2 genotype, it was only possible to provide descriptive statistics. Although speculative, the results seemed to show that, compared to the SULF2 GG + ε2ε2 group, the SULF2 AA + ε2ε2 group had a less favorable cardiovascular risk profile, reminiscent of an familial dysbetalipoproteinemia metabolic profile, with higher total cholesterol and triglycerides and larger lipoproteins. These differences were not present in the ε3ε3 group, which possibly indicates an interaction of the SULF2 genotype with the ε2 allele. This supports the hypothesis that metabolic risk factors involved in the etiology of familial dysbetalipoproteinemia are associated with HSPG degradation. The association between HSPG metabolism and familial dysbetalipoproteinemia has not been studied before, therefore we could not compare our results to other studies. Further research into the relationship between familial dysbetalipoproteinemia and HSPG degradation is necessary.
The strengths of this prospective cohort study include a large number of patients at high CVD risk and the long follow-up. This is the largest cohort evaluating the metabolic effects of rs2281279 as well as its effects on vascular events. In addition, selection bias based on genotype was not likely, since the Hardy-Weinberg equilibrium was met (P value 0.21) based on expected allele frequencies [AA (n = 2421), AG (n = 1675) and GG (n = 290)] being comparable with the observed allele frequencies.
Several limitations of this study need to be considered. First, for the assessment of the genotype of rs2281279 imputation was used. Although this is a generally acceptable method in genetics [27], the imputation quality of this variant was high (0.836) and sensitivity analyses considering a more strict cutoff to assign best-guess genotypes did not change the results, it could still have led to misclassification. Second, in this cohort, there is no information on postprandial responses. Nonetheless, fasting triglycerides and the presence of T2DM are predictors of postprandial hypertriglyceridemia and can therefore be used as a proxy for postprandial response [28]. Third, in this study, it was assumed that the genotype of rs2281279 was a proxy for (dys)function of HSPG, but this is not substantiated by functional tests. Therefore levels of the Sulf2 enzyme or tests into HSPG function itself would provide more insight in the effect of this SNP on HSPG function. Fourth, it cannot be ruled out that the sample size used in this study is still too small to detect an effect of this specific SNP, especially in the interaction with APOE. Fifth, the current study population has a highly selected nature, which can possibly have led to selection bias or confounding by, for example, the increased use of lipid-lowering medication compared to studies in the general population. However, the absolute numbers of patients using lipid-lowering therapy specifically targeting TGs such as fibrates were very low in this cohort (2%).
In conclusion, in patients with a high cardiovascular risk, the rs2281279 genotype was not associated with metabolic parameters, including TRL metabolism, vascular events or development of T2DM. In addition, the presence of the minor G allele of rs2281279 was associated with a beneficial risk profile in patients with an ε2ε2 genotype, but not in ε3ε3 subjects.
AcknowledgementsThe authors gratefully acknowledge the contribution of the research nurses; R. van Petersen (data-manager); B. van Dinther (study manager) and the members of the Utrecht Cardiovascular Cohort-Second Manifestations of ARTerial disease-Studygroup (UCC-SMART-Studygroup): F.W. Asselbergs and H.M. Nathoe, Department of Cardiology; G.J. de Borst, Department of Vascular Surgery; M.L. Bots and M.I. Geerlings, Julius Center for Health Sciences and Primary Care; M.H. Emmelot, Department of Geriatrics; P.A. de Jong and T. Leiner, Department of Radiology; A.T. Lely, Department of Obstetrics & Gynecology; N.P. van der Kaaij, Department of Cardiothoracic Surgery; L.J. Kappelle and Y.M. Ruigrok, Department of Neurology; M.C. Verhaar, Department of Nephrology & Hypertension, F.L.J. Visseren (chair) and J. Westerink, Department of Vascular Medicine, University Medical Center Utrecht and Utrecht University.
The work presented in the article has not been previously published or presented in whole or in part.
The UCC- SMART study was financially supported by a grant of the University Medical Center Utrecht. The funders had no role in study design, data collection and analysis, decision to publish, or preparation of the manuscript.
Conflicts of interestThere are no conflicts of interest.
References 1. Taskinen MR, Borén J. New insights into the pathophysiology of dyslipidemia in type 2 diabetes. Atherosclerosis 2015; 239:483–495. 2. Nordestgaard BG. Triglyceride-rich lipoproteins and atherosclerotic cardiovascular disease: new insights from epidemiology, genetics, and biology. Circ Res 2016; 118:547–563. 3. Fuki IV, Kuhn KM, Lomazov IR, Rothman VL, Tuszynski GP, Iozzo RV, et al. The syndecan family of proteoglycans. Novel receptors mediating internalization of atherogenic lipoproteins in vitro. J Clin Invest 1997; 100:1611–1622. 4. Williams KJ, Fless GM, Petrie KA, Snyder ML, Brocia RW, Swenson TL. Mechanisms by which lipoprotein lipase alters cellular metabolism of lipoprotein(a), low density lipoprotein, and nascent lipoproteins. Roles for low density lipoprotein receptors and heparan sulfate proteoglycans. J Biol Chem 1992; 267:13284–13292. 5. Stanford KI, Bishop JR, Foley EM, Gonzales JC, Niesman IR, Witztum JL, et al. Syndecan-1 is the primary heparan sulfate proteoglycan mediating hepatic clearance of triglyceride-rich lipoproteins in mice. J Clin Invest 2009; 119:3236–3245. 6. Chen K, Liu ML, Schaffer L, Li M, Boden G, Wu X, et al. Type 2 diabetes in mice induces hepatic overexpression of sulfatase 2, a novel factor that suppresses uptake of remnant lipoproteins. Hepatology 2010; 52:1957–1967. 7. Hassing HC, Mooij H, Guo S, Monia BP, Chen K, Kulik W, et al. Inhibition of hepatic sulfatase-2 in vivo: a novel strategy to correct diabetic dyslipidemia. Hepatology 2012; 55:1746–1753. 8. Hassing HC, Surendran RP, Derudas B, Verrijken A, Francque SM, Mooij HL, et al. SULF2 strongly prediposes to fasting and postprandial triglycerides in patients with obesity and type 2 diabetes mellitus. Obesity (Silver Spring) 2014; 22:1309–1316. 9. Karczewski KJ, Francioli LC, Tiao G, Cummings BB, Alföldi J, Wang Q, et al. The mutational constraint spectrum quantified from variation in 141,456 humans. Nature 2020; 581:434–443. 10. Matikainen N, Burza MA, Romeo S, Hakkarainen A, Adiels M, Folkersen L, et al. Genetic variation in SULF2 is associated with postprandial clearance of triglyceride-rich remnant particles and triglyceride levels in healthy subjects. PLoS One 2013; 8:e79473e79473. 11. Kunnas T, Solakivi T, Määttä K, Nikkari ST. Glucuronic Acid Epimerase (GLCE) variant rs3865014 (A>G) is associated with BMI, blood hemoglobin, hypertension, and cerebrovascular events, the TAMRISK study. Ann Hum Genet 2016; 80:332–335. 12. Hassing HC. Glycobiology in cardiometabolic homeostasis [PhD thesis]. Universit
留言 (0)