
Remember me

Psuedolesions represent an important issue for radiologists because they could be misdiagnosed as real space-occupying lesions on contrast-enhanced computed tomography (CECT). According to literature, these abnormalities of liver attenuation on CECT are the result of a perfusion imbalance within distinct blood supplies of the liver caused by vascular anatomical anomalies or injuries.1
This article provides a brief overview of the hepatic vascular anatomy, with a special attention toward the factors potentially leading to these abnormalities, the standard triphasic CT acquisition technique, essential to correctly detect and interpret these findings, and the physiopathological factors underlying the radiological findings on CECT. A systematic description of these abnormalities is provided based on radiological criteria (hyperattenuation or hypoattenuation, localization, and morphology). In addition, relevant examples are provided from our hospital case series. Helpful tips are given to assist radiologists in identifying patients who require further investigation.
OVERVIEW OF THE LIVER VASCULAR ANATOMYThe liver has a unique vascularization with 3 sources of blood in flow (arterial, portal, and venous from adjacent structures that do not drain to the portal vein, referred here as “third inflow” and further defined hereinafter) and a venous outflow via the hepatic veins.2,3
The hepatic artery accounts for approximately 25% to 30% of the hepatic blood flow. It originates as a branch of the common hepatic artery and divides into the right and left hepatic arteries near the hepatic hilum.2 Anatomical variants of hepatic arteries are common (up to 40%–45%)4–7 and may be associated with attenuation alterations at CECT, as shown in Figure 1,8,9 and are important in the planning of interventional radiologic procedures that may result in areas of altered perfusion.10–15 Furthermore, liver vascular malformations are commonly related to specific clinical disorders, which could be accompanied by pseudolesions.11,13,16
 FIGURE 1:
 Hyperattenuating area associated with hepatic artery variant. A shows inhomogeneous enhancement of the liver in the late arterial phase, with increased attenuation in segments II, III, and IV (arrowheads). B presents a maximum intensity projection (MIP) coronal reconstruction showing the right hepatic artery (full white arrow) originating from the superior mesenteric artery (full black arrow) and a left hepatic artery (empty white arrow) originating from the celiac tripod (empty black arrow). This anatomical variant results in slightly different contrast medium inflow in the 2 supplied territories.
The portal vein is the primary destination for venous drainage from the gastrointestinal tract, responsible for approximately 75% of hepatic inflow.2,17 It originates at the confluence between the splenic and the superior mesenteric vein and approaches the hepatic hilum where it divides into right and left branches.2,17 The main portal vein tributaries are the left gastric and the posterior superior duodenal pancreatic veins.2 The most frequent variants of the portal system concern the internal subdivision of the segmental branches.17–19
In addition to portal flow, the liver receives a second venous supply called “third inflow” from nearby structures (gallbladder, biliary ducts, stomach, abdominal wall), draining into specific liver areas (Fig. 2).20–22 The third inflow accounts for a minor but significant contribution because dilution of the portal supply may influence locoregional hemodynamics and hepatocyte metabolism. From a radiological point of view, its significance is related to the development of areas of altered enhancement or steatosis distribution.3,23,24 Anatomically, the third inflow system can be divided into different supplies: (1) gallbladder venous drainage, (2) parabiliary venous system,25–29 and (3) epigastric-periumbilical venous system.30,31 Moreover, some authors have identified an aberrant drainage from the lower surface of the right diaphragmatic dome.1
 FIGURE 2: Color overlay. The figure represents the typical sites of third inflow drainage. See text for details. FL, falciform ligament; GB, gallbladder. Figure 2 can be viewed online in color at www.jcat.org.
The gallbladder has complex venous drainage; generally, the fundus and the body of the gallbladder drain directly into the liver (segment IV b and V) via short veins that connect with peripheral intrahepatic portal branches (Fig. 2).2,3,28 The remaining part of the gallbladder is drained by small venous vessels forming one or 2 cystic veins, which may enter the liver directly, drain into the right branch of the portal vein, or, more frequently, drain into a venous plexus, called the “parabiliary venous system.”2,3,26–29 The presence of pericholecystic altered attenuation areas is frequent at CECT and ultrasound imaging.3,23,24 Areas of fatty infiltration or fatty sparing are often present as well.3,23,24
The parabiliary venous system is a venous plexus that courses just anterior to the main trunk of the portal vein within the hepatoduodenal ligament. It provides the venous drainage of the biliary tract and receives venous blood from the pancreatic head and distal portion of the stomach. It drains within the dorsal aspect of the IV hepatic segment and sometimes in part of the left lobe (Fig. 2).3,23 The role of this plexus becomes evident in case of portal thrombosis when it may dilate and form a portal cavernoma (Fig. 3A).29
 FIGURE 3:
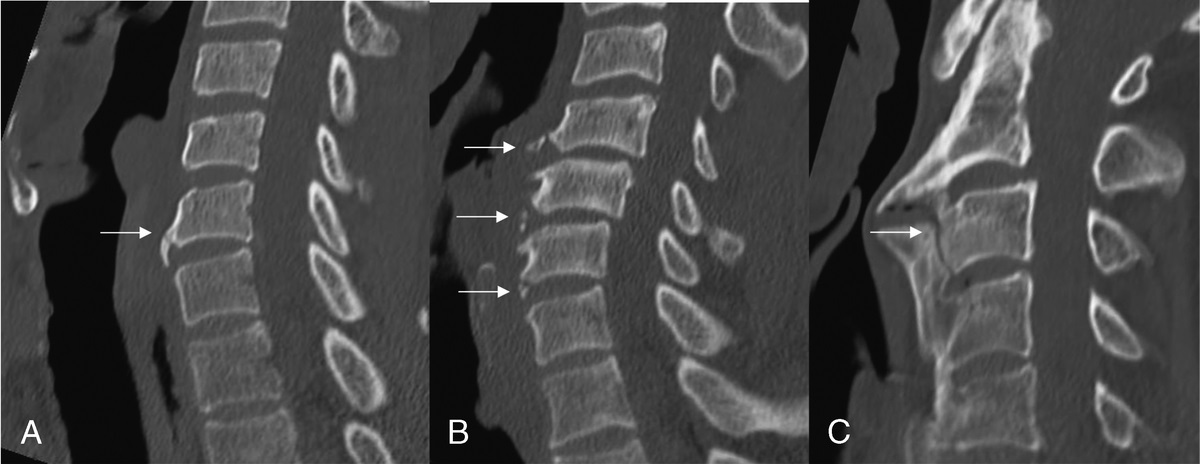
 Vessels supplying the third inflow. A shows dilated peribiliary venous vessels (arrows) at the hepatic hilum forming a portal cavernoma in a patient with portal hypertension. B and C show respectively the axial and sagittal views of the superior Sappey's vein (arrows), which serves as a collateral pathway in cirrhotic patients. The sagittal view (C) shows this vessel heading cranially to connect with the internal thoracic vein (arrows).
The 2 gastric veins not only usually drain into the portal vein but also may drain into the peribiliary plexus. Occasionally, they could develop abnormally and drain directly into the liver in segments I and IV. This peculiar normality is associated with pseudolesions, and according to some studies, it is due to morphogenetic changes in early embryonic life.3,23,26
The epigastric-periumbilical system includes small veins draining blood from the anterior part of the abdominal wall and the falciform ligament. They pass close to the ligament itself and enter the cranial portion of hepatic segments II and IV (Figs. 3B, C). The presence of this venous inflow is associated with pseudolesions.3,28 The epigastric-periumbilical system can be divided into 3 structures including Sappey's superior, inferior vein, and Burow's vein.31
The mutual connections of this venous system are evident in pathological conditions when these veins act as collateral pathways (Figs. 3B, C, see section 4.2.2 and 4.3.4).32,33
The microscopic structure of hepatic vascularity is complex, with multiple links between arterial, venous portal, and venous systemic branches.34,35 These interconnections can be divided into the following 3 groups: (1) between hepatic arterioles and portal venules, via the peribiliary plexus surrounding the bile ductules (transplexal shunting); (2) between the vasa vasorum of the portal venules (transvasal shunting); and (3) at the level of the sinusoids (trans-sinusoidal shunting).8,11,12 This network is recruited at microscopic level in case of vascular impairment (portal vein obstruction, increased sinusoidal pressure, etc). The fourth type of shunting is called “transtumoral shunting” and occurs in the presence of focal lesions.11
STANDARD CECT ACQUISITION PROTOCOLIn many institutions, multidetector CT is considered the main imaging technique for the first assessment of patients with liver diseases.36 To diagnose and characterize perfusion abnormalities, radiologists must be familiar with the acquisition protocols. Liver enhancement relies on the interaction between intrinsic (patient's anatomical variability and hemodynamics) and extrinsic factors (contrast medium iodine concentration, dose, and injection rate). For an optimal study, the suggested protocol includes 120 to 150 mL of contrast medium injected intravenously at a rate of 3 to 5 mL/s and aortic triggering with a set threshold enhancement of 100 HU.36 Slice thickness is usually between 1 and 3 mm, and multiplanar reformats are recommended in the coronal and sagittal planes for arterial and portal venous phase images.36
Triphasic CT scan including the late arterial phase, the portal phase, and the equilibrium phase is the protocol of choice for liver assessment (Fig. 4).36 During the late arterial phase (35–40 seconds after the contrast medium injection or 15–20 seconds after bolus tracking, also called “early venous portal phase” because the enhancement of the portal vein may be present), the overall liver parenchymal enhancement is minimal because the iodinated contrast via the hepatic artery is diluted approximately 3:1 in the sinusoids by the portal venous blood, which at that moment is still not yet opacified. During the hepatic parenchymal phase (70–90 seconds after the injection or 50–60 seconds after bolus tracking, also called “portal venous phase”) the liver enhancement is maximum as considering the standard duration of injection for abdominal investigation protocols, it receives 100% opacified blood from both portal vein and hepatic artery. Finally, during the equilibrium phase (3–4 minutes after contrast medium injection) and the delayed venous phase (5–10 minutes after the injection), the liver parenchyma shows a progressive contrast medium washout.37
 FIGURE 4: Triphasic CT. Below each liver, the small arrow represents the arterial flow and the large arrow the portal flow. Different shades of gray represent different levels of contrast enhancement, as in CECT. In the early arterial phase (A), all the iodinated contrast medium is within the arterial vessels and no parenchymal enhancement is visible. During the late arterial phase (B), the overall liver parenchymal enhancement is minimal because the iodinated contrast is diluted by the portal venous blood. In the portal phase (C), the liver enhancement reaches its maximum, as the liver receives 100% opacified blood. Finally, in the equilibrium phase (D), both the liver parenchyma and the blood vessels show progressive contrast medium washout. Consider that the early arterial phase is represented for clarity, but is not routinely included in the CT protocol. Figure 4 can be viewed online in color at www.jcat.org.MECHANISM UNDERLYING RADIOLOGICAL FINDINGS
Hepatic pseudolesions on CECT are resulted from a local perfusion imbalance.3,8,10,11 Overall hepatic hemodynamics involves a high degree of compensatory adaptations in case of damage. For example, in presence of portal branch occlusion, hepatic arterial input increases.11,38 This modulation, called “hepatic arterial buffer response,” is probably mediated by vasoactive chemicals acting at microcirculatory level and may be impaired in cirrhosis.11,38–40
Hyperattenuating pseudolesions are induced by a localized increase in arterial blood supply that is mostly detectable in the arterial phase and become progressively isodense in the portal phase (Fig. 5).10,11,14 The increased arterial blood supply can be primary or secondary to a reduction in portal inflow. A hypertrophic aberrant arterial artery, an arterioportal shunt, and a hypervascular tumor are all examples of primary increased arterial blood supply.3,8,10,11 A local impairment in portal venous inflow caused by thrombosis or compression (edema, mass effect, etc) could result in secondary increased arterial blood supply related to the activation of compensatory mechanisms (Fig. 6).8,11 Primary and secondary hyperarterialization may also coexist, as observed in acute cholecystitis.3,10,11
 FIGURE 5: In the bottom row, for each phase, the liver is represented with an area of impaired perfusion. Primary increase in arterial blood supply. Explicative case: MIP coronal reconstruction of the arterial phase acquisition (A) shows a wedge-shaped sub capsular hyperattenuating area (arrows) with a feeding vessel (arrowhead). The alteration is not detectable in the portal venous phase (B). Mechanism: Primary increase in arterial blood supply may be due to a hypertrophic arterial vessel, represented in C and D by a larger gray arrow. The hyperattenuating area is detectable only in the late arterial phase (A, C), when the overall contrast medium inflow is totally dependent on the arterial supply. During the portal venous phase (B, D), if no concurrent deficit in portal inflow exists, that area becomes isodense to the liver parenchyma, because each part of the liver receives fully opacified blood from both the portal vein and hepatic artery. Figure 5 can be viewed online in color at www.jcat.org.
 FIGURE 6: Secondary increase in arterial blood supply. Explicative case: The late arterial phase (A) shows the enhancement of the left lobe (full arrows), which is atrophic, and associated with a long-standing thrombosis of the left portal branch (empty arrow). In the portal phase (B), the left lobe is almost isoattenuating in comparison with the right lobe. Note the compensatory hypertrophy of the left hepatic artery (arrowhead) in A. Mechanism: In the case of a portal thrombosis (red symbols in C and D), secondary increase in arterial blood supply can occur and the arterial fraction in the affected vascular territories is greater than in adjacent area, although the total blood flow in the region tends to remain constants. Therefore, that area appears relatively hyperattenuating in the late arterial phase (C), when the liver enhancement is totally dependent on the arterial supply, and isoattenuating in the portal venous phase (D), thanks to arterial compensation. Figure 6 can be viewed online in color at www.jcat.org.
Hypoattenuating pseudolesions are usually detectable in the portal phase when liver enhancement is at its peak and a barrier to portal flow is most visible.3,12,36 These changes are usually the result of a dilution of the portal blood flow by the third influx (Fig. 7) or a local impairment in the portal inflow, such as portal vein thrombosis (Fig. 8), especially if compensatory mechanisms are not fully effective (eg, in cirrhotic livers).3,12,23 An overview of liver perfusion-based pseudolesions is presented in Figure 9.
 FIGURE 7: Hypoattenuation caused by dilution (third inflow). Explicative case: B shows a typical hypoattenuating area located in segment IV (arrows), close to the falciform ligament. These alterations are typically caused by the presence of aberrant venous drainage (epigastric-periumbilical vein system). The alteration is not detectable in the late arterial phase (A). Mechanism: Dilution is a cause of hypoattenuation in the portal venous phase, related to the third inflow (represented in C and D with an additional small gray arrow). No alterations are usually detectable in the arterial phase (A, C), when the liver enhancement is totally dependent on the arterial supply. Otherwise, because of the time delay between contrast medium inflow through this aberrant venous pathway and the main portal pathway, alterations caused by the third inflow are mostly detectable in the portal phase (B, D). Figure 7 can be viewed online in color at www.jcat.org.
 FIGURE 8: Hypoattenuation caused by portal flow reduction. Explicative case: B shows a hypodense, inhomogeneous wedge-shaped area (full arrows) within the right hepatic lobe, caused by a partial thrombosis of the right portal branch (empty arrow), visible in the portal phase. The hypodense area and the thrombus are not detectable in the arterial phase (A). Mechanism: In case of portal branch thrombosis (red interdiction symbols in C and D), compensatory mechanisms may fail in effectively compensating the portal flow reduction (especially in cirrhotic livers). As a result of the lack of portal contribution of iodinated blood, a hypoattenuating parenchymal alteration can be seen in the portal venous phase (B, D) in the impaired vascular territory. No alterations are detectable in the arterial phase (A, C) when the liver enhancement is totally dependent on the arterial supply. Figure 8 can be viewed online in color at www.jcat.org.
 FIGURE 9:
 Overview of liver perfusion-based pseudolesions according to pathophysiological criteria (A) and CECT features: hyperattenuating (B) and hypoattenuating (C) alterations. See section 3 for details.
SYSTEMATIC APPROACH TO PERFUSION-BASED ALTERATIONS Pseudolesions on Unenhanced CTThe identification of hepatic steatosis and its distribution pattern on unenhanced CT is essential to further characterize pseudolesions on CECT.3,24 Nonalcoholic fatty liver disease is a common condition associated with obesity, type 2 diabetes, and dyslipidemia.41 On unenhanced CT, the normal liver is slightly more hyperdense than the spleen and the blood, with a mean attenuation value of approximately 55 HU.42 Moderate to severe steatosis is characterized instead by relative hypoattenuation (more than 10 HU less than the spleen) or absolute attenuation lower than 40 HU, and intrahepatic vessels appear hyperattenuated than the hepatic tissue.24
Unusual hemodynamics are associated with hepatocyte metabolic alterations resulting in specific distribution patterns of hepatic steatosis, including focal fatty infiltration or fatty sparing areas.3,23,43–47 Distinctive features help the radiologist in the differential diagnosis between these alterations and space-occupying lesions: (1) typical site in the “third inflow” drainage territory, (2) adipose content (hypodensity on unenhanced CT), (3) nonmass-like morphology (usually wedge shaped), and (4) absence of mass effect. Typical sites of fatty sparing are the dorsal area of segment IV, the medial aspect of the caudate lobe, and the gallbladder bed. These elements also apply to ultrasound examinations.
Diffusely decreased parenchymal attenuation is a nonspecific finding in acute hepatitis,24 and a heterogeneous pattern can be seen in Budd-Chiari syndrome and passive hepatic congestion.13 In addition, hepatic steatosis could rarely appear because multiple lesions spread throughout the liver parenchyma mimicking liver tumors and liver metastases.1,48
Hypoattenuating AlterationsHypoattenuating alterations in the portal phase can be caused by dilution (third inflow, Fig. 7) or reduction in portal blood supply (Fig. 8).
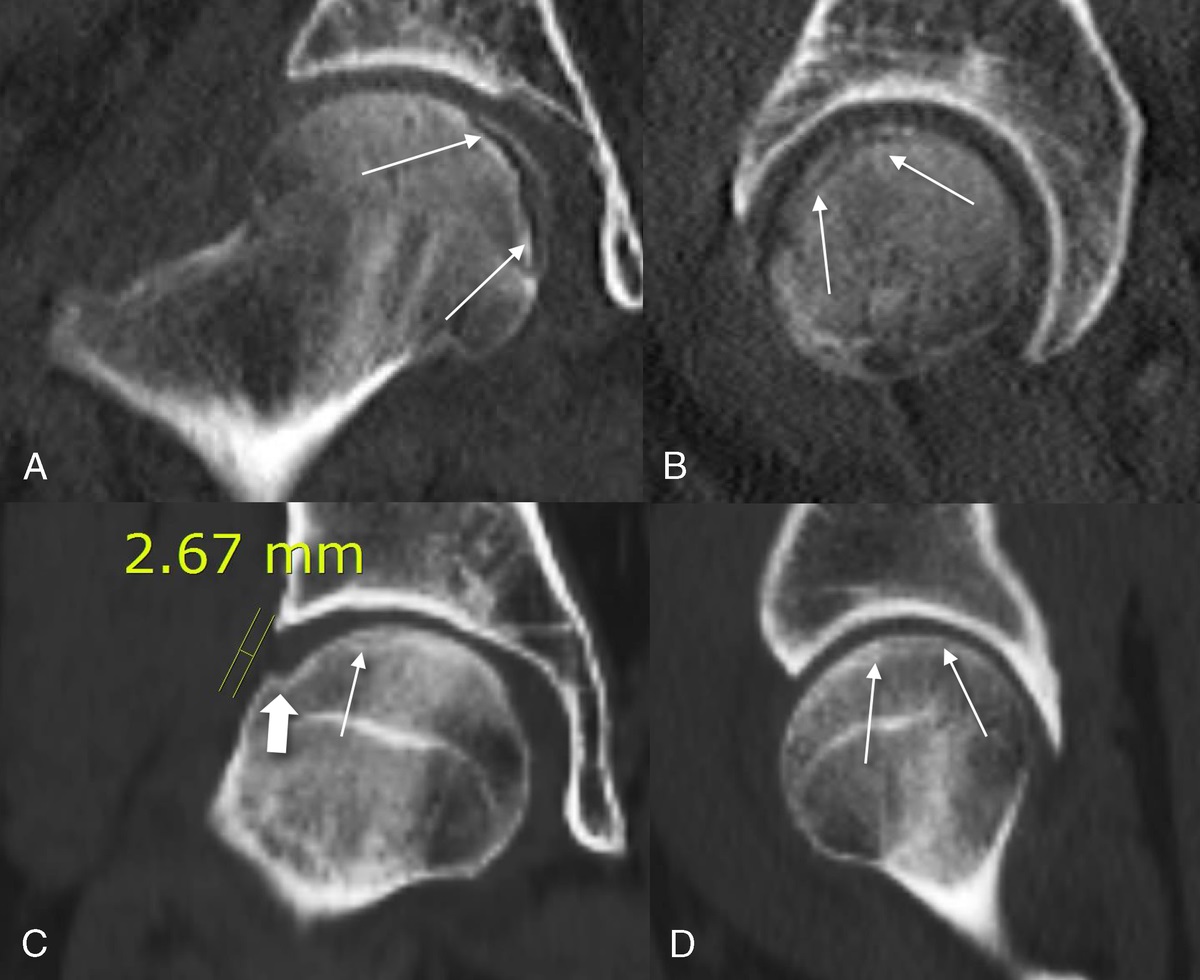
Pseudolesions Secondary to Ribs or Diaphragm CompressionPseudolesions caused by ribs or diaphragm compression are visible in the portal phase as tiny (1–2 cm in diameter) semioval subcapsular modifications with blurred outlines adjacent to the visceral surface of a rib or a diaphragmatic bundle.3,49 The seventh to the eleventh right ribs are more frequently involved, especially in elderly patients, producing alterations in the lateral segments VI–VII (Fig. 10), and rarely in the V.
 FIGURE 10:
 Compression pseudolesions. The figure shows 2 compression pseudolesions (full arrows) in the lateral segments of the right lobe, detectable in the portal phase. They appear as semioval, subcapsular hypodense alterations with blurred edges close to the visceral surface of 2 ribs.
Compression is thought to cause a reduction in portal contrast medium delivery without a major change in arterial flow, and therefore, they are more evident in the portal phase.3,49
TipsPseudolesions secondary to ribs or diaphragm compression are located adjacent to the visceral surface of a rib or a diaphragmatic bundle. They can disappear or translate with different levels of inspiration. There is no evidence of wall bulging of the Glisson's capsule, arterial hypervascularization, or mass effect on adjacent vascular structures.
Hypoattenuating Alterations in the Third Inflow AreasHypoattenuating alterations in the IV segment are typically located dorsally, close to the hepatic hilum, or ventrally, close to the falciform ligament (Figs. 7, 11). Their location in the dorsal area of the IV segment is usually explained by the contribution of the parabiliary venous system.3,22,26
 FIGURE 11:
 Hypodense alterations associated with the third inflow. The figure shows 2 typical pseudolesions located in segment IV, close to the falciform ligament (full arrow) and the dorsal aspect of segment IV (empty arrow).
Some studies have pointed out the role of the aberrant right gastric vein (or pyloric-duodenal-pancreatic vein) draining directly into the posterior aspect of segment IV3,23,50–55 and sometimes also in segments II and III.56,57 In a similar manner, pseudolesions in the dorsomedial aspect of the left lobe (segments II and III) are associated with aberrant left gastric veins drainage.58,59
In the drainage region of the third inflow, fatty sparing areas are frequently visible as hyperattenuating areas on unenhanced CT.3,24,47,50,60 The presence of hypoattenuating alterations in the posterior portion of the left lobe should be carefully investigated in a patient with gastric cancer because local vascular spreading may occur via aberrant gastric veins.61
Hypoattenuating alterations close to the falciform ligament (in the ventral aspect of segments II, III, and IV) are frequently detected during the portal phase (Figs. 7, 11).3,23 The involvement of the epigastric-periumbilical veins is well understood because they function as collateral pathways. For example, in the case of inferior vena cava thrombosis, a hypoattenuating area can be seen adjacent to the cephalic portion of segment IV.3,62–64 A mirror hyperattenuating image (also called “hot quadrate sign”) can be seen in case of superior vena cava thrombosis (see paragraph Transient Hepatic Attenuation Differences in the Third Inflow Area).3 Dilated periumbilical veins can also be observed entering the liver along the course of the round and/or falciform ligament.
Pseudolesion close to the falciform ligament may show both fatty sparing and focal steatosis, but instead of other third inflow areas, focal fatty infiltration seems to be typically associated with epigastric-periumbilical system.62
TipsHypoattenuating alterations related to the third inflow are located in specific areas and generally show a triangular shape and blurred outlines; fatty sparing almost always coexists in patients with nonalcoholic fatty liver disease and it is clearly detectable on unenhanced CT. Usually, CECT is sufficient for diagnosis, but in suspicious cases, radiologist should consider follow-up or magnetic resonance (MR) imaging. When there is a history of gastric cancer, hypoattenuating alterations in the dorsal part of segment II are suspicious. Lymphadenopathies adjacent to the hepatogastric ligament are a warning sign.
Wedge-Shaped and Polymorphic Hypoattenuating AlterationsWhen observing a wedge-shaped hypoattenuating alteration in the portal phase, a portal branch thrombosis must first be suspected, especially in patients with hypercoagulability states. Contrast-enhanced computed tomography usually allows the visualization of an intraluminal opacification defect and impaired vascular territory (Fig. 8). In chronic thrombosis, portal cavernoma can be observed (Fig. 3A).29
In case of portal branch thrombosis, a hidden focal lesion causing compression or infiltration of the portal branches should be excluded. In young patients, whose compensation mechanisms are very effective, the hypoattenuating area may not be detectable in the portal phase and indeed a slight overenhancement may be detected (Fig. 12). Because of its double vascular inflow, ischemic infarction is rare and usually occurs as a complication of liver transplantation.13,65
 FIGURE 12:
 Lobar THADs associated with portal thrombosis. The figure shows an acute massive thrombosis of the portal branch for the left lobe (empty arrow) in a 32-year-old female patient taking oral contraception. Also in the portal phase, note the presence of a weak enhancement of the left lobe (asterisks) due to the effectiveness of the hepatic arterial compensatory flow in a young patient.
Polymorphic hypoattenuating alterations should be distinguished from infiltrative malignancies, such as infiltrating cholangiocarcinoma. Retraction of the hepatic capsule, bile ducts dilatation, peripheral contrast enhancement, and association with hilar adenopathies are all warning signs, which help the differential diagnosis.66 Conversely, distinguishing perfusion-based hypoattenuating pseudolesions from hypovascular metastases is usually easy, because the latter are round-shaped, have mass effect, and grow in size with time. Moreover, the history of the patients, blood tests, and oncological markers when available should always be considered.
TipsWhen a wedge-shaped area is observed in the portal phase, the radiologist should always look for a portal branch thrombosis. The thrombus is usually detectable in the portal phase. If a portal branch thrombosis does exist, the radiologist should investigate possible hypercoagulability states, including neoplasms. Small nodular lesions can compress or infiltrate peripheral portal branches and are difficult to detect on CT scan; therefore, one should carefully analyze the arterial phase and the delayed phase as well. If the etiology remains unclear, MR imaging should be considered. If retraction of the hepatic capsule, bile ducts dilatation, or lymphadenopathies are present, then the patients should be further investigated to rule out malignant lesions.
Hyperattenuating Alterations or Transient Hepatic Attenuation DifferencesBecause of the widespread use of triphasic CECT, hyperattenuating alterations are frequently reported and their interpretation may represent a diagnostic challenge for the radiologist, especially in cancer patients. The concept of transient hepatic attenuation differences (THADs) was first introduced in 1982 by Itai and refers to an area of parenchymal enhancement detectable on CECT during the arterial phase, which progressively becomes isodense in the portal and late phase (Figs. 5, 13).3,8 “THAD” refers to the radiologic features on CECT and not to the etiology. Concerning the underlying mechanism, hyperattenuating alterations in the arterial phase may be caused by primary (Fig. 5) or secondary increased arterial blood supply (Fig. 6).
 FIGURE 13:
 Two typical examples of THADs. A and B show 2 classical examples of wedge-shaped subcapsular THADs (full arrows) in the arterial phase. They are visible in the subcapsular location as wedge-shaped hyperattenuating areas, with the base facing the hepatic edge and the vertex facing the hilum. In B, a hypertrophic artery is well detectable (empty arrow).
Wedge-Shaped THADsTransient hepatic attenuation differences can frequently be described as small, peripheral wedge-shaped hyperattenuating areas with straight borders, the apex toward the hepatic hilum, and the base running parallel to the capsule (Fig. 13). Circumscribed, peripheral THADs are often related to small arterioportal shunts opening the passage of contrast medium from a high-pressure arterial branch into a low-pressure peripheral portal vein branch.3,8,10,15,67
Large, wedge-shaped THADs may be associated with major arterioportal shunts. The main characteristic of arterioportal fistulas is the early opacification of the portal branches in the arterial phase, which could be topographically associated with THADs. Arterioportal shunts are rarely congenital but more frequently are iatrogenic, caused by biopsies or radiofrequency ablations (Fig. 14)15 or posttraumatic events. Arteriovenous shunts are frequent in vascular malformation syndromes, such as hemorrhagic telangiectasia.13,14
 FIGURE 14:
 Transient hepatic attenuation differences associated with iatrogenic arterioportal and arteriovenous shunt. Contrast-enhanced computed tomography of a patient submitted to thermal ablation of a metastatic lesion from colon cancer in segment VI. In the arterial phase (A), a wedge-shaped THAD is detectable in the right lobe (full arrows). The MIP reconstructions (B) highlight a feeding arterial vessel (arrowhead) with early opacification of the portal branch for segment VI (full arrow) and right hepatic vein (empty arrow), suggesting the coexistence of iatrogenic arterioportal and arteriovenous shunt. Note for comparison the poor enhancement of other portal branches. In the portal phase (C), the THAD is not detectable but the passage of the ablation needle (arrow) and the target mass (asterisk) are visible.
Wedge-shaped THADs can be caused by secondary increase of arterial blood supply compensating the reduction of the portal inflow, such as in portal branch thrombosis.10–14 In these cases, THADs affect the supplied vascular territory of the occluded portal branch and may involve the entire hepatic lobe (Fig. 6); the enhancement pattern (THADs vs hypoattenuating area) depends on the time from the onset as well as the effectiveness of the intrahepatic compensatory mechanisms (compare Figs. 6 and 8).
Wedge-shaped THADs may also be associated with focal lesions and the morphology may vary, depending on whether the lesion is centrally (more fan shaped) or laterally (more wedge-shaped) located.3,8,10,11,68 When benign, THADs are usually tiny and located near the hepatic capsule; however, this is not always the case.10 Small, flash-filling hemangiomas may present as THADs, and the differential diagnosis with small foci of hepatocellular carcinoma (HCC) may be challenging in cirrhotic patients.11 Larger hemangiomas can be characterized by more focal hyperattenuating, although heterogeneous alterations in the arterial phase; because they are normally associated with arterioportal shunts, wedge-shaped peripheral THADs and a hypertrophic supply vessel are often clearly detectable in the arterial phase (Fig. 15).9,10,30,68
 FIGURE 15: Wedge-shaped THAD associated with hemangiomas. Coronal MIP reconstruction showing 2 peripheral hemangiomas (empty arrows) in segment VI, associated with a wedge-shaped THAD (full arrows). The feeding vessel (arrowhead) arising from the right branch of the hepatic artery (asterisk) is visible. A similar example is provided in Figure 5.
In oncological patients, the appearance of several wedge-shaped zones of hyperattenuation should always be suspected as underlying metastases inducing portal hypoperfusion by compression or direct infiltration of the peripheral portal branches (Fig. 16).10,11,68
 FIGURE 16:
 Subcapsular THADs associated with focal lesions. The detection or sudden appearance of a THAD should always be considered suspicious in cancer patients. A shows some sub capsular wedge-shaped THADs (full arrows) in a patient with newly diagnosed pancreatic cancer. Further investigations with contrast-enhanced MRI (B) revealed the presence of hidden metastatic lesions (empty arrows).
TipsIn healthy liver, wedge-shaped subcapsular THADs are mostly benign. The presence of a more focal enhancement within them is generally associated with hemangiomas; in this case, a small supply vessel is often detected. Early enhancement of the portal/venous vessels suggests the presence of a shunt. The appearance of multiple wedge-shaped THADs in a cancer patient should suggest occult metastases. In cirrhotic patients, HCC must always be excluded.
Lobar or Multisegmental THADsConcerning the underlying mechanism, lobar or multisegmental THADs may be considered a particular case of wedge-shaped THADs. They are usually associated with a primary increase of arterial blood supply due to the large accessory arterial vessels or thrombosis of a major portal branch.10,14 The degree of liver enhancement depends on the time from the onset as well as the effectiveness of the compensatory mechanisms (Figs. 6, 12). The presence of anatomical variants of the hepatic artery can explain differences in perfusion timing of the hepatic lobes (Fig. 1) resulting in a lobar THAD. This alteration can be highlighted when the vascularization of one of the lobes is stenotic or infiltrated.10,14 Finally, extrahepatic impairment of portal venous flow can result in lobar or multisegmental THADs.11
TipsIn case of lobar or multisegmental THADs, radiologists should look for thrombosis or extrinsic compression of main portal branches. Large shunts are often iatrogenic.
Polymorphic THADsIn the absence of a focal lesion, polymorphic THADs are usually caused by compression, reactive hyperemia or a combination of both mechanisms. After liver trauma, a subcapsular hematoma may cause sinusoids compression and arterial compensatory overflow.10,11,15 Similar aspects may be observed with bilomas, due to the mass effect.10,14 Moreover, sectorial, polymorphic THADs are associated with postsurgical collections (Fig. 17), abscesses, long-standing biliary obstruction (Fig. 18) and acute cholecystitis.3,10,14,69–71 In these cases, the presence of a THAD in the arterial phase is the result of both the reactive arterial hyperemia caused by inflammatory mediators and sinusoid compression (Fig. 19).10,14,69 Thrombosis of the portal vein is common in patients with acute cholecystitis as well and contributes to different patterns of increased attenuation.71
 FIGURE 17:
 Polymorphic THAD associated with a postsurgical fluid collection (asterisks), after hepatic metastasectomy. In the arterial phase, a hypervascular halo surrounding the collection is visible (white arrows) and could be related to the sinusoid compression and reactive hyperemia.
 FIGURE 18:
 Polymorphic THAD associated with long-standing biliary obstruction. An irregular, inhomogeneous hyperattenuating area (
Comments (0)