
Remember me

Ovarian cancer is the seventh most common cancer among women up to 75 years of age and is a leading cause of death in women with gynecological malignancies.1 Age older than 40 years, more than 90% of ovarian cancers originate from the surface (epithelial) cells of the ovary, termed epithelial tumors; the risk increases with age.2,3 Around 70% of women with ovarian cancer are diagnosed at an advanced stage [International Federation of Gynaecology and Obstetrics (FIGO) stages III and IV].4 That is, they have widespread tumor dissemination within the abdominal cavity, with the tumor potentially spreading to the liver, lungs, or distant organs.5 As such, their prognosis is often poor.
Surgery and platinum-based chemotherapy are the mainstay of treatment in advanced epithelial ovarian cancer (EOC). The aim of primary surgery was to achieve “optimal cytoreduction,” as the amount of residual disease (RD) (tumor remaining after surgery) is one of the most important prognostic factors for survival,6–12 along with sensitivity to chemotherapy. The term “optimal cytoreduction” has been variably defined as referring to a maximal diameter of any residual tumor of between 0 and 1 cm, with RD greater than 1 cm being branded suboptimal.7 “Complete cytoreduction” is achieved when there is no macroscopic residual disease (NMRD) (no visible tumor) left after surgery. A recently published National Ovarian Cancer Audit feasibility pilot report, by a British Gynaecological Cancer Society action group, highlights the need for more attempts at cytoreductive surgery in the United Kingdom.13 In addition, some centers may not have the expertise to achieve complete cytoreduction, potentially leading to some patients not achieving optimal results for their individual surgery. The results from the Ovarian Cancer Audit feasibility pilot shows that on average only 51% of women with stage 2–4 and unstaged ovarian cancer receive surgery in England.13 There are large disparities between surgeons and centers in their optimal and complete cytoreduction rates.14–17 The development of these skills requires a shift in the surgeon's approach to surgery but, given that the additional procedures can be learned over a relatively short period, this could lead to increases in optimal or complete cytoreduction rates with no significant increases in perioperative morbidity.15 It has previously been shown that optimal cytoreduction rates of up to 88% for primary laparotomy in advanced-stage ovarian cancer by gynecological oncologists working as a team can be achieved without any increase in morbidity.16 Recent scientific and clinical studies relating to vascular epithelial growth factor receptors and BRCA/HRD status have opened up new avenues of treatment with biological agents, including vascular epithelial growth factor receptor inhibitors18,19 and PARP inhibitors first line20–23 and in relapsed setting24,25 now becoming standard management practice. Thus, redefining the role and impact of complete cytoreduction in the overall survival (OS) outcomes of women with advanced EOC.
However, without reliable guidelines based on adequate empirical evidence, polarized views will continue to exist. Reliable quantification is important in its own right,26 especially because there is still some resistance to incorporating statistical evidence into practice in many areas.27 Although few refute the general conclusions of previous evidence suggesting that survival is better where there is complete cytoreduction compared with less-than-complete cytoreduction,10,28–30 limitations in study design and in the conduct of previous analyses have not taken into account potential biases. Our review necessitated the inclusion of studies that reported adjusted analyses to attempt to minimize confounding bias. For example, if significantly more elderly women were included in a study where they were cytoreduced to NMRD than younger women with suboptimal RD thresholds, then there may be a confounding effect where suboptimal may be seen to have a better survival outcome. This is due to younger aged women being independently associated with prolonged survival, and therefore, NMRD may falsely seem to be associated as having worse survival than suboptimal RD.
Having the most up-to-date and reliable evidence is crucial to the development of clinical guidelines, and thus, it is of paramount importance that optimal analytical methods are used to appraise the available evidence.31 Network meta-analysis (NMA)32,33 is an extension to a standard pairwise meta-analysis that can incorporate and synthesize multiple treatments, or in this case RD thresholds, allowing for direct and indirect comparisons between groups that have previously not been compared in published studies. The use of NMA for guideline development is now common practice, with the method being well established within national health technology assessment agencies.34 Furthermore, the World Health Organization and National Institute for Health and Care Excellence (NICE) have included recommendations on NMA within their clinical guidelines.35,36 However, current guidelines related to optimal cytoreduction for women undergoing primary EOC surgery are not based on the highest level of evidence. A NMA on the back of the recent comprehensive systematic review (SR) in this area should provide robust evidence to policy makers in the field.31,37 The NMA reported in this SR is the precursor underpinning the Bayesian analyses that adjust for publication bias.38 The Bayesian analyses are presented as the second part of this research and the publication is included in the same edition.
METHODS AimTo assess the impact of RD after primary debulking surgery in women with advanced EOC. This review explores the impact of leaving varying levels of RD after primary debulking surgery.
Eligibility criteriaWe included retrospective prognostic studies that included adult women (older than 18 years) with surgically staged advanced EOC (FIGO stage III/IV) who had confirmed histological diagnoses of ovarian cancer. The population of interest was women who had received primary cytoreductive surgery followed by adjuvant platinum-based chemotherapy.7
The impact on survival of optimal and suboptimal cytoreduction for primary advanced disease was assessed using several RD thresholds reported in the literature. Included studies reported OS for comparisons of RD thresholds after surgery and used statistical adjustment for important baseline characteristics using multivariable analyses (eg, age, stage, and grade), to minimize confounding bias.32,39 Owing to the nature of these retrospective studies, women were more likely to be allocated surgery by surgeon's preference. Consequently, there may be instances where a higher proportion of younger women, who are in better general health (measured using a performance status score40) for level of function and capability of self-care) undergo more aggressive surgery. These women may experience a better outcome than older women but this may be due to their better overall general health rather than the extent of resection. Therefore, adjusting for confounders is important to minimize effect distortion based on baseline imbalances. We included studies with a sample of at least 100 women. Smaller studies would have been restricted for the nature and extent of the adjusted analyses, due to the limited average number of participants per explanatory variable. Exclusion criteria included women with other concurrent malignancies, those who received chemotherapy before surgery (neoadjuvant), or intraperitoneal chemotherapy. This was to avoid the distortion of results to purify the data set and avoid the distorting effects of multitherapeutic interventions. Those with concurrent malignancies are not representative of EOC, and their inclusion would dilute external validity.
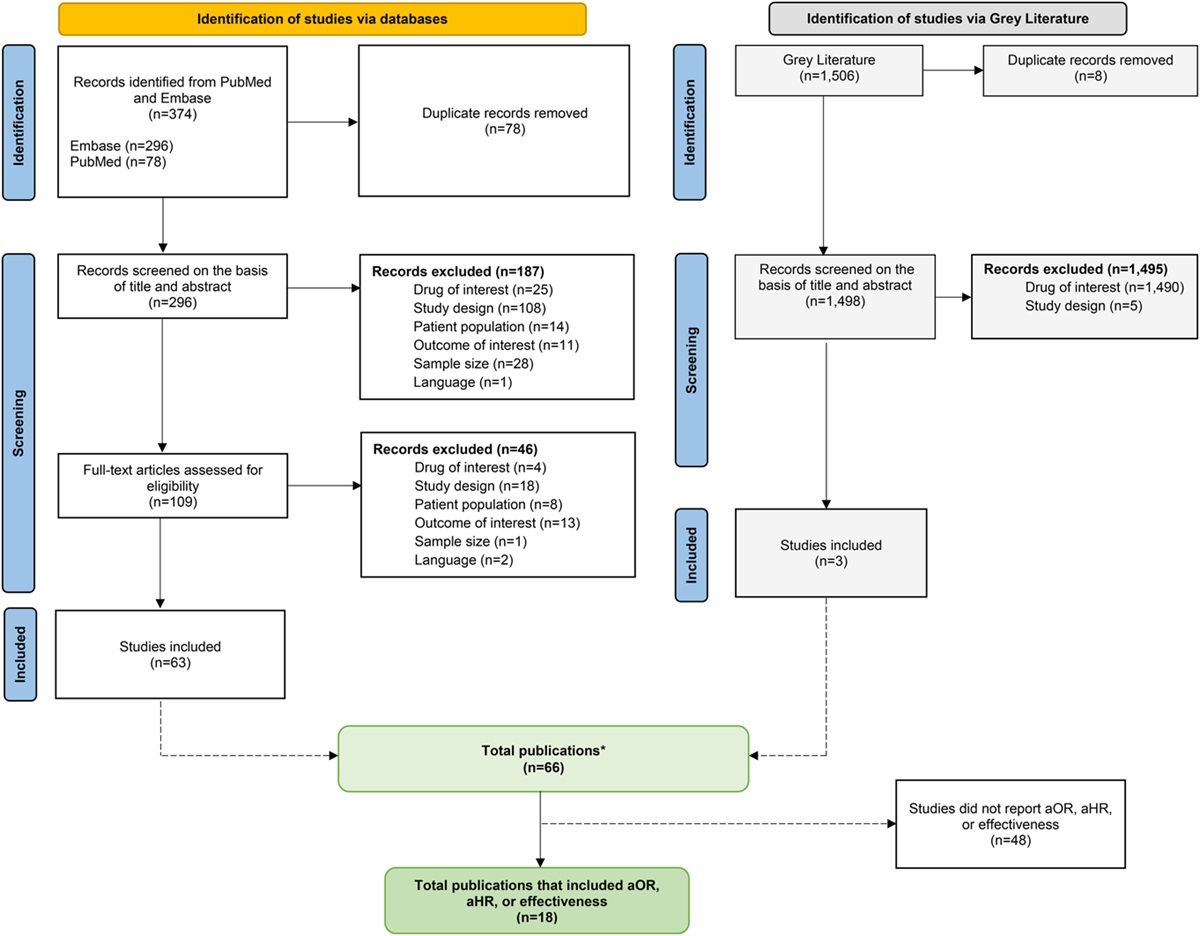
Search strategyElectronic databases were searched from 1950 up to September 2021. Full reporting details are summarized in a Preferred Reporting Items for Systematic Reviews and Meta-Analyses (PRISMA) flow chart (Figure 1) and in the published review.7
 FIGURE 1.:
 PRISMA flow diagram.
Study selection and data managementWe followed the methodology as reported in Bryant et al,7 in accordance with Cochrane guidelines.32 At least 2 review authors were independently involved in the screening process and subsequently abstracted data.7
Risk of biasAt least 2 review authors independently assessed risk of bias. Although the included studies were a combination of RCTs, prospective, and retrospective designs, the comparison of RD was retrospective in nature. We therefore assessed risk of bias (and appraised quality) in the prognostic assessment of residual diease in included studies using the QUality In Prognosis Studies (QUIPS) tool. QUIPS is a tool designed to assess the risk of bias in prognostic factor studies.41
Data synthesisThe NMA synthesized studies according to guidance from the Cochrane Handbook for Systematic Reviews of Interventions,32 NICE technical documents, and technology appraisal guidelines42 and was reported according to the PRISMA extension for NMAs.7,43,44 Although NMAs are typically used to synthesize only evidence from RCTs, the highly restrictive eligibility criteria applied to studies included in the SR underpinning the NMA permitted us to include retrospective studies, on the grounds that the women recruited into the studies being reviewed are comparable and could have been given surgery resulting in any of the RD thresholds considered in the network.37
The NMA used contrast based data and was conducted using a frequentist framework in Stata IC (version 15).45–47 The analysis adjusted for multiarm trials and used the augmented approach.47 Within the network, RD thresholds are depicted as nodes, with lines representing comparisons. All data sets and code in Stata are available on request from the corresponding author.
We did not anticipate design inconsistency to be a concern because our inclusion criteria limited heterogeneity in patient populations, primary disease, and outcomes. There was no reason to suspect effect estimates would differ substantially in comparisons of thresholds across studies.
We conducted a network meta-regression for age, stage of disease, and histology to determine the similarity of studies for inclusion in the NMA. We presented the results of the network meta-regression using effect sizes reported as hazard ratios and 95% confidence intervals (CIs) because this is more useful than presenting a single global statistic in this case. All the RD thresholds are relative to the NMRD (0 cm) reference threshold. A meta-regression has been argued to have low power and be at risk of confounding48,49 so we additionally checked summary and descriptive characteristics of studies to see whether there were any clear systematic differences between studies.
Transitivity in a NMA essentially necessitates that the underlying assumption of any indirect comparisons is that we can learn about the true relative effect of say RD <1 cm versus RD >1 cm through NMRD by combining the true relative effects of NMRD versus RD <1 cm and NMRD versus RD >1 cm. This means that we can compare RD <1 cm and RD >1 cm through NMRD. Therefore, the transitivity assumption underlying the NMA was evaluated by examining characteristics across studies; there were few concerns about potential effect modifiers across treatment comparisons as the distribution of key clinical characteristics, such as age, seemed similar across studies. Consistency, measured in agreement of direct and indirect evidence, was assessed by node-splitting analysis46,47,50,51 and a formal global test for inconsistency.46,47,51
We presented the results of the NMA using effect sizes reported as hazard ratios and 95% CIs alongside results of the pairwise analyses reported in the SR underpinning the NMA. All the thresholds are relative to the NMRD reference threshold. We did not impute missing outcome data.
We also present plots showing the relative rank of all RD thresholds in OS (rankograms), which rank RD thresholds from having the highest probability (ranked 1) to the lowest probability (ranked 9) of maximizing OS. In addition, we report the “probability of being best” RD threshold, which assigns a probability that each RD threshold results in most prolonged survival relative to all others. Cumulative ranking probabilities using the surface under the cumulative ranking curve (SUCRA) were also calculated.52 SUCRA presents a single value associated with each RD threshold. A value of 100% indicates the RD threshold is certain to be the most effective in the network (top ranked), while 0% indicates it is certain to be the least effective (in bottom rank). SUCRA was estimated through 10,000 repetitions in Stata using the network rank command.45
Sensitivity analysisBecause it was hypothesized that women with more extensive disease may have a poorer prognosis despite the outcome of their surgery, a sensitivity analysis including only studies that adequately adjusted for extent of disease at primary surgery was performed.
Certainty of the evidenceGuidance on the use of GRADE for prognostic factor studies has not yet been published,53,54 but we appraised the quality and certainty of the evidence following existing guidelines for interventional SRs.54 We based our judgment on the strength of the body of evidence based on the domains used by the GRADE Working Group (GRADE Working Group54). We interpreted our results in light of this graded evidence.
RESULTS Study selection and characteristicsThe flow of literature are shown in in the PRISMA diagram (Figure 1). The search strategy identified 8606 unique references, of which 200 progressed to full-text screening. At this stage, 154 were excluded, leaving 46 references12,14,55–94 reporting on 25 primary studies12,14,55,59–65,67,69–73,79–85,92,94 that met our inclusion criteria. Searches of the gray literature did not identify any additional relevant studies (Figure 1).
The 25 included studies assessed a total of 20,927 women, with the most having stage III disease. Three studies included a small proportion of women with early or unknown stage disease (range 3.6%–12.5%).70,73,83 The analyses in Klar et al73 included 1182 women with stage IIB-IIIB and 3684 women with stage IIIC-IV disease. This study contributed heavily to the analyses but results remained robust to its exclusion in a sensitivity analysis. See Table 1 for a full list of patient and study characteristics.
Table 1. - Characteristics of included studies in the NMA. Study Stage n (%) RD (cm) Median RD reported in all models: covariates used in multivariable cox regression model Median age in yr (range) or n (%) as reported Country III IV Optimal n (%) Suboptimal n (%) F-U in mo (range) Akahira 200155 0 (0) 225 (100) <2: 70 (31) >2: 155 (69) 47.5 (13–112) Histology and performance status 54 (26–85) Japan Aletti 200614,56–58 194 (100) 0 (0) 0: 46 (24) 1–2: 22 (11) 32.4 (0.2–126) Age, ASA, histology, operative time, and aggressive surgery 64 (24–87) USA <1: 85 (44) >2: 41 (21) Ataseven 201659 0 (0) 326 (100) 0: 157 (55) >1: 41 (14) 34 (IQR: 12–70) Age, performance status, stage, and ascites <65: 205 (63) Germany <1: 88 (31) NS: n = 40 exc >65: 121 (37) Austria Bristow 201160 405 (100) 0 (0) 0: 209 (52) 33.0 Race, grade, histology, ASA, SCS, albumin, platinum therapy, and operative morbidity 59 USA <1: 196 (48) Range not reported Chan 200361 84 (81) 20 (19) <1: 71 (68) >1: 33 (32) 33 (6–142) Age, stage, and performance status Mean = 50.5 and 61 years for younger and older women, respectively, (range: 22 and 85). USA Chang 201262 189 (93) 14 (7) 0: 63 (31) >1: 63 (31) 43 (1–124) Age, stage, and type of surgery 54 (30–78) South Korea <1: 77 (38) Chang 201263 189 (100) 0 (0) 0: 61 (32) <1: 67 (36) >1: 61 (32) Not reported Age, radical surgery, and lymphadenectomy 54 (30–78) South Korea Chi 200164 216 (77) 66 (23) <1: 71 (25) >2: 137 (49) 32 (1–139) Age, stage, and ascites 59 (22–87) USA 1-2: 73 (26) Chi 200665 465 (100) 0 (0) 0: 67 (14) >1: 229 (49) 38 (1–199) Age and ascites 60 (22–87) USA <1: 169 (37) Cuylan 201867 218 (100) 0 (0) 0: 55 (25) 31.5 Age, stage, omental, peritoneal, and bilaterality present 54 (18–78) Turkey <1: 163 (75) Eisenkop 200369 408 (100) 0 (0) 0: 351 (86) >1: 16 (4) 32.8 Sum of rankings 62.8 (24–91) USA <1: 41 (10) Feng 201670 n = 567 (91) stage III/IV 0: 209 (33) >0: 416 (67) 29 (3–100) Age, stage, and time to chemotherapy 56 (30–84) China Hofstetter 201371 158 (83) 33 (17) 0: 121 (63) >0: 70 (37) 42 TSIC, stage, age, and extent of surgery <57: 98 Europe >57: 93 Kahl 201772 428 (54) 365 (46) 0: 482 (61) >1: 85 47 (IQR: 18–87) Age adjusted CCI, performance status, stage, RD, histology, ascites, and SCS* 60 (19–88) Germany <1: 226 (39) Klar 201673–78 4488/5130 (87.5) stage III/IV; n = 4850 in RD analysis 0: 1779 (37) >1: 1629 (33) 0–144 Age, ECOG status, BMI, stage, grade, and histology Mean 57.4 (SD 10.53) Germany <1: 1442 (30) France Denmark Langstraat 201179 210 (76) 67 (24) 0: 61 (22) >1: 95 (35) 3.2 years (0–15.8) Age, creatinine, SCS, and stage Mean: 73.5 (65–89) USA <1: 120 (43) Luger 202080 91 (51) 87 (49) 0: 133 (75) >0: 45 (25) 49.6 (IQR: 33–66) Age, CA-125, histologically positive paraaortic lymph nodes, FIGO, and CPLN. 64.6 Austria Melamed 2017 81 241 (78) 66 (22) 0: 141 (59) >1: 23 (9) n = 66 missing 34.1 Age, ethnicity, stage, region, insurance status, facility type, hospital annual ovarian cancer volume, and comorbidities <60: 200 (65) USA <1: 77 (32) >60: 107 (35) Melamed 201781 4954 (77) 1506 (23) 0: 2048 (46) >1: 546 (12) <60: 2803 (47) <1: 1848 (42) 1571 missing >60: 3210 (53) Paik 201882 370 (88) 49 (12) 0: 107 (26) >1: 165 (39) 43 (3–164) Age, CA-125, stage, and normal-sized ovary Mean 54.5 (SD 10.3) South Korea <1: 147 (35) Polterauer 201283 II: 15 (7) 37 (16) 0: 157 (69) >0: 69 (31) 25.0 (1–49) Age, stage, grade, and histology Mean 57.5 (SD 11.9) Europe III: 174 (77) Tewari 201684 1241 (72) 477 (28) 0: 85 (5) >1: 932 (54) Not reported Age, ethnicity, performance status, grade, stage, histology, ascites, CA-125, and TSIC 58.5–60.2 for 0 to >1 cm RD USA <1: 701 (41) Tseng 201885 794 (81) 184 (19) 0: 408 (42) >1: 192 (19) 77.7 (1–198) Age, albumin, stage, ASA score, histology, BRCA, OR tumor index, RD, and postop IP chemo 61 (19–95) USA <1: 378 (39) Wimberger 201012 573 (100) 0 (0) 0: 70 (12) >1: 335 (59) Not reported Age, performance status, histology, peritoneal carcinomatosis, and multiple sites 59 (19–83) Germany, France <1: 168 (29) Winter 200786–92 1895 (100) 0 (0) 0: 437 (23) >1: 667 (35) 43 Age, race, performance status, histology, and grade 57 (16–86) USA <1: 791 (42) Winter 200888,89,91,93,94 360 (100) 0 (0) 0: 29 (8) 1-5: 164 (46) 28 Histology and stage IV disease site 59 (24–86) USA <1: 78 (22) >5: 89 (25) Winter 2008 <1: 78 (24) >1: 253 (76) Winter 2008 <2: 50 (20) >2: 203 (80) *SCS was added to multivariate analysis and was obtained through personal correspondence with Mr Beyhan Ataseven and included in the sensitivity analysis depicted in Table 5.F-U, follow-up; NS, no surgery group excluded; OT, operative time; PS, performance status; ASA, American Society of Anaesthesiology score; SCS, surgical complexity score; omental, omental involvement; peritoneal, peritoneal involvement; CCI, Charlson comorbidity index; ECOG, Eastern Cooperative Oncology Group; BMI, body mass index; CA-125, cancer antigen 125 protein; TSIC, time from surgery to initiation of chemotherapy; BRCA, breast cancer mutation status; OR tumor index, scoring system to reflect extent of disease; IP, intraperitoneal; sum of rankings (numerical ranking system of progressively extensive tumor involvement for 5 anatomic regions); CPLN, cardiophrenic lymph node.
The risk of bias assessments across all studies is shown in Figure 2. In general, most studies were at low to unclear risk of bias across domains but tended to be either at high or unclear risk for the statistical analysis and reporting domain. However, all included studies reported adjusted statistics to potentially minimize confounding bias. Owing to the restrictive inclusion criteria and attempts to minimize biases across the spectrum, studies were not necessarily at overall high risk of bias because they satisfied several of the criteria used to assess risk of bias.
 FIGURE 2.:
 Risk of bias in included studies.
Effects of interventionsThe network meta-regression (Table 2) summarizes most covariates (age, stage, and histology) were not statistically significant (P > 0.05) in each of the RD comparisons. Although some covariates were statistically significant (P < 0.05) in a small number of comparisons, these differences were clearly not clinically meaningful. On examination of summary and descriptive characteristics (Table 1), there were no clear systematic differences between studies. We also checked the consistency assumption after completion of the NMA. There was no evidence of inconsistency in the network (see below).
Table 2. - Network meta-regression exploring age, FIGO stage, and histology. RD* Age† FIGO stage‡ Histology§ Ref¶ (0 cm) HR‖ 95% CI** P †† HR‖ 95% CI** P †† HR‖ 95% CI** P †† <1 cm 0.98 0.96 to 1.01 0.24 1.00 1.00 to 1.01 0.13 0.99 0.99 to 1.00 0.02‡‡ >0 cm 1.03 0.93 to 1.13 0.62 1.00 0.97 to 1.03 0.86 0.96 0.93 to 1.00 0.07 1–2 cm 0.97 0.78 to 1.22 0.82 1.00 0.95 to 1.05 0.96 1.01 0.85 to 1.21 0.89 <2 cm 1.25 0.97 to 1.62 0.09 1.03 0.98 to 1.08 0.25 0.97 0.81 to 1.17 0.75 >1 cm 1.00 0.97 to 1.03 0.89 1.00 1.00 to 1.01 0.2 0.99 0.99 to 1.00 0.02‡‡ >2 cm 1.09 0.87 to 1.37 0.46 1.02 0.97 to 1.08 0.37 0.92 0.77 to 1.10 0.38*RD thresholds of 1–5 cm and >5 cm were dropped due to detection of collinearity.
†Median age reported in this study was used except when not reported and mean was used.
‡Percentage of women in this study with International Federation of Gynecology and Obstetrics (FIGO) stage III EOC.
§Percentage of women in this study with serous histology.
¶Ref, reference: RD = 0 cm was used as the reference group.
‖HR, hazard ratio.
**CI, confidence interval.
††P: significance probability. This is the probability of the observed data or data more extreme, given the null hypothesis is true.
‡‡P was statistically significant but the HR point estimates and 95% CI's clearly show this is very unlikely to equate to any meaningful clinically significant differences in the percentage of women with serous histology across studies.
Before data analysis, it is important to understand the geometry of the network.95 The network plot shows which RD thresholds have been compared directly in studies and which can only be informed indirectly. The network geometry is depicted using the network diagram in Figure 3 and shows the range of RD thresholds and comparisons after optimal cytoreductive surgery for advanced EOC.96 The RD thresholds presented in the NMA include complete cytoreduction to 0 cm (NMRD), 0.1–1 cm (0 cm < RD ≤1 cm, labelled as <1 cm for consistency with the published literature), >0 cm, 1–2 cm, >1 cm, 0.1–2 cm (labelled as <2 cm), >2 cm, 1–5 cm, and >5 cm. The nodes of some of the thresholds overlap, for example, >1 cm node overlaps with the 1–2 cm and >2 cm node, but these were all categorized as separate and unique nodes and interpreted accordingly and reflect the nature of data reported. Of note the 1–2 cm and <2 cm nodes included very sparse data so in that respect are less informative. Nodes where there were more comparative data available were for RD thresholds of 0 cm and <1 cm (indicated by the thick edge joining these 2 nodes in Figure 3). The comparisons of <1 cm and >1 cm included the 0 cm group, but this was deemed to have a negligible impact on the results and did not affect risk of bias profiles, certainty of the evidence or distort results because this was only applicable to 3 small studies.61,64,94
 FIGURE 3.:
 Network diagram showing RD comparisons after primary cytoreductive surgery for advanced EOC.
Table 3 summarizes the results of the NMA with a comparison of direct and indirect effect sizes of optimal and suboptimal RD thresholds. The results seem consistent across all split RD comparisons (sides), and there was no evidence of inconsistency in the network (P = 0.48).
Table 3. -
Comments (0)